1. Introduction
In this paper, we reassess monetary policy transmission in China. We argue that the Chinese institutional setup warrants more detailed consideration than merely reestimating models designed for the US (or other Western countries) with Chinese data.
The People’s Bank of China (PBoC) never fully adopted the idea of a single intermediate interest rate target, such as the Federal fund rate in the US monetary system. Contrarily, the PBoC employs multiple tools with very different intentions and to different ends.Footnote 1 While the PBoC has gradually been adopting a “Western-style” market-based monetary policy, that is, open market operation, it still uses benchmark deposit and loan rates at the same time, which function as de facto regulation. In a theoretical paper, Chen et al. (Reference Chen, Chen and Gerlach>2013) argue that the impact of those policies might differ vastly. Another noteworthy strand of empirical literature also acknowledges this issue but—unlike our approach that tries to identify different effects of different shocks—aims to generate “compound indicators” for the monetary policy stance that encompass the full set of tools at the PBoC’s disposal, see in particular Sun (Reference Sun>2013) and Sun (Reference Sun>2015). Both approaches have their own advantages and disadvantages. The compound indicator approach allows accounting for an even broader scope of indicators, while our approach necessarily has to focus on a few major tools to allow identification. However, this focus allows differentiating between the effect of different indicators, which is impossible when defining a unique compound indicator of monetary policy. Our paper is most closely related to He and Wang (Reference He and Wang>2012), who—as we do—also explicitly distinguish between market-based and regulation-based policies.Footnote 2
This variety of tools is aimed at a range of objectives. Apart from guaranteeing price stability, the PBoC is currently highly concerned about potential exuberance in the real estate market, and controls the yield curve as a whole rather than focusing on the short end to have tighter control over the capital market and financial stability.Footnote 3 One of the few other papers, which relate the yield curve to monetary policy in China, are Fan and Johansson (Reference Fan and Johansson>2010) and Porter and Cassola (Reference Porter and Cassola>2011). However, they only focus on the impact of monetary policy (which they measure through changes in the benchmark deposit rate) on the yield curve. Moreover, since their paper, the Chinese financial market and monetary policy have been developing dramatically. Contrarily, we are mostly interested in the yield curve to better understand the transmission mechanism and thus embed both market-based and regulation-based policy decisions and the yield curve into a fully-fledged monetary macro model.
Even the very question of how to assess this yield curve for China is not uncontroversial. The Chinese treasury bond market—where most of the open market operations of the PBoC are conducted—has a quite unique structure. Rather than one market, there are indeed two fairly strictly separated bond markets: The interbank market, where mostly major banks and the PBoC can buy or sell, and the much more liquid exchange market, where other financial institutions trade. Although the bonds traded on both markets are close substitutes in terms of their function, individual bonds are—with very few exceptions—traded on one of those two markets only. Whether the yield curves in two markets respond symmetrically to monetary policy is crucial, as many market participants can merely access one of the two markets, which implies a different impact of monetary policy on financing costs in different sectors of the market. Additionally, since the Chinese bond market only recently developed, data on both markets are highly sparse, creating additional estimation problems, as discussed by Loechel et al. (Reference Loechel, Packham and Walisch>2016) in their analysis of the yield curves on the exchange market and the Hong Kong offshore market.
We propose a two-step approach. First, we use a state space model using weekly data to estimate the yield curve dynamics, which allows a fairly precise identification of the end-of-month yield curves (on both markets) despite very sparse data. Second, we incorporate the level, slope, and curvature factors of the yield curve obtained by the first step in a standard monetary structural VAR that includes two primary indicators of Chinese monetary policy and other macroeconomic variables.
Our contribution to the literature is threefold: First, we add to the thriving studies on the quickly developing Chinese bond market by providing a model for yield curve estimation that can cope with sparse data. Second,—and this is our key objective—we provide an analysis of Chinese monetary policy transmission, that accounts for the institutional peculiarities of China, in particular the dual bond market—where monetary policy is conducted on the less liquid one—and the specific tool set used by the PBoC. Third, we contribute to the growing literature on how monetary policy affects the long end of the yield curve, which gained importance with short-term interest rates hitting the zero lower bound in many advanced economies.
2. Institutional background
2.1 Monetary policy instruments of the PBoC
During the past decade, the PBoC has been going through a transition from quantity management (focusing on M2) to price management style monetary policy comparable to the Fed. China made a great effort to liberalize financial markets, particularly interest rates, in multiple dimensions. Fernald et al. (Reference Fernald, Spiegel and Swanson>2014) and Chen et al. (Reference Chen, Chow and Tillmann>2017) find that Chinese monetary transmission is more similar to that of advanced western economies.
However, the Chinese monetary system is still distinctively different from most of its western counterparts. First, quantities still play a much more important role, as opposed to the US, where monetary aggregates essentially lost their importance after the monetarist experiment [Bernanke (Reference Bernanke>2006)]. Second, the PBoC still exerts much closer control over China’s major state-owned commercial banks. These two facts have been emphasized in Reference Chen, Ren and Zha>Chen et al., 2018. Third, while the PBoC regulates several interest rates and targets others through its open market operations, there is no unique monetary policy target rate.
Currently, the PBoC’s policy rests on three pillars. First, the PBoC conducts market-based “Western-style” monetary policy using a battery of tools at its disposal. Through open market operations, issuing central bank bills, and several liquidity facilities, they provide or reduce liquidity in the banking sector. Those instruments have in common that the PBoC directly intervenes in the market. There is no single official measure of this policy. In the long run, the PBoC aims to establish a short-term interest rate, for example, SHIBOR, as the target rate. However, since the transition to this system has not yet progressed far enough, we consider the policy instrument itself, namely the interbank 7-day repo rate.Footnote 4 Either way, previous evidence suggests that the correlation between the repo rate and the SHIBOR became much stronger over time (see Porter and Xu (Reference Porter and Xu>2009)).Footnote 5 However, as a robustness test, we replace the repo rate with SHIBOR in an alternative specification.Footnote 6
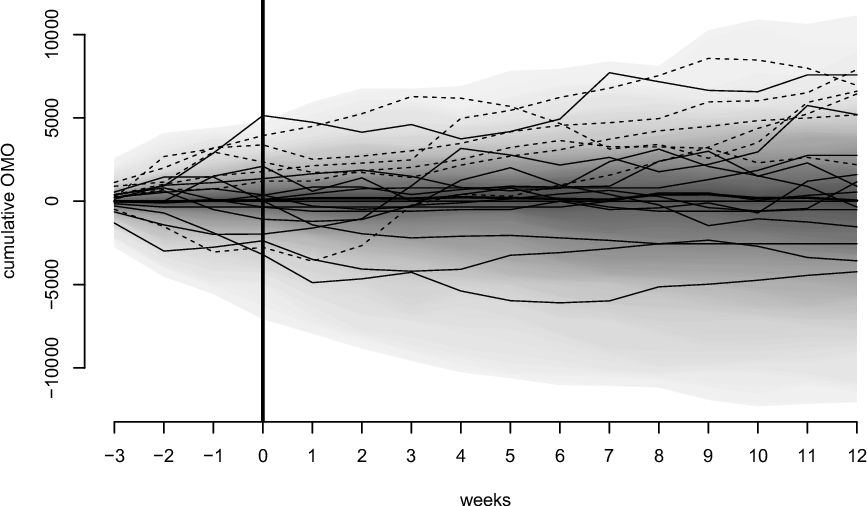
Second, there is a range of benchmark interest rates, most notably the benchmark loan and deposit rates, but also the mortgage target rate. Because of the semantic similarity due to their nature as “target” rates, the benchmark rates are frequently used as the Chinese counterpart of the Federal funds rate in empirical studies (see e.g., Fan and Johansson (Reference Fan and Johansson>2010)). However, the term benchmark or target obfuscates that China’s major banks treat it as de facto regulation. Thus, the benchmark rates are enforced through the PBoC’s authority rather than backed up by corresponding market interventions. Indeed, when looking at open market operations after a change in the benchmark rate, there is no indication of any liquidity injections (or liquidity withdrawals) after a policy change. (see Figure 1) This is in line with the results of our VAR study that show that there is basically no contemporaneous correlation between monetary policy shocks measured through the repo rate and the benchmark rate. The correlation of residuals in the two corresponding equations is entirely explained by macroeconomic shocks that impact on both interest rates (see Section 4.2 for details).
Cumulative open market operations around a benchmark rate change. Note: The shaded fan chart shows the density of the distribution of cumulative open market operations in a window of the corresponding length without a monetary policy shock. The solid black lines represent the development of cumulative open market operations after a benchmark loan rate decreases. The dotted black lines represent the development of cumulative open market operations after the benchmark loan rate increases.

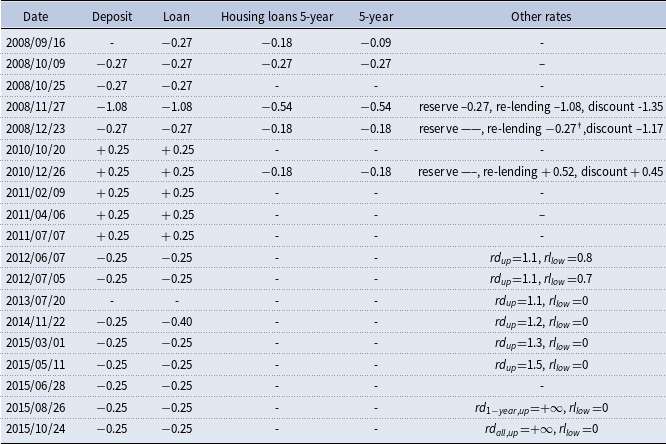
Since the deposit rate essentially moves together with the loan rate and the mortgage rates are adjusted separately only very infrequently, see Table 1, we use the benchmark loan rate as a single proxy for this “authoritarian” policy component. Similarly, benchmark rates for different maturity loans change simultaneously by the same number of basis points during our sample, making them informationally equivalent. The regressions are run with the shortest maturity.
In addition to controlling the price, the PBoC has occasionally implemented some window guidance to directly control the volume of loans (and its growth rate). Because the officers of both state-owned and private commercial banks are in the promotion or recruiting pool of the PBoC system, regulation agencies, and state-owned financial companies, anecdotal evidence suggests that they are very cautious and self-disciplined in their compliance to window guidance out of long-run career concerns.Footnote 7 Although there are no systematic data available on this aspect of the policy, Chen et al.(Reference Chen, Ren and Zha>2018) confirm this fact and takes it as the main reason for shadow banking booms and monetary ineffectiveness since 2008
The interest rate policy change by PBoC 2008-2016

Note: Deposit and Loan, respectively, stand for benchmark deposit rate and benchmark loan rate; Housing loans shows the interest rate of housing provident fund loan in below 5-year and above or equal to 5-year categories. In the “Other rates” column, the change of interest rate of reserve, excess reserve, re-lending, and discount can be found. We also track the interest rate liberalization,
 $rd_{up}$
represents for the upper-bound limit on deposit rate, and
 $rl_{low}$
represents for the lower-bound limit on loan rate.
Finally, regulation, especially the required reserve ratio, still plays a more important role in China than in most Western countries, where required reserves are rarely a binding constraint. However, during our sample, the required reserve ratio does not change frequently enough to allow robust identification of a regulatory shock. Additionally, during most of our sample, Chinese law strictly limited the loan to deposits ratio to at most 75%, which was typically the binding restraint. The increasing role of the required reserve ratio is a fairly new phenomenon. Therefore, for the remainder of the paper, we will abstract from this component of monetary policy.
2.2 Chinese government bond yields
The central government of the People’s Republic of China began to issue government bonds back in the 1950s, but the issuance was suspended for 13 years until 1981. However, central government bonds played an important role in supporting expansionary fiscal policy and facilitating central bank open market operations ever since the government bond market was fairly small. Only in 2008, financing its expansionary fiscal policy and aiming to create a more complete yield curve, China’s bond market expanded drastically. As of today, there are different categories of central government bonds in China: certificate central government bonds for individual investors, book entry electronic central government bonds for individual investors (saving central government bonds), and book-entry central government bonds for institutional investors. The coupon rate can be either fixed or floating, and the time to maturity (at issuance) is 3-month, 6-month, 1-year, 3year, 7-year, 10-year, 15-year, 20-year, and 30-year. Since the initial expansion, the Chinese Ministry of Finance has recently started to continuously issue treasury bonds at all maturities up to 10 years on a fixed schedule and also implemented outstanding volume management rather than issuance volume management.
However, the issuance of Chinese central government bonds is still far less frequent than US Treasury bonds. Correspondingly, the yield curve is still far from complete.
In this paper, we focus on the yield curves implied by the book-entry central government bonds with fixed coupon rates active in either the interbank or exchange markets from January 2008 to December 2016. Our yield data series for term structure estimation uses daily closing prices and the cash flow schedule of each individual bond. To estimate a yield curve, we use a quarterly grid with maturities of up to 10 years. If there are no bonds available with matching maturity, the yield is interpolated using maturities within 45 days. Despite this interpolation, there are still plenty of missing observations in the earlier part of our sample when the bond market was still developing.
We use time series based on the Wednesday yield curves for our econometric analysis. With the PBoC conducting all its major monetary policy interventions on Fridays, this gives the markets enough time to absorb any information.Footnote 8
2.3 The dual Chinese bond market
The Chinese bond market has been developing for more than 30 years since bond trading was reinstalled in 1981. The current bond market system in China consists of three parts: the interbank market, where mostly large financial institutions and the PBoC trade, the exchange market(s), where individuals and small and medium-size institutions trade, and the over-the-counter market of commercial banks. The former two form the core of the Chinese bond market and are also the objects of interest in this paper. The over-the-counter market primarily grants less sophisticated investors access to the bond market.Footnote 9
Only being established in 1997, the interbank market is now the dominant market for Chinese bond transactions. Almost all bonds can only be traded in one of the two markets, and by now, the interbank market accounts for almost 90% of outstanding stocks and correspondingly trading volume. The market is organized as a quote-driven over-the-counter market. The PBoC not only supervises and regulates the interbank market but also is responsible for a large share of those transactions (on average about 15%) with its open market operations which are conducted on this market. While a range of financial institutions, including investment banks, security companies, insurance corporations, etc. are allowed to operate on the interbank market, its other name-giving feature is that commercial banks are required to trade bonds on the interbank market exclusively. Most participants in the interbank market are only permitted to trade bonds for their own accounts. Only 30 large banks and security companies are recognized by the National Association of Financial Market Institutional Investors as market makers and settlement agents. They can trade on behalf of others who do not have direct access to the interbank market and the bonds traded there otherwise and provide settlement service for the other self-traders in the market. While those investors who are granted indirect access may play a minor role quantitatively, they provide an important link to the rest of the financial market and the real economy.
The exchange market is operated through China’s two stock exchanges in Shanghai and Shenzhen, which were established mainly for stock transactions. Bonds have been traded in both markets since the early 1990s. However, the exchange market lost its monopoly on bond trading in China after a serious speculative attack on the Chinese central government repo. This caused the PBoC to intervene and require (commercial) banks and credit unions to trade under its closer supervision on the newly founded interbank market ever since. The bonds traded in exchange markets include some Chinese treasury and corporate bonds.
There are two parallel trading mechanisms for investors to choose from freely. The traditional approach was continuous auction trading, which is now mainly used for small-volume retail-style transactions and works like stock trading mechanism. However, in 2007, both Shanghai and Shenzhen introduced quote-driven over-the-counter style trading which is used for wholesale transactions.
At first glance, it might seem odd to pay the same attention to the (older) exchange market as to the younger but an order of magnitude larger interbank market. The reasons making this market so relevant for our analysis are twofold. First, the exchange bond market reflects the current market situation better than the interbank one due to the absence of PBoC. Second, the small- and medium-sized agents active in this market provide a major direct link to the real economy and are thus essential in understanding monetary policy transmission.
The separation between the interbank and exchange markets is less strict for treasury bonds than for corporate bonds. Although most treasury bonds can only be traded within the market where they are issued, close substitutes are available in both markets. Additionally, some treasury bonds can even be traded across markets. Therefore, although monetary policy is primarily conducted in the interbank market, it is necessary to account for the exchange market to fully understand monetary policy transmission to the real economy.
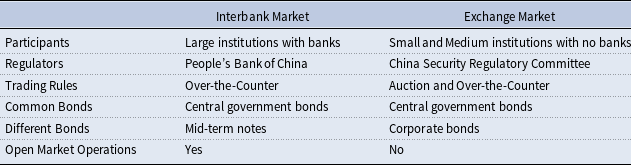
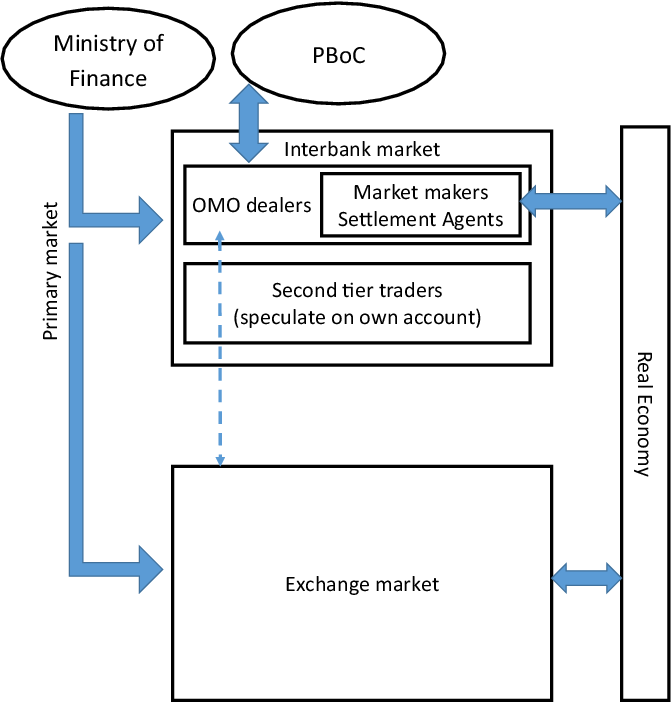
Yet, despite their interaction, there are few arbitrage opportunities between the markets, mostly due to vastly different regulations. While the interbank market is closely monitored and supervised by the PBoC, the exchange market is regulated by the CSRC that focuses foremost on the primary market—that is, bond issuing—rather than on the secondary market, that is, bond sales. A detailed analysis of why and when the rates differ is provided by Fan and Zhang (Reference Fan and Zhang>2007). The comparison of the two markets is shown in Table 2, and the interaction of the two markets is summarized in Figure 2.
3. Method and model
3.1 Yield curve estimation
3.1.1 The two market yield curve model
Like most of the literature, our model is built upon the seminal work by Nelson and Siegel (Reference Nelson and Siegel>1987) who model the yield curve as a function of three underlying parameters, usually dubbed level (
 $L$
), slope (
 $S$
), and curvature (
 $C$
) of the yield curve.Footnote
10
 \begin{equation} r_{t}(\tau )=\left [\begin{array}{ccc} 1 & \frac{1-e^{-\lambda \tau }}{\tau \lambda } & \frac{1-e^{-\lambda \tau }}{\tau \lambda }-e^{-\tau \lambda }\end{array}\right ]\left [\begin{array}{c} L_{t}\\ S_{t}\\ C_{t} \end{array}\right ]+\varepsilon _{t}, \end{equation}
where
 $r_{t}(\tau )$
is the spot rate of a treasury bond of maturity
 $\tau$
at time
 $t$
,
 $\varepsilon _{t}$
is the residual vector and
 $\lambda$
is a shape parameter. Rather than estimating this equation for every point in time, Diebold et al. (Reference Diebold, Rudebusch and Aruoba>2006) propose to assume an autoregressive process for the underlying parameters, thus explicitly modeling them as latent factors. That is, they interpret equation (1) as measurement equation of a state space model with the corresponding state equation:
 \begin{equation} \left [\begin{array}{c} L_{t}\\ S_{t}\\ C_{t} \end{array}\right ]=\left [\begin{array}{c} \mu _{L}\\ \mu _{S}\\ \mu _{C} \end{array}\right ]+\left [\begin{array}{c@{\quad}c@{\quad}c} a_{11} & a_{12} & a_{13}\\ a_{21} & a_{22} & a_{23}\\ a_{31} & a_{32} & a_{33} \end{array}\right ]\left [\begin{array}{c} L_{t-1}\\ S_{t-1}\\ C_{t-1} \end{array}\right ]+\eta _{t}=\mu +A\left [\begin{array}{c} L_{t-1}\\ S_{t-1}\\ C_{t-1} \end{array}\right ]+\eta _{t}. \end{equation}
The comparison of interbank market and exchange market

Structure of the Chinese bond market.

Since the relationship between observed interest rates of different horizons is meant to be captured through the yield curve parameters, in this line of research the covariance matrix of
 $\varepsilon$
is usually assumed to be diagonal, while shocks to the latent factors can be contemporaneously related. For the optimality of the Kalman filter, we also have to assume that there is no correlation between the shocks to the latent factors and the shocks to the measurement equation. Denoting the number of different maturities considered by
 $M$
we can thus write:
 \begin{equation} VarCov\left (\begin{array}{c} \varepsilon _{t}\\ \eta _{t} \end{array}\right )=\left [\begin{array}{cc} R & 0\\ 0 & Q \end{array}\right ]=\left [\begin{array}{c@{\quad}c@{\quad}c@{\quad}c@{\quad}c@{\quad}c@{\quad}c} h_{1} & 0 & \cdots & 0 & 0 & 0 & 0\\ 0 & h_{2} & & \vdots & & \vdots \\ \vdots & & \ddots & 0 & 0 & 0 & 0\\ 0 & \cdots & 0 & h_{M} & 0 & 0 & 0\\ 0 & & 0 & 0 & q_{11} & q_{12} & q_{13}\\ 0 & \cdots & 0 & 0 & q_{21} & q_{22} & q_{23}\\ 0 & & 0 & 0 & q_{31} & q_{32} & q_{33} \end{array}\right ] \end{equation}
Yet, the Chinese situation is slightly different. At every point in time, we do not have one but two yields for every maturity, the first one obtained from the interbank market the second one from the exchange market. Correspondingly, we have two highly related, yet potentially different yield curves. This gives a slightly more complex model taking the shape, with the measurement equation:
 \begin{equation} \left [\begin{array}{c} r_{ib,t}(\tau _{1})\\ r_{ib,t}(\tau _{2})\\ \vdots \\ r_{ib,t}(\tau _{M})\\ r_{ex,t}(\tau _{1})\\ r_{ex,t}(\tau _{2})\\ \vdots \\ r_{ex,t}(\tau _{M}) \end{array}\right ]=\left [\begin{array}{c@{\quad}c@{\quad}c@{\quad}c@{\quad}c@{\quad}c} 1 & \dfrac{1-e^{-\lambda \tau _{1}}}{\tau _{1}\lambda } & \dfrac{1-e^{-\lambda \tau _{1}}}{\tau _{1}\lambda }-e^{-\tau _{1}\lambda } & 0 & \cdots & 0\\ \\[-9pt] 1 & \dfrac{1-e^{-\lambda \tau _{2}}}{\tau _{2}\lambda } & \dfrac{1-e^{-\lambda \tau _{2}}}{\tau _{2}\lambda }-e^{-\tau _{2}\lambda } & 0 & \ddots & \vdots \\ \\[-9pt] & & & \vdots & & \vdots \\ \\[-9pt] 1 & \dfrac{1-e^{-\lambda \tau _{M}}}{\tau _{M}\lambda } & \dfrac{1-e^{-\lambda \tau _{M}}}{\tau _{M}\lambda }-e^{-\tau _{1}\lambda } & 0 & \cdots & 0\\ \\[-9pt] 0 & \cdots & 0 & 1 & \dfrac{1-e^{-\lambda \tau _{1}}}{\tau _{1}\lambda } & \dfrac{1-e^{-\lambda \tau _{1}}}{\tau _{1}\lambda }-e^{-\tau _{1}\lambda }\\ \\[-9pt] 0 & \ddots & \vdots & 1 & \dfrac{1-e^{-\lambda \tau _{2}}}{\tau _{2}\lambda } & \dfrac{1-e^{-\lambda \tau _{2}}}{\tau _{2}\lambda }-e^{-\tau _{2}\lambda }\\ \\[-9pt] \vdots & & \vdots \\ \\[-9pt] 0 & \cdots & 0 & 1 & \dfrac{1-e^{-\lambda \tau _{M}}}{\tau _{M}\lambda } & \dfrac{1-e^{-\lambda \tau _{M}}}{\tau _{M}\lambda }-e^{-\tau _{1}\lambda } \end{array}\right ]\left [\begin{array}{c} L_{ib,t}\\ \\[-9pt] S_{ib,t}\\ \\[-9pt] C_{ib,t}\\ \\[-9pt] L_{ex,t}\\ \\[-9pt] S_{ex,t}\\ \\[-9pt] C_{ex,t} \end{array}\right ]+\left [\begin{array}{c} \varepsilon _{ib,t}\\ \\[-9pt] \varepsilon _{ex,t} \end{array}\right ] \end{equation}
and the corresponding state equation:
 \begin{equation} \left [\begin{array}{c} L_{ib,t}\\ S_{ib,t}\\ C_{ib,t}\\ L_{ex,t}\\ S_{ex,t}\\ C_{ex,t} \end{array}\right ]=\left [\begin{array}{c} \mu _{ib}\\ \mu _{ex} \end{array}\right ]+\left [\begin{array}{cc} A_{11} & A_{12}\\ A_{21} & A_{22} \end{array}\right ]\left [\begin{array}{c} L_{ib,t-1}\\ S_{ib,t-1}\\ C_{ib,t-1}\\ L_{ex,t-1}\\ S_{ex,t-1}\\ C_{ex,t-1} \end{array}\right ]+\left [\begin{array}{c} \eta _{ib,t}\\ \eta _{ex,t} \end{array}\right ], \end{equation}
or more concise
 \begin{equation} \left [\begin{array}{c} r_{ib,t} \\ r_{ex,t} \end{array}\right ] = \tilde{H} \left [\begin{array}{c} f_{ib,t} \\ f_{ex,t} \end{array}\right ] + \tilde{\varepsilon }_t \end{equation}
and
 \begin{equation} \left [\begin{array}{c} f_{ib,t} \\ f_{ex,t} \end{array}\right ] = \tilde{\mu } + \tilde{A} \left [\begin{array}{c} f_{ib,t-1} \\ f_{ex,t-1} \end{array}\right ] + \tilde{\eta }_t \end{equation}
where
 $A_{11}$
,
 $A_{12}$
,
 $A_{21}$
and
 $A_{22}$
are
 $(3\times 3)$
coefficient matrices corresponding to the matrix
 $A$
in equation (2),
 $f_{ib}$
and
 $f_{ex}$
are the latent state vectors and variables marked with a tilde are the counterparts of the corresponding variables in equations (1) and (2) for this two market model. The purpose of this model extension is twofold. First, it allows us to test whether the two markets interact, by testing Granger causality between the latent variables, that is, testing
 $H_{0,A}:A_{12}=\boldsymbol{0}$
and
 $H_{0,B}:A_{21}=\boldsymbol{0}$
(see Section 4.1 for details). Second, if there exists some kind of relationship, we can obtain a more efficient estimate of the yield curve parameters by fully accounting for the relevant information. This is particularly relevant due to the sparse Chinese yield curve. This approach differs from Diebold et al. (Reference Diebold, Li and Yue>2008) who model several countries simultaneously thereby essentially also modeling several markets. However, contrary to us they model a global factor and market (country) specific factors that can load on the global factors but not vice versa. The reason that we chose a different approach is our interest in the bilateral causality.
3.1.2 Dealing with missing observations
As mentioned before, the Chinese government bond market has only fully developed quite recently. For a large part of our sample, the market was not very deep, and correspondingly, we have a lot of missing observations for specific maturities at varying points in time. Generally, the Kalman filter is well suited to deal with missing observations. If all data are missing for a specific observation, the extension is fairly straightforward and boils down to simply omitting the update step in the corresponding periods (since there is no information to base the update on). This method is fairly widespread for example when the Kalman filter is used in imputation (see e.g. Mönch and Uhlig (Reference Mönch and Uhlig>2004)). Yet, things are slightly more complex in our case, where the missing data are scattered across observations. That is, we would like to update, but base the update merely on the data that is observable. Liu and Goldsmith (Reference Liu and Goldsmith>2004) suggest to manipulate the covariance of the measurement equation
 $Q$
, by setting the variance of the missing observations to infinity. This guarantees that the corresponding residual has no impact on the estimation and can thus be treated as if it did not exist (simply treating it as zero without the appropriate correction in the covariance matrix would cause too much confidence in the Kalman forecast that seemingly produced a very low residual).
Applying this method allows us to employ the model we propose using weekly data starting in 2008.
3.2 The monthly structural VAR model
3.2.1. Model setup and structural identification
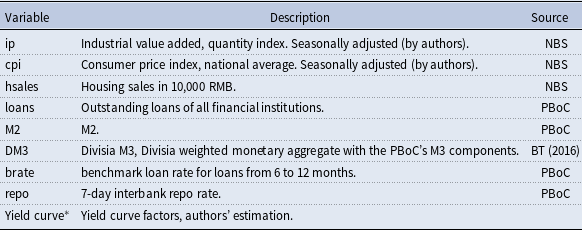
We estimate a 13-variable VAR including macroeconomic indicators, monetary policy, and financial market indicators, in particular the states obtained in Subsection 3.1 describing the yield curves on interbank and exchange markets. The macroeconomic block includes industrial output (
 $ip$
), consumer prices (
 $cpi$
), and—due to the special importance of real estate in China—housing sales (
 $hsales$
) (see e.g. Chen and Wen (Reference Chen and Wen>2017) and Chen et al. (Reference Chen, Higgins, Waggoner and Zha>2017)). In 2008, the Chinese government launched its famous 4 trillion RMB stimulus plan, that mainly focused on infrastructure and housing construction. We use housing sales instead of housing prices in our estimation for two reasons. First, there is no reliable house price index covering the entire nation for our sample period. Second, and more importantly, this does also allow to capture the increased housing sales, in particular of houses that are yet under construction, that is, not covered by current production. Monetary policy is included through the loan benchmark rate (
 $brate$
)Footnote
11
and the repo rate (
 $repo$
)Footnote
12
, the two core policy rates of the PBoC.
Finally, the financial market impact is captured through two quantity indicators—namely loans and money—and the yield curve. We consider money and loans separately, mostly due to the importance of loans in Chinese monetary policy. Since there is policy that directly affects the credit market (i.e. loan benchmark rate changes), and policy that works through liquidity provision to banks, one might easily imagine a situation where loans and money are not affected in the same way. In the baseline specification, money is measured as M2 (
 $m2$
) due to its prominence in PBoC communications. In a robustness test, we use Divisia M3 (
 $dm3$
) as reported by Barnett and Tang (Reference Barnett and Tang>2016). Finally, using the estimated end of month states from our weekly model is equivalent to including the interest rates from the estimated yield curves at specific maturities. Given the high volatility of individual bond prices in the Chinese market, and the corresponding volatility of the observed (non-smoothed/ non-estimated) interest rates at specific horizons, this seems to better capture the underlying financial market conditions. Contrarily, using observed bond yields would not only substantially reduce our sample due to missing observations, but also import unnecessary uncertainty into the macroeconomic model. A list of all variable used in the model including their source is found in Table 3.Footnote
13
Except interest rates and the underlying factors, all variables are used in natural logarithms. Since cointegration between the non-stationary
 $I(1)$
variables included in the model is confirmed by a Johansen test, we estimate the VAR in levels.
Data and sources

Note:
 $^*$
The yield curve factors
 $L_{ex}$
,
 $S_{ex}$
,
 $C_{ex}$
,
 $L_{ib}$
,
 $S_{ib}$
, and
 $C_{ib}$
for the last week of each month as estimated through equation (5). NBS = National Bureau of Statistics. BT(2016) = Barnett and Tang (Reference Barnett and Tang>2016).
To identify monetary policy shocks and assess monetary policy transmission, we build on the seminal blockwise recursive framework introduced by Christiano et al. (Reference Christiano, Eichenbaum and Evans>1999).Footnote 14
They have shown that in a recursive identification, where the order is given by
 $ [A\,x\,B ]$
and
 $A = [a_1,\, a_2, \dots ]$
,
 $B = [b_1,\, b_2, \dots ]$
and
 $X = [x_1,\, x_2, \dots ]$
, neither the sorting of variables within block
 $A$
, nor within block
 $B$
matters for the identification of the shocks to
 $X$
. That is, there is no need for a specific recursive structure to be true for correct identification, as long as there are blocks of variables that definitely react slower or faster than monetary policy, which is our shock of interest.
Following the literature, we assume that variables in the monetary policy block are affected by the state of the macroeconomy (
 $ip$
,
 $cpi$
, and
 $hsales$
), but cannot contemporarily affect those rather sluggish variables. Contrarily, the financial market indicators (
 $loans$
,
 $m2$
, and the yield curve states) can respond immediately (i.e. within the month) to monetary policy, but monetary policy cannot respond to those very volatile markets immediately due to the necessary decision process. In other words, what matters for identification of the two monetary policy shocks is merely the order of those two. In our baseline specification, we allow the benchmark rate to affect the repo rate, reasoning that the repo rate is a market rate, which could theoretically respond to a regulatory change. Yet, we find a contemporaneous effect that is quantitatively small and statistically insignificant. We test the reverse order in a robustness check, finding almost identical results, that is, even when allowing the repo to immediately affect the benchmark rate, the estimated effect is very close to zero. That is, as predicted, the two monetary policy shocks are mostly orthogonal. Although relevant theoretically, the order of the two is thus inconsequential in our specific setup. The results we report below are obtained from our baseline specification. However, all results roughly hold for the reverse order.
That is our baseline model takes the form:
 \begin{equation} \left [ \begin{array}{c} \textbf{macro} \\ brate \\ repo \\ \textbf{liquidity}\\ f_{ib}\\ f_{ex} \end{array} \right ]_t= \sum _{l = 1}^p{B_l\left [ \begin{array}{c} \textbf{macro} \\ brate \\ repo \\ \textbf{liquidity}\\ f_{ib}\\ f_{ex} \end{array} \right ]_{t-l}} + C \varepsilon _t, \end{equation}
where
 $\textbf{macro} = [ip\,cpi\,hsales ]^T$
and
 $\textbf{liquidity} = [m2, loans ]^T$
,
 $\varepsilon _t$
is a vector of orthogonal standard normal structural shocks, and
 $C$
is a block triangular matrix that maps structural shocks on reduced form shocks.
3.2.2. Small sample issues and parameter proliferation
Due to the limited availability of Chinese treasury bonds before 2008, our sample is limited to merely 108 monthly observations from January 2008 to December 2016.
Even when considering at most three lags, the number of parameters we would have to estimate in our system of 13 equations is considerable. Therefore, following El-Shagi and Kelly (Reference El-Shagi and Kelly>2017) we run a Least Absolute Shrinkage and Selection Operator (LASSO)-based lag selection. That is, rather than selecting a fixed number of lags for each variable and each equation, every individual coefficient is assessed, whether it contributes sufficiently to the model or not. This implies that the equations no longer use identical regressors, which is necessary for a VAR to be consistently estimated by (blockwise) OLS (Sims, Reference Sims>1980). Therefore, we reestimate the model with the parameters selected by LASSO using a seemingly unrelated regressions (SUR) approach. Our LASSO approach allows to reduce the number of estimated coefficients from 520 to merely 164.
In the more common quarterly studies, 108 observations per equation would be a fairly reasonable sample size. However, El-Shagi (Reference El-Shagi>2017) shows that finite sample bias can still be considerable with this sample size when using monthly data, because—despite the number of observations—only one or at most two business cycles are covered.Footnote 15 Following his suggestion, we thus apply a small sample correction bootstrap to our estimator. We use the indirect inference bootstrap proposed by Bauer et al. (Reference Bauer, Rudebusch and Wu>2012). Contrary to most previously used bootstrap-based bias corrections, this method does not assume the bias to be linear. Using SUR makes the bootstrap computationally substantially more demanding. Therefore, rather than using a bootstrap after bootstrap approach in the spirit of Kilian (Reference Kilian>1998) (which is extended to an indirect inference after indirect inference bootstrap by El-Shagi and Zhang, Reference El-Shagi and Zhang>2020)), we use a simple parametric bootstrap based on the results obtained with the bias-corrected estimator.Footnote 16
4. Results and interpretation
4.1 Weekly yield curve estimation
In a fully efficient capital market with no restrictions, a week is plenty of time to exploit any arbitrage opportunities and close any wedge between two markets where assets that are perfect substitutes are traded. Given the weekly frequency of our data, we would hence rather expect the markets to move together than markets moving towards each other, with future expectations for both markets being the identical. In other words, we would expect the correlation of shocks to the yield curve factors to be close to one (representing the joint movement); and
 $A_{11}$
and
 $A_{22}$
to be almost identical and
 $A_{12}$
and
 $A_{21}$
to be insignificant (implying identical future expectations). Contrarily, in completely separate markets that are not even indirectly linked and not affected by joint shocks, we would expect the correlation between residuals to the factors to be zero, and
 $A_{12}$
and
 $A_{21}$
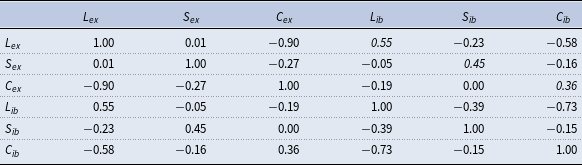
to be (again) insignificant. Our results regarding the Chinese interbank and exchange markets, however, exhibit a substantial but still imperfect correlation between the markets. Table 4 shows the correlation matrix of residuals in the state equation based on our estimate of
 $Q$
. While there is a clear co-movement between the two markets (as implied by a correlation between
 $0.35$
and
 $0.45$
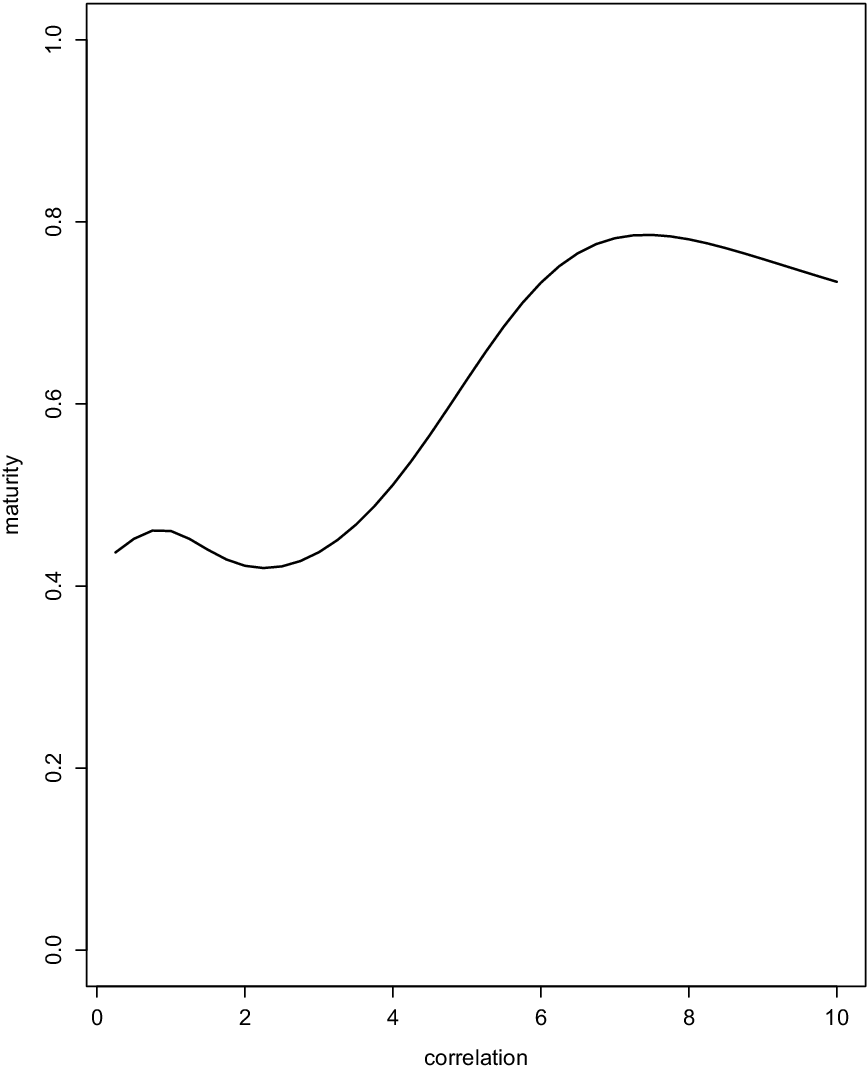
), the no-arbitrage condition clearly does not hold at the weekly frequency. To provide a more intuitive visualization, we also translate the estimated correlations between residuals in the state equation to the corresponding correlations in the yield curve.Footnote
17
The result is summarized in Figure 3. Over the entire yield curve, the correlation is clearly above 0.5, peaking at the long end where it reaches roughly 0.8.Footnote
18
Correlation between yield changes implied by
 $\hat{Q}$
.

Correlation matrix of residuals

Note: Correlation matrix of residuals (as implied by the estimate of Q). Double entries are in gray for ease of reading. Pairwise correlation between corresponding factors on the exchange market (ex) and interbank market (ib) are in italics.
At the same time, a Granger causality test clearly rejects the exclusion of either of the off-diagonal blocks of
 $A$
(from equation (2)), strongly indicating that the interbank and the exchange market mutually Granger cause each other. Since our estimation implies stationary yield curves, we can identify equilibrium yield curves for both markets in the sense of yield curves that the two markets converge to.Footnote
19
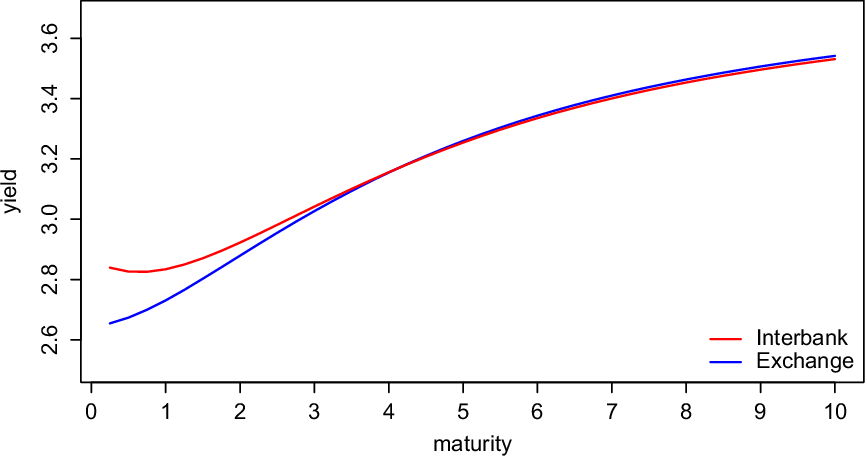
In equilibrium we find the expected results. The yield curve on both markets is almost coinciding (see Figure 4), moderately positively sloped with an equilibrium short rate around
 $2.6\%$
and an equilibrium long rate around
 $3.5\%$
. There is a very small difference in the point estimates at the very short end; However, this difference is statistically insignificant. In other words, our estimate of
 $A$
strongly suggests that a gap between markets that is driven by asymmetric shocks is closed over time, reflecting the limited market integration that is created through indirect channels, although there is no direct arbitrage because of the institutional setup.
Yield curve(s) in equilibrium.

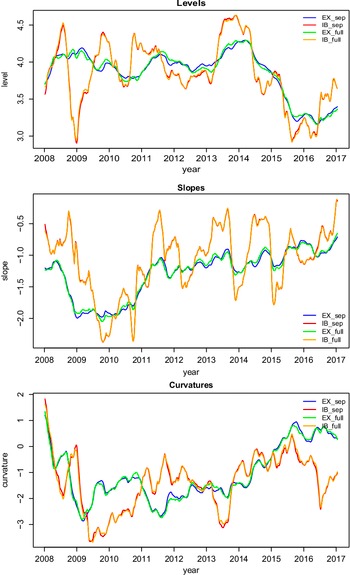
However, when comparing the state estimates obtained from a model where the two markets are considered individually and our two-market model in Figure 5, we find that it is mostly the estimates regarding the exchange market that are changed. In contrast, those for the interbank market are almost indistinguishable between the two models.
State estimates (Level, slope, and curvature) for both markets. Note: The first two letters of each lines name represent the market (EX for the exchange market and IB for the interbank market), and the last three represent the estimation method, where sep is individual estimation of both yield curves and full is estimation of the full system of equations including both yield curves.

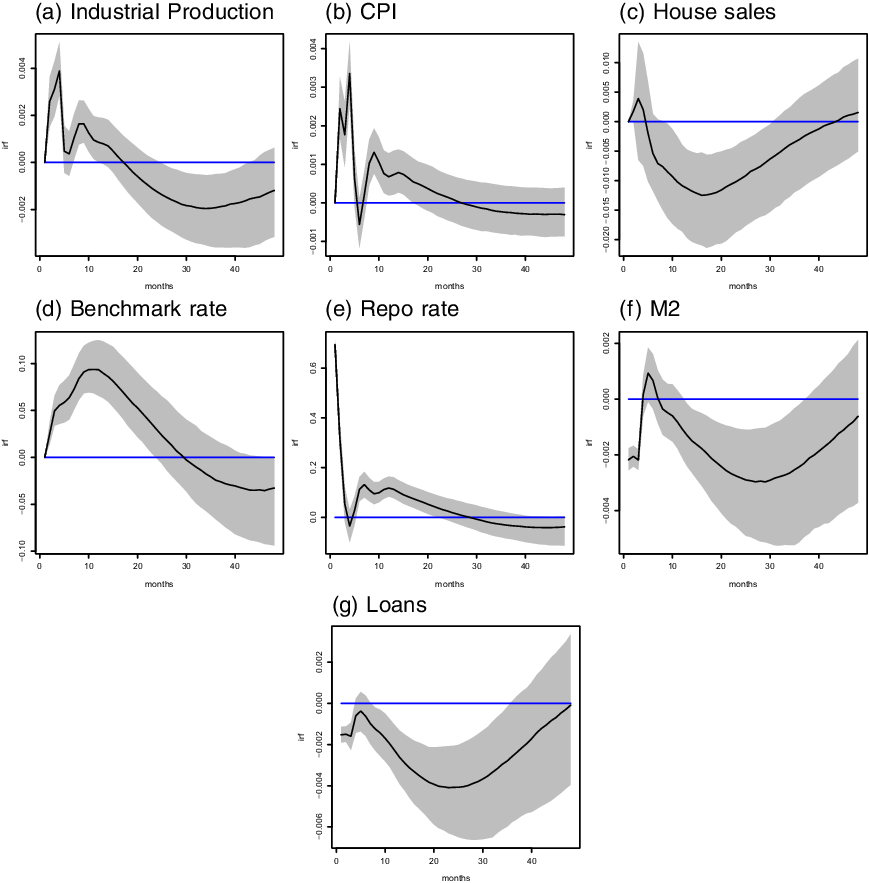
Impact of the market-based shock (Repo) on the macroeconomy.

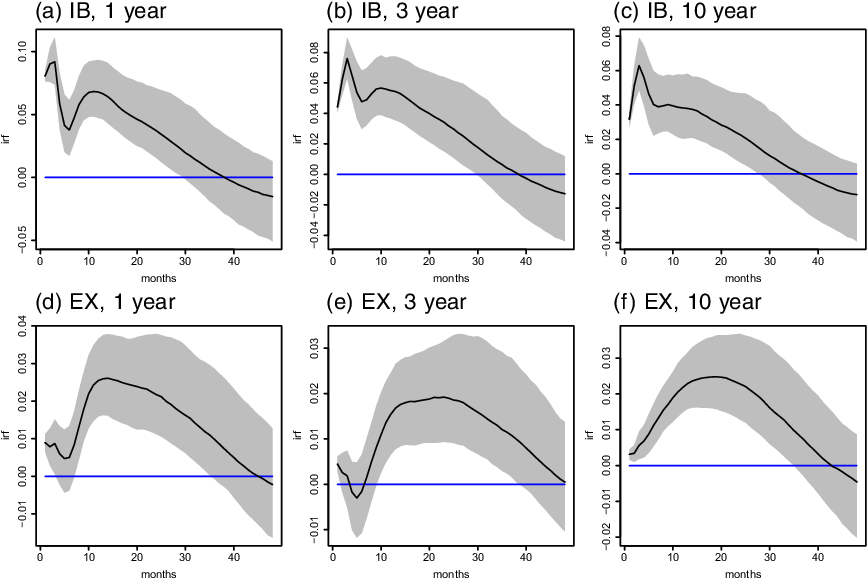
Impact of the market-based shock (Repo) on the yield curve.

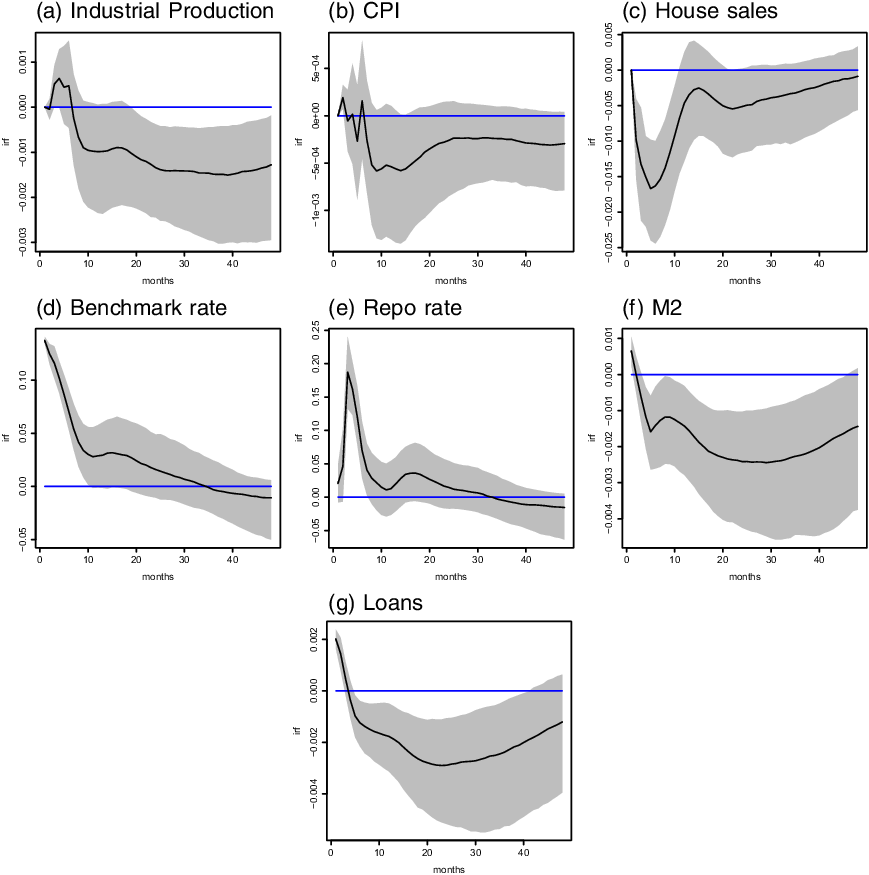
Impact of the authority-based shock (benchmark rate) on the macroeconomy.

Impact of the authority-based shock (benchmark rate) on the yield curve.

4.2 Monthly SVAR model
In this section, we report the results of the SVAR in our baseline specification, including industrial production, consumer prices, housing sales, the repo rate (as an indicator for market-based policy), the benchmark loan rate (as a proxy for regulation/authority-based policy), M2, loans, and the factors obtained from our yield curve estimation. We run several robustness checks. First, we replace the repo rate with SHIBOR. Second, we replace M2 with Divisia M2. The results are qualitatively identical. The full results for the SHIBOR-based model can be found in the online appendix. In a further robustness test discussed later in this section, we change our identification strategy for monetary policy shocks to rely on the quantity of money.
4.2.1. Market-based policy shock (repo shock)
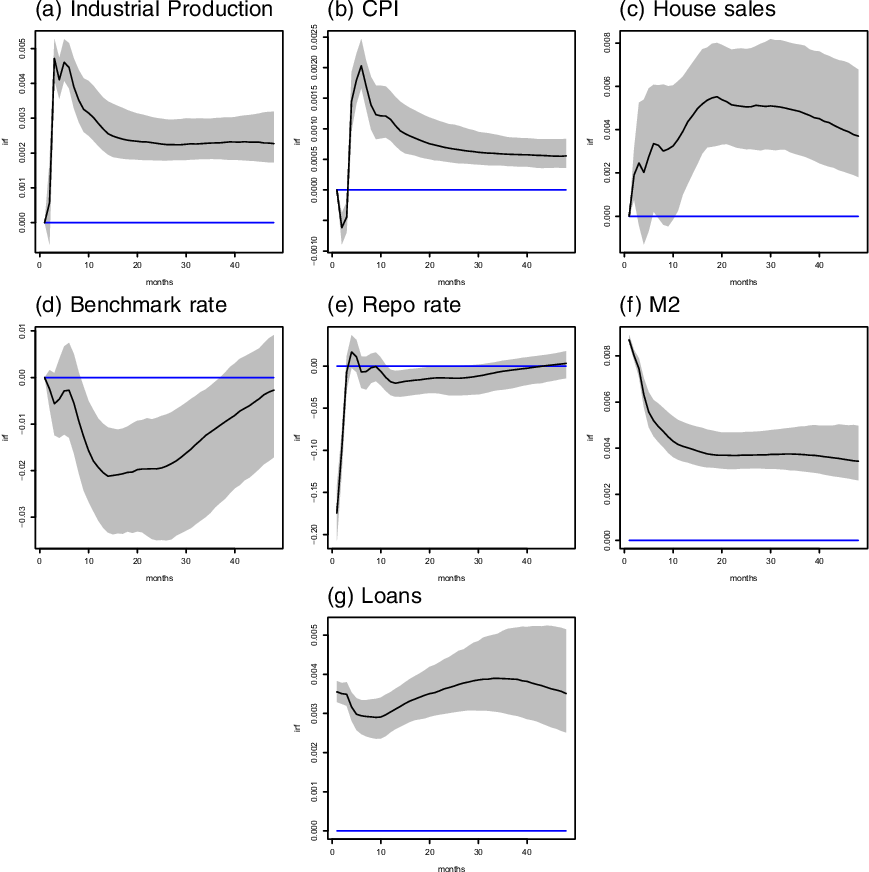
The impact of market-based monetary policy shocks on the macroeconomy is shown in Figure 6. At first glance, the results look unusual. We find some evidence for both price and output puzzles. While output quickly turns around and moves into the expected (negative) direction after an interest rate increase, the price response becomes insignificant after a short period of high volatility. This is stunning insofar, as we observe the expected clearly negative effect on both money and loans. The main effect of the changed monetary conditions seems to be in the housing sector. Unlike the counter-intuitive results for prices and (to some extent) industrial production, we observe a clear and significant decline in housing sales that remains robust for a few years.
To analyze the impact of the yield curve, we translate the latent states back to obtain the implied yield curves through multiplication with
 $\tilde{H}$
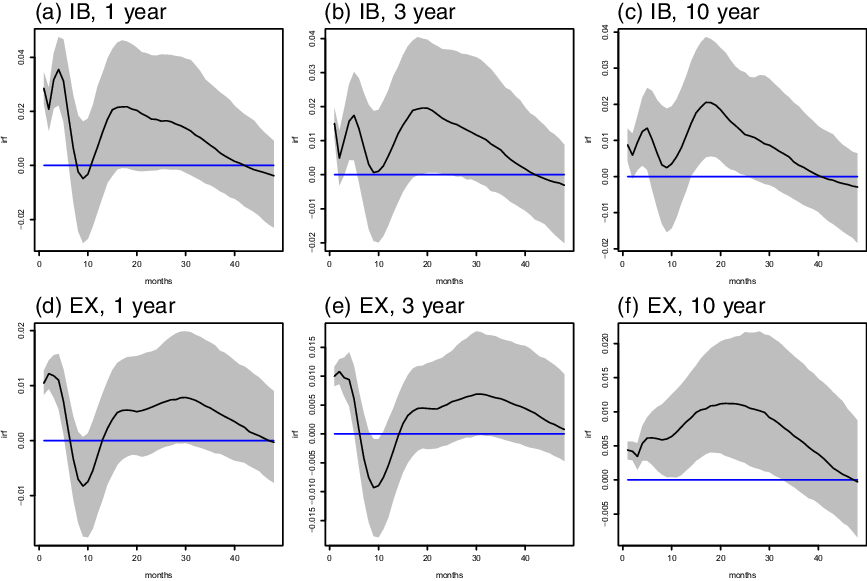
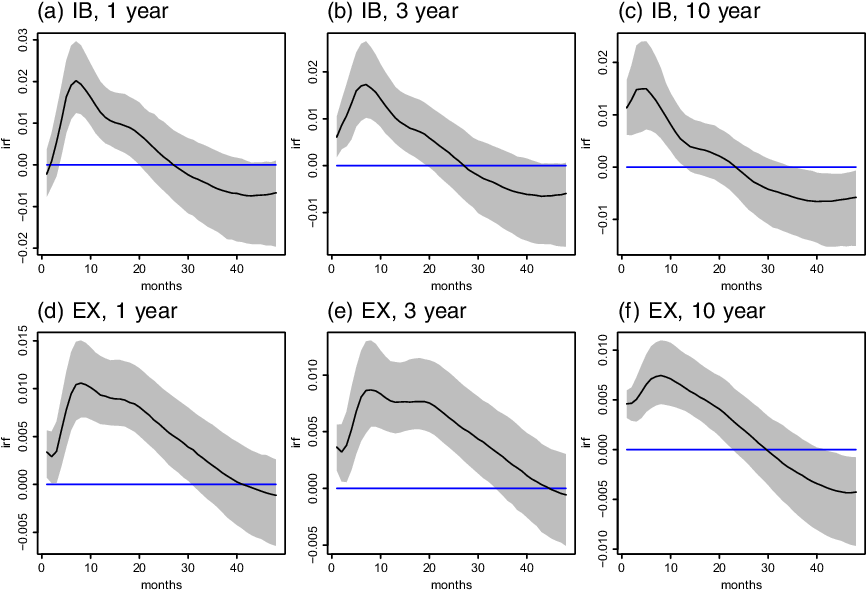
, see equation (6), to allow a more straightforward interpretation. While we could technically present yield curves for any maturity, we focus on the very short end (1-year), the medium term (3-year), and the long end (10-year) for the sake of clarity and brevity. The impact of market-based monetary policy shocks on the yields at selected maturities of two markets is shown in Figure 7. In the online appendix, we show the impact over the entire yield curve in 3D plots. On both the interbank and exchange markets, it seems that the impact on the yield curve is mostly a parallel shift, that is, all yields (in one market) move in the same direction with a similar order of magnitude. There is only very moderate evidence of a slightly flattening yield curve. There is, however, a very clear difference in the response of the interbank market and the exchange market. Unsurprisingly, the interbank market—where the monetary policy is actually conducted—responds immediately. The impact gradually declines over the coming years, while the yield curve slowly returns to equilibrium. Contrarily, the exchange market takes much longer to fully respond. The initial effect is extremely small (although generally going into the right direction). The interest rates on the exchange market peak after roughly two years, when they have almost converged to the rates on the interbank market at this time. After that, they slowly decline in line with the rates on the interbank market. While this generally supports that there is some interaction between the markets, it also highlights the substantial frictions within the Chinese financial sector that slow down the direct monetary transmission in financial markets immensely. It seems, that the bond market segmentation only allows an adjustment through the “real economy,” see Figure 2, that is, the firms and other agents who can transact with the dealers on both the interbank and the exchange market.
4.2.2. Authority-based policy shock (Benchmark rate shock)
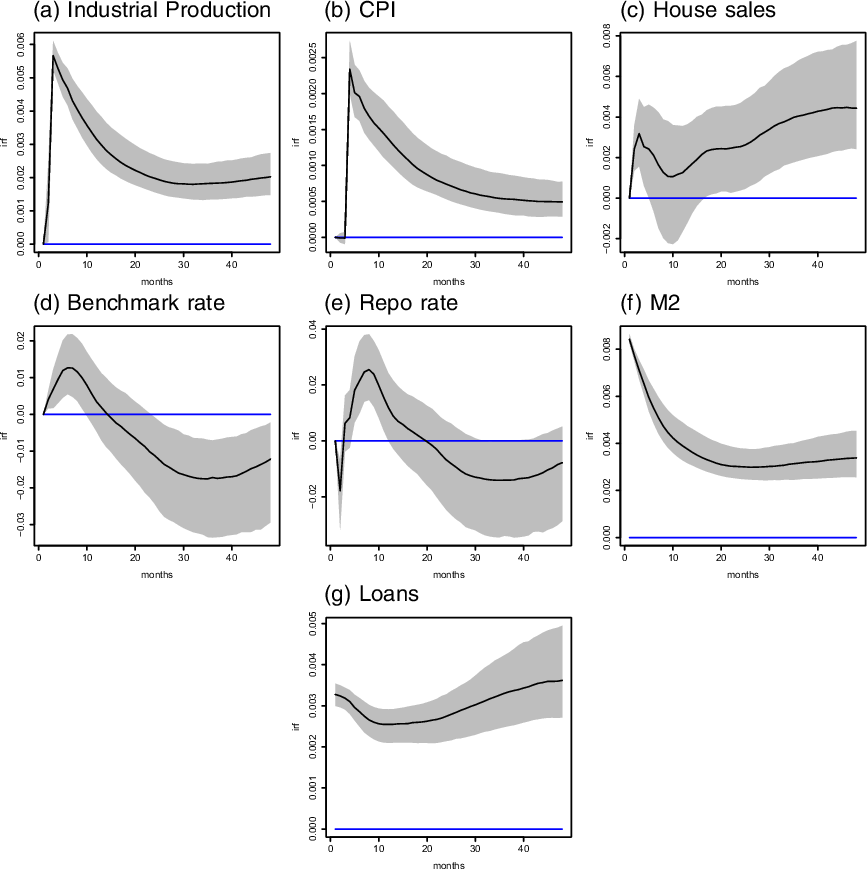
Figure 8 shows the impact of authority-based monetary policy shocks on the macroeconomy. Although a (positive) benchmark shock is similar to a (positive) repo in the sense that it works as an overall contractionary shock, the details could not be more different. Its impact on consumer prices is insignificant and more moderate on (industrial) production. However, as expected, given the importance of loans for housing, housing sales react much more sharply and quickly. The effect is not very long lived, but neither is the interest rate change.
One very interesting feature is the “loan” puzzle on impact. The initial impact of a benchmark rate change on loans is positive (and highly significantly so) before it quickly turns strongly negative. However, this can easily be explained by the regulatory nature of the benchmark rate. As discussed above, while being labeled a target, there is no evidence for immediate monetary accommodation of the new interest rate. However, banks seemingly immediately comply. If the interest rate is kept below its long-term equilibrium (which seems plausible given the interest rate of China is fairly low for an emerging market), there might be credit rationing because banks aim to limit loans. When the interest rate increases and this constraint is alleviated, banks initially supply more loans. As mentioned before, the PBoC has been known to back up its loan rate policy with more specific guidance, if the desired quantity effects are not achieved, which explains the quick turnaround into the expected direction.
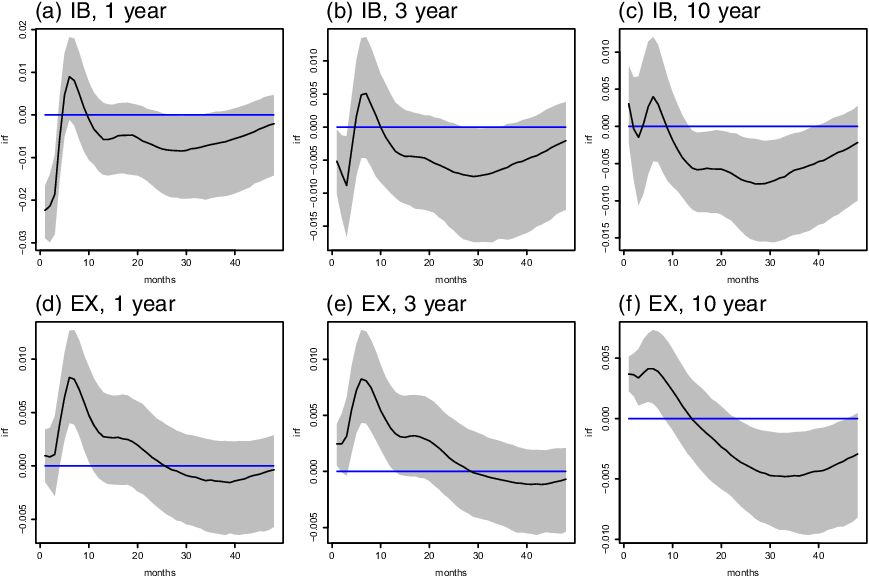
The impact of authority-based monetary policy shocks on the yield curves is in Figure 9, which also covers the yields at selected maturities of two markets. Like the shock itself, the impact on the yield curve is fairly short-lived. But, most interestingly, the effects now show immediately in both markets. While the exchange market’s response is slightly more moderate, both the interbank and exchange markets respond clearly within the same order of magnitude. Since the direct effect of the repo change (enacted through open market operations on the interbank market) is missing, and both markets are only indirectly affected through the portfolio rebalancing of market participants, this matches our theoretical prediction.
4.3 The role of money
Traditionally, the PBoC put much more emphasis on money than the Federal Reserve after the monetarist experiment under Chairman Volcker. Although official communication suggests that the PBoC has been moving toward targeting interest rates, there is a distinct possibility that it is still money rather than an interest rate that is the primary intermediate target. This section shows how our results change if we assume this is true. Money (M2), in this case, has to be treated as part of the monetary policy block, while the repo rate—much like the other interest rates included in the model—would be a financial market indicator. The results are summarized in Figures 10 and 11. Note that we always report positive shocks, that is, contrary to the interest-based identification where we looked at a contractionary shock, we now assess an expansionary monetary policy shock.
Impact of the monetary policy shock identified through M2 on the macroeconomy.

Impact of the monetary policy shock identified through M2 on the yield curve.

While largely consistent with the results presented in the previous section, there are some clear differences. The strong price puzzle and the counter-intuitive response of industrial production in the first period that we found for a monetary policy shock identified through the repo rate disappear. M2 and production quickly increase after a liquidity injection and then gradually decline. M2 itself, loans, and repo rate all move in the expected direction. Again, we find that the response of the yield curve on interbank and exchange markets differs strongly, as can be expected for a market-based shock if the intervention happens on one market only. However, while the interbank rates decrease as expected, there is a small but statistically significant increase in the exchange market yields. While the effect on the repo rate and short-term rates on the interbank market is consistent with a money supply shock, this is much more in line with a money demand-driven shock, which causes financial institutions to substitute government bond holdings for loans. These findings give some credibility to our assumption that the PBoC has by now mostly moved to interest rate-based policy, thus making the repo the better tool to identify monetary policy shocks.
Alternatively, we look at the “M2” shock in our standard framework, where the policy block only consists of the loan benchmark and repo rates. For the Cholesky decomposition, we sort M2 right after the policy shock, allowing it to affect the financial market immediately, but being more rigid than the financial market itself. The results are summarized in Figures 12 and 13. While mostly similar to the previously reported results, the impact on all interest rates is now clearly positive. In other words, the findings for M2 now completely match the general narrative associated with money demand shocks, giving some more credibility to the chosen ordering.
Impact of the M2 shock on the macroeconomy using baseline ordering.

Impact of the M2 shock on the yield curve using baseline ordering.

5. Conclusions
Our results highlight that China’s monetary system is still very different from its Western equivalents, despite many reforms over the last few decades. There is clear evidence that there are currently two distinct and mostly orthogonal monetary policy shocks: A “Western type” market-based shock, that is enacted through open market operations on the interbank market, and an “authority-based” shock, that is relying on the traditional compliance of the big state-owned banks with the PBoC’s wishes. The transmission of the market-based shocks goes from the financial sector (or rather one part of it, namely the interbank market) into the real economy and, lastly, back into the financial sector, whereas that of the authority-based shocks goes through regulation-driven loans into the real economy and then feeds back into the financial market.
The existence of separate tools for the different objectives of the PBoC—such as stabilizing consumer price inflation and avoiding an overheating real estate sector—is not necessarily detrimental, and indeed—and contrary to the Fed’s and the ECB’s policy—in line with the Tinbergen rule, which suggests one instrument per objective. However, those complexities need to be kept in mind, when assessing Chinese monetary policy.