INTRODUCTION
Rain forests in New Caledonia, in the south-west Pacific, commonly have a high diversity of flowering plants, including in forests on ultramafic substrates (Isnard et al. Reference ISNARD, L'HUILLIER, RIGAULT and JAFFRÉ2016, Morat Reference MORAT1993). Despite this diversity, some secondary forests are dominated by a single tree species. For example, Nothofagus spp. (Nothofagaceae) and Arillastrum gummiferum (Myrtaceae) commonly dominate the upper canopies of forests on ultramafic soils on the southern massif (Jaffré Reference JAFFRÉ1980), with Cerberiopsis candelabra (Apocynaceae) dominating smaller stands (Read et al. Reference READ, SANSON, BURD and JAFFRÉ2008). Population size structures and tree-ring analysis suggest that these monodominant forests established after large-scale disturbances such as fires or cyclones, and that long-term persistence of dominance is unlikely in the hypothetical absence of severe disturbance, at least at low to mid-elevations (Demenois et al. in press, McCoy et al. Reference MCCOY, JAFFRÉ, RIGAULT and ASH1999, Read & Jaffré Reference READ and JAFFRÉ2013, Read et al. Reference READ, SANSON, BURD and JAFFRÉ2008). This scenario contrasts with many monodominant forests elsewhere in the world that are dominated by shade-tolerant species, where dominance can persist without catastrophic disturbances (Connell & Lowman Reference CONNELL and LOWMAN1989, Hart Reference HART1990, Nascimento et al. Reference NASCIMENTO, BARBOSA, VILLELA and PROCTOR2007, Peh et al. Reference PEH, LEWIS and LLOYD2011, Torti et al. Reference TORTI, COLEY and KURSAR2001).
Here we ask what traits allow these species to achieve dominance in floristically diverse secondary forests. Traits promoting persistent monodominance have been discussed across a number of species (Henkel et al. Reference HENKEL, MAYOR and WOOLLEY2005, McGuire Reference MCGUIRE2007a, b; Peh et al. Reference PEH, LEWIS and LLOYD2011, Torti et al. Reference TORTI, COLEY and KURSAR2001). There has been less discussion of traits promoting non-persistent monodominance by long-lived trees, especially in species-rich rain forests (Ibanez & Birnbaum Reference IBANEZ and BIRNBAUM2014, Newbery et al. Reference NEWBERY, PRAZ, VAN DER BURGT, NORGHAUER and CHUYONG2010, Reference NEWBERY, VAN DER BURGT, WORBES and CHUYONG2013), and little investigation of seedling traits of either type of monodominant (but see Hart Reference HART1995, Newbery et al. Reference NEWBERY, CHUYONG, ZIMMERMANN and PRAZ2006, Reference NEWBERY, PRAZ, VAN DER BURGT, NORGHAUER and CHUYONG2010), even though community dynamics is strongly influenced by processes acting on seedlings (Green et al. Reference GREEN, HARMS and CONNELL2014).
Non-persistent monodominants are likely to be fast-growing and shade-intolerant, in contrast to the slow-growing, shade-tolerant strategy predicted in persistent monodominants (Connell & Lowman Reference CONNELL and LOWMAN1989, Hart Reference HART1990). Measurements of leaf-level photosynthesis confirmed that seedlings of these New Caledonian monodominants are relatively shade-intolerant (Read et al. Reference READ, MCCOY and JAFFRÉ2015). However, maximum rates of net photosynthesis (Amax) of monodominants were not higher than in some subordinate shade-intolerant species that also regenerate episodically (Read et al. Reference READ, MCCOY and JAFFRÉ2015). Instead, plant-level traits may be key to understanding how these species achieve dominance. In particular, interspecific differences in growth responses to irradiance may explain differences in dominance and regeneration, with indirect effects via carbon partitioning (Veneklaas & Poorter Reference VENEKLAAS, POORTER, Lambers, Poorter and van Vuren1998). For example, high growth rates to pre-empt resources in sunny post-disturbance environments may be facilitated by some aspect of efficient biomass allocation. Notably, the soils that develop over ultramafic substrates, supporting both monodominant and mixed-canopy forests, are very infertile, with low P, K and Ca:Mg, and high levels of metals that are potentially toxic, including Ni (Jaffré & Veillon Reference JAFFRÉ and VEILLON1990, Read et al. Reference READ, JAFFRÉ, FERRIS, MCCOY and HOPE2006). Therefore, there are likely to be strong trade-offs for resources – for root development to access soil nutrients versus stem and leaf development to optimize carbon gain relative to competitors.
In this study we investigate growth rates and biomass allocation traits that might allow species to dominate post-disturbance stands but decline in the absence of subsequent large-scale disturbance. We test the following predictions: (1) Seedlings of monodominant species grow rapidly in sunny conditions that follow a large disturbance; (2) This rapid growth is due in part to efficient biomass allocation to (a) leaves for carbon gain and (b) roots for nutrient uptake; (3) In shade, growth of monodominants is slower, similar to or lower than that of subordinate species. We also test these predictions more generally in shade-intolerant species showing episodic regeneration versus shade-tolerant species showing continuous regeneration. Growth traits were studied in seedlings of 20 tree species grown in contrasting light regimes in a nursery house.
METHODS
Species selection and growth conditions
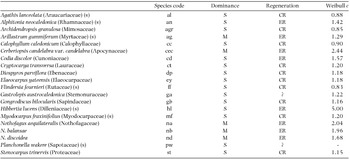
Twenty canopy species were selected from Nothofagus-dominated and adjacent mixed-canopy rain forests, including three Nothofagus spp., A. gummiferum and C. candelabra (Table 1). Species were categorized as monodominant vs subordinate species and as episodically regenerating (ER) vs continuously regenerating (CR) species (Table 1). Monodominants were categorized based on canopy cover: they commonly dominate the upper canopy of forests in terms of foliar cover, but not necessarily in terms of stand basal area (>80%: Hart Reference HART1990) (Demenois et al. in press, Read et al. Reference READ, JAFFRÉ, GODRIE, HOPE and VEILLON2000, Reference READ, SANSON, BURD and JAFFRÉ2008). Regeneration was categorized from the fit of population size structures (based on diameters at breast height) to the Weibull probability density function across monodominant Nothofagus forests and mixed rain forests (Read & Jaffré Reference READ and JAFFRÉ2013). Weibull analysis gives a measure of curve shape, c, that can provide an index of regeneration mode: values ≤1 indicate reverse-J and negative exponential curves which suggest continuous regeneration; values >1 suggest increasingly synchronous establishment up to c ≅ 3.6 where the curve approximates the normal distribution, and c > 3.6 indicates negative skewing (Bailey & Dell Reference BAILEY and DELL1973). We used c ≤ 1.2 to indicate actual or potential continuous regeneration, following Read et al. (Reference READ, MCCOY and JAFFRÉ2015). Regeneration patterns of two species (Gastrolepis austrocaledonica and Planchonella wakere) could not easily be categorized and were not included in that analysis. Forest seedlings were collected, where possible, to increase the likelihood of mycorrhizal inoculation, but some species were grown from seed (Table 1). Both seedlings and seeds were collected in the south-east of the main island, with localities given in Read et al. (Reference READ, MCCOY and JAFFRÉ2015). Seedlings were collected over an area of 0.3–1 ha, from multiple parents where possible. Plant ages were estimated as c. 6–18-mo-old (10–30 cm high) at the start of the experiment.
Rain-forest canopy species from New Caledonia used in this study, with their dominance and regeneration categories. ‘s’ after the species name indicates the species was collected as seed rather than seedlings. Species codes are those used in figures. For each species it is indicated whether they are typically monodominant (M) or subordinate (S), and episodic (ER) or continuous regenerators (CR) (Read et al. Reference READ, MCCOY and JAFFRÉ2015). Average Weibull c is taken from Read et al. (Reference READ, MCCOY and JAFFRÉ2015) based on values from 1–5 sites, not including values from disjunct population size structures. Nomenclature follows Florical vers. 22.IV.2016 (http://www.botanique.nc/herbier/florical), including retaining Nothofagus rather than Trisyngyne Baillon as reinstated by Heenan & Smissen (Reference HEENAN and SMISSEN2013). Agathis lanceolata has been reported to sometimes dominate small stands (Grignon et al. Reference GRIGNON, RIGAULT, DAGOSTINI and MUNZINGER2010, Manauté et al. Reference MANAUTÉ, JAFFRÉ, VEILLON, KRANITZ, Bieleski and Wilcox2009).

Seedlings were acclimated in nursery houses for at least 10 wk at the Vale-NC nursery facility in the Plaine des Lacs (22.27°S, 166.91°E, 260 m asl) in the south of the main island. The houses had shade-cloth walls (c. 30% shade) and a translucent plastic roof (c. 50% shade). The seedlings were planted in 3-L planter bags in soil collected from Nothofagus-dominated rain forest near the Pic du Pin Reserve in the Plaine des Lacs (collected at c. 20–25 cm depth across c. eight locations). The soil was sieved, then mixed with perlite and coconut fibre in the ratio of 75:15:10 to reduce compaction and assist drainage. Forest litter and humus were added to all pots to increase the likelihood of mycorrhizal inoculation.
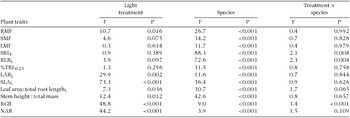
Tests of sun and shade treatment effects and differences among species in growth and biomass allocation traits in seedlings of 19–20 New Caledonian rain-forest tree species. The results from the linear mixed effects model are presented. Additive models, where appropriate (P > 0.25 for the interaction term), did not alter the conclusions of tests of main effects, so results of initial multiplicative models are shown. L, data log-transformed for analysis. RMF, root mass fraction; SMF, stem mass fraction; LMF, leaf mass fraction; SRL, specific root length; RLR, root length ratio; %TRL0.25, % terminal rootlet length <0.25 mm diameter; LAR, leaf area ratio; SLA, specific leaf area; RGR, relative growth rate; NAR, net assimilation rate.

For the experiment, four replicate blocks each of sun and shade treatments (eight blocks) were created in a nursery house using shade cloth. Shade cloth covered the ceiling and sides of each block to 30 cm above the benches, allowing air circulation across the blocks. The shade cloth created c. 50% and 20% incident irradiance in the sun and shade blocks respectively, with another layer added after 10 wk to provide c. 30% and 10% incident irradiance. Midday photosynthetic photon flux density (PPFD) was measured in the centre of each block once per week with a Li-Cor (Li-190R) quantum sensor, averaging 473 (94–1361) µmol m−2 s−1 in the sun treatment and 175 (31–441) µmol m−2 s−1 in the shade treatment. In comparison, PPFD was 20–600 µmol m−2 s−1 at 20 cm above ground level in a canopy gap (c. 8 m diam.) in a nearby Nothofagus forest, 6–12 µmol m−2 s−1 and 24–30 µmol m−2 s−1 at two locations below an undisturbed Nothofagus canopy and 6–12 µmol m−2 s−1 below an undisturbed canopy at two locations in adjacent mixed rain forest (5–10 measurements at each location, in sunlight, at midday). Hence the shade treatment was mild compared with forest conditions, but was chosen so that sufficient leaf growth occurred across all species to allow photosynthesis measurements on new leaves (Read et al. Reference READ, MCCOY and JAFFRÉ2015). The eight light-treatment blocks were positioned randomly (drawn blind) in a row. Up to four seedlings per species were positioned randomly (drawn blind) in a grid in each block, i.e. up to 16 seedlings per species per light treatment.
At the start of the experiment, a low dosage of slow-release fertilizer (2 g 270-d Nutricote® Hot Aussie Blend (Yates Australia): N, 18.1%; P, 2.6%; K, 6.7%) was added to each pot to simulate ongoing nutrient input in rain-forest soils from leaf litter. The watering regime varied with seasonal weather change, but most commonly consisted of light watering for 10 min three times daily, with 5 min h−1 of misting between 09h30 and 15h30. During the experimental growth period the maximum daily temperature averaged 25.3°C (18.1–31.6°C) in the sun treatment and 23.9°C (18.1–31.1°C) in the shade treatment, and the minimum daily relative humidity averaged 70% and 75% in the sun and shade treatments respectively (Thermocron® iButtons: Maxim Integrated, San Jose, CA, USA).
Growth rates and biomass allocation
A harvest of 7–15 seedlings per species was undertaken at the start of the experiment (July 2011) to provide initial mass and leaf area for calculation of relative growth rate (RGR) and net assimilation rate (NAR) over the full growth period. RGR was calculated per block as (ln W1 – ln W0)/time, where W0 is the initial seedling dry mass and W1 is the dry mass at the final harvest, following Hunt et al. (Reference HUNT, CAUSTON, SHIPLEY and ASKEW2002). NAR, providing an estimate of the carbon assimilation capacity of the leaves, was calculated per block as [(W1 – W0)(ln A1 – ln A0)]/[(A1 – A0) × time], where A0 and A1 are the total seedling leaf area at the initial and final harvests respectively (Hunt et al. Reference HUNT, CAUSTON, SHIPLEY and ASKEW2002). These traditional methods were used rather than fitting allometric models due to the large numbers of seedlings required for multiple harvests. Plants were removed from their pots and washed, then partitioned into roots, stems and leaves. Leaves were scanned at 300 dpi, with total area measured by image analysis (Mix Image: R. Stolk & G. Sanson, Monash University). All parts were then dried to constant mass at 60°C and weighed. There were insufficient seedlings of N. discoidea for an initial harvest, and RGR and NAR were not measured.
The final harvest was undertaken after 21–23 wk (December 2011). Stem height was measured, then seedlings were harvested and measured as described above. In addition, roots of five replicate seedlings per species per treatment were scanned at 600 dpi, and a terminal 5-cm section of root (and branches) (predominantly first-order roots, whose primary role is resource acquisition: Comas et al. Reference COMAS, BOUMA and EISSENSTAT2002) was scanned separately. Proteoid root clusters were counted in Stenocarpus trinervis seedlings and one cluster per plant was scanned at 1200 dpi. Image analysis was used to estimate total root length and root diameter profile (both including root clusters) following Read et al. (Reference READ, FLETCHER, WEVILL and DELETIC2010). Plant parts were then dried at 60°C and weighed. The following allocation variables were calculated: root mass fraction (RMF, root dry mass as a proportion of total plant dry mass), stem mass fraction (SMF), leaf mass fraction (LMF), leaf area ratio (LAR, total plant leaf area per unit total plant dry mass), specific leaf area (SLA, leaf area per unit leaf dry mass), specific root length (SRL, root length per unit root dry mass), root length ratio (RLR, root length per plant dry mass), percentage of roots and terminal rootlets <1 mm, <0.5 mm, <0.25 mm and <0.15 mm, leaf mass per unit total root length, and plant height per total dry mass. D-X, a point-based estimate of plasticity, was calculated, modified from Portsmuth & Niinemets (Reference PORTSMUTH and NIINEMETS2007): (X sun –X shade)/X sun, where X is any growth variable.
Data analysis
The effects of treatment and species on plant traits were examined via a linear mixed-effects model (LMM) (Pinheiro & Bates Reference PINHEIRO and BATES2000) that incorporated block as a random effect in order to account for the spatial dependency structure. Models included the additive effects of light regime (sun and shade) and species (ordinate with 19–20 species per light regime) if initial multiplicative models found no evidence of interactions (P > 0.25). Subsequent contrasts (with Holm P-value adjustments) were used to further explore specific comparisons (monodominants vs subordinates, and ER vs CR species) within each light regime. The LMM and contrasts were fitted using the nlme (http://CRAN.R-project.org/package=nlme) and multcomp (Hothorn et al. Reference HOTHORN, BRETZ and WESTFALL2008) packages respectively in R 3.2.2 (R Core Team, https://www.R-project.org/). Data assumptions were first checked and log-transformations were used for some variables. Trait associations across species were tested by Pearson correlation using species’ means (means of the four block averages), including associations of RGR and NAR with Amax, on both leaf-area and dry-mass basis, measured in the same plants in November–December 2011 (Read et al. Reference READ, MCCOY and JAFFRÉ2015). Patterns across species were explored with principal components analysis (PCA). Since traits from sun and shade plants were very highly correlated except for RGR and NAR, only values for sun plants were included for biomass allocation traits. RGR and NAR of both sun and shade plants were included, and also D-RGR and D-NAR (plasticity). Since species’ regeneration responses to light occur along a continuum, associations of growth traits with Weibull c were also tested by Pearson correlation. Correlation analysis and PCA were undertaken with SYSTAT v. 13.
RESULTS
Variation in biomass allocation traits and growth rates across species and light treatments
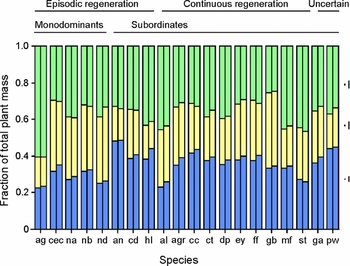
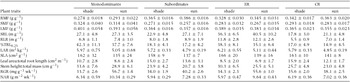
Significant differences were recorded among species for all traits (Table 2). Root, stem and leaf mass fractions varied 2–3-fold across species and light treatments (Figure 1). RMF was slightly but significantly higher in sun plants (0.363 ± 0.016 g g−1) than shade plants (0.342 ± 0.015 g g−1), but SMF and LMF were not affected by light treatment (Table 2, Figure 1).
Fractional biomass allocation to roots, stems and leaves in 20 rain-forest tree species from New Caledonia. The data presented are the means of block averages of RMF, SMF and LMF (g g−1), with the minimum and maximum SE shown on the right of the graph for each organ. The left hand column is the shade treatment for each species, and the right hand column is the sun treatment. Roots, blue; stems, yellow; leaves, green. Species codes are given in Table 1. The status of each species with respect to monodominant vs subordinate, and continuous vs episodic regeneration, is shown.

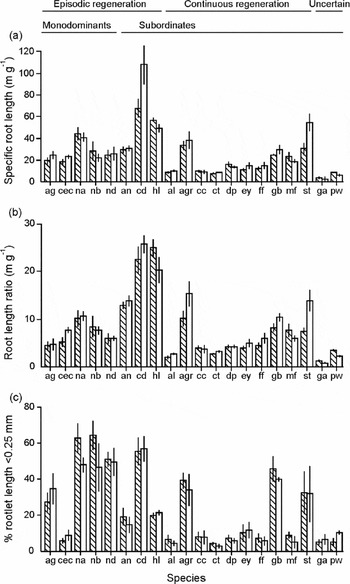
There were substantial differences among species in root profiles. SRL varied 50-fold and RLR varied 32-fold across species and light treatments (Table 2, Figure 2a & b). No difference was recorded between light treatments pooled across species, but effects of light differed among species for both root traits (Table 2). For the root profile, we present only the percentage of terminal rootlet length <0.25 mm diameter (%TRL0.25): there was c. 20-fold variation across species and light treatments, but with no significant effect of light treatments (Table 2, Figure 2c). High SRL values in Codia discolor (Figure 2a) may be due to small seedling size, with little woody root. SRL and RLR were the only traits that correlated significantly with plant size (stem height) across species (in both sun and shade treatments, all log-transformed: R P = 0.46, 0.56; P = 0.04, 0.01 respectively), but not when C. discolor was excluded (P > 0.08). SRL, RLR and %TRL0.25 may have been underestimated in Agathis lanceolata as the finest rootlets appeared brittle and some may have been lost during washing.
Root allocation in 20 rain-forest tree species from New Caledonia. The data presented are the means of block averages with SE of specific root length (a), root length ratio (b), and %TRL0.25, the percentage of terminal rootlet length <0.25 mm diameter (c). The left hand hatched column is the shade treatment for each species, and the right hand open column is the sun treatment. Species codes are given in Table 1. The status of each species with respect to monodominant vs subordinate, and continuous vs episodic regeneration, is shown.

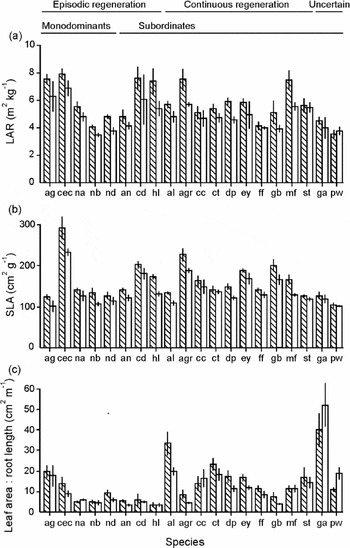
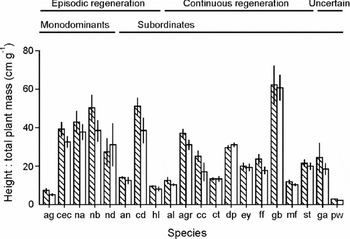
LAR and SLA varied 2–3-fold across species and light treatments (Table 2, Figure 3a & b). Although there was no effect of light treatment on LMF, both LAR and SLA were higher in shade plants (5.8 ± 0.3 m2 kg−1 and 160 ± 10 cm2 g−1 respectively) than sun plants (4.9 ± 0.2 m2 kg−1 and 137 ± 8 cm2 g−1) (Table 2, Figures 3a & b). Leaf area:total root length varied 15-fold across species and treatments, higher in shade plants (13.9 ± 2.1 cm2 m−1) than sun plants (12.4 ± 2.5 cm2 m−1) (Table 2, Figure 3c), i.e. shade plants enhanced potential light interception relative to soil exploration. Stem height:total plant mass was higher in shade plants (26.3 ± 3.7 cm g−1) than sun plants (22.8 ± 3.2 cm g−1) (Table 2, Figure 4).
Leaf allocation in 20 rain-forest tree species from New Caledonia. The data presented are the means of block averages with SE of LAR (a), SLA (b) and leaf area relative to total root length (c). The left-hand hatched column is the shade treatment for each species, and the right hand open column is the sun treatment. Species codes are given in Table 1. The status of each species with respect to monodominant vs subordinate, and continuous vs episodic regeneration, is shown.

Stem height per total plant mass in 20 rain-forest tree species from New Caledonia. The data presented are the means of block averages with SE. The left-hand hatched column is the shade treatment for each species, and the right hand open column is the sun treatment. Species codes are given in Table 1. The status of each species with respect to monodominant vs subordinate, and continuous vs episodic regeneration, is shown.

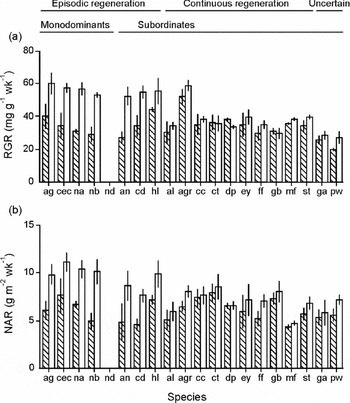
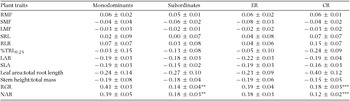
RGR and NAR varied 3-fold across species and treatments, higher in sun plants (43.7 ± 2.6 mg g−1 wk−1 and 7.93 ± 0.39 g m−2 wk−1 respectively) than shade plants (33.9 ± 1.6 mg g−1 wk−1 and 6.03 ± 0.26 g m−2 wk−1), with the magnitude of effect of light treatment varying among species for RGR (Table 2, Figure 5). Plasticity with respect to light treatment, D, varied considerably among traits, ranging from relatively low values in mass fractions to high plasticity in RGR and NAR in monodominant and ER species, and in leaf area:total root length in CR species (Table 3).
Relative growth rate (a) and net assimilation rate (b) in 19 rain-forest tree species from New Caledonia. The data presented are the means of block values with SE (no data available for Nothofagus discoidea). The left-hand hatched column is the shade treatment for each species, and the right hand open column is the sun treatment. Species codes are given in Table 1. The status of each species with respect to monodominant vs subordinate, and continuous vs episodic regeneration, is shown.

Plasticity (D) of growth and biomass allocation traits in seedlings of 17–20 New Caledonian rain-forest tree species grown in sun and shade. D is calculated as (X sun – X shade)/X sun, where X is any of the measured variables, with the data presented as means ± SE. Significant P-values from ANOVA of monodominants vs subordinates and ER vs CR species are shown: **, P < 0.01; ***, P < 0.001. Acronyms are explained in the caption of Table 2.

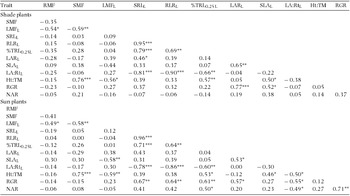
For all biomass allocation traits, values in sun versus shade plants were very highly correlated across all species (P < 10−6), but for RGR and NAR were only weakly correlated (P = 0.027 and 0.033 respectively). Trait correlations within light treatments are given in Appendix 1. LMF was negatively correlated with RMF and SMF in both sun and shade plants (P =0.006–0.028), but RMF was not correlated with SMF. Root length traits were strongly positively intercorrelated in both sun and shade plants (P = <0.001–0.003), and negatively correlated with leaf area : total root length (P = <0.001–0.005). Stem height:total plant mass was positively correlated with SMF (P <0.001) and %TRL0.25 (P = 0.009–0.017), and negatively with LMF (P = 0.007–0.010) in sun and shade plants. NAR and RGR were positively correlated in sun plants (P = 0.001), but not in shade plants (P = 0.122). RGR of sun plants correlated positively with all root length traits (P = 0.002–0.006), and LAR (P = 0.011), and negatively with leaf area : total root length (P = 0.014). RGR of shade plants correlated strongly and positively with LAR (P < 0.001) and weakly with SLA (P = 0.022). NAR in sun plants correlated weakly with %TRL0.25 (positively) and leaf area:total root length (negatively) (P = 0.031–0.032), but was not correlated with any trait in shade plants.
Trait differences between monodominants vs subordinates and CR vs ER species
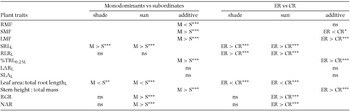
Monodominants had lower RMF than subordinates and low RMF compared with subordinate ER species (Alphitonia neocaledonica, C. discolor and Hibbertia lucens) (Table 4, Figure 1, with mean values given for all traits in Appendix 2). Notably, of the two subordinate species showing a similarly low RMF (Figure 1), A. lanceolata has root nodules and S. trinervis has root clusters. RMF did not differ between ER and CR species (Table 4, Figure 1). SMF was higher in monodominants than subordinates (Table 4), although low in A. gummiferum, and very weakly lower in ER than CR species, notably low in the three ER subordinates (Table 4, Figure 1). LMF was higher in monodominants than subordinates due to high LMF in A. gummiferum; there was no clear difference between LMF of other monodominants and subordinates (Table 4, Figure 1). LMF was higher in ER than CR species (Table 4, Figure 1).
Planned contrasts of growth and biomass allocation traits in seedlings of 17–20 New Caledonian rain-forest tree species: monodominants (M) vs subordinates (S) and episodically (ER) vs continuously regenerating (CR) species. Additive models of light regime and species were used if initial multiplicative models found no evidence of interactions (P > 0.25), with Holm P-value adjustments. L, data log-transformed for analysis. *, P < 0.05; **, P < 0.01; ***, P < 0.001; ns, not significant. Acronyms are explained in Table 2. Means with SE are given in Appendix 2.

The low RMF in monodominants may be explained by efficient mass distribution: SRL was higher in monodominant species, in both sun and shade (log-transformed), with a high %TRL0.25 (Table 4, Figure 2a & c). However, SRL and %TRL0.25 were also high in some subordinate species, such as C. discolor, H. lucens and S. trinervis (Figure 2). Nothofagus spp. had particularly high %TRL0.25, as did the subordinate ER species C. discolor (Figure 2c). Cerberiopsis candelabra was notable among monodominants by its low %TRL0.25 (Figure 2c). RLR did not differ significantly between monodominant and subordinate species, but was higher in ER than CR species, as were SRL and %TRL0.25 (Table 4, Figure 2).
There was no difference in LAR or SLA between monodominants and subordinates, or ER and CR species (Table 4, Figure 3a & b). For the monodominants, LAR was notably high in A. gummiferum and C. candelabra, but not in Nothofagus spp., and SLA was particularly high in C. candelabra (Figure 3a & b). However, leaf area:total root length was lower (Figure 3c), and stem height:total plant mass was higher (Figure 4), in monodominants than subordinates and in ER than CR species (Table 4). In addition, NAR and RGR were higher in sun plants (but not shade plants) of monodominants than subordinates (Table 4), although similarly high values were recorded in some subordinate species (Figure 5). Similarly, NAR and RGR were higher in sun plants of ER than CR species (Table 4). D-RGR and D-NAR were higher in monodominants than subordinates, and in ER than CR species (Table 3). No other significant differences in D were recorded for either contrast.
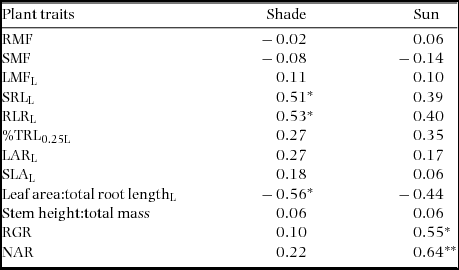
Weibull c correlated positively with SRL and RLR and negatively with leaf area:total root length in shade plants (Table 5). Similar but non-significant trends were recorded in sun plants, but RGR and NAR of sun plants correlated positively with Weibull c (Table 5), as did D-RGR (R P = 0.48, P = 0.042) and D-NAR (R P = 0.47, P = 0.048).
Correlations of seedling biomass allocation and growth rate with Weibull c in 18–19 New Caledonian rain-forest tree species. The data presented are Pearson correlation coefficients (RP) using species’ means (means of block averages), with asterisks indicating the level of significance: *, P < 0.05; **, P < 0.01; ***, P < 0.001. Acronyms are explained in the caption of Table 2. Weibull c was log-transformed for analysis, as were some other traits (L).

Trait syndromes
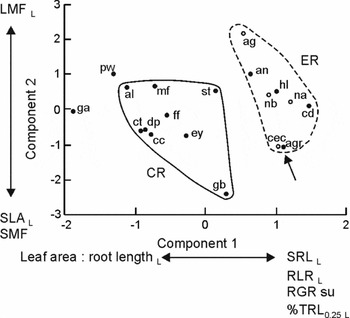
The first two components of PCA explained 56% of the total variance among species, with root diameter (%TRL0.25) and length traits, plus RGR of sun plants, contributing most to the first component (36% of variance explained). LMF, and to a lesser extent SLA, SMF and height:total mass, contributed most to the second component (20% of variance explained) (Figure 6). Three main features were evident in the configuration plot (Figure 6). Overall, monodominant species were not more similar to each other than to other ER species. Second, ER species were generally distinct from CR species, based largely on variation in root length and RGR of sun plants. The exception was Archidendropsis granulosa, a CR species with more trait similarity to ER species. Third, P. wakere and G. austrocaledonica, whose regeneration patterns were uncertain based on field data, were aligned with CR species. Component 1 of the PCA was positively correlated with Weibull c (R P = 0.54, P = 0.020).
PCA configuration plot of biomass allocation and growth rate traits in 19 rain-forest tree species from New Caledonia. Component loadings are shown where ≥ 0.80 on Component 1 and ≥ 0.70 on Component 2. Monodominant species, open circles; subordinate species, filled circles. Groupings are shown for ER and CR species, with an outlier of the latter group (Archidendropsis granulosa) shown by an arrow. The biomass allocation traits used were from sun plants (values were highly correlated with those from shade plants), plus RGR and NAR from both sun and shade plants and D-RGR and D-NAR. L, log-transformed for analysis.

In addition to the trends among growth traits, RGR and NAR correlated strongly with Amax in sun plants on the basis of leaf area (R P = 0.83, 0.68; P = <0.001, 0.001 respectively) and leaf dry mass (R P = 0.69, 0.51; P = 0.001, 0.027 respectively); RGR and NAR did not correlate with Amax in shade plants (P ≥ 0.07).
DISCUSSION
Growth rates of monodominants vs subordinates, ER vs CR species
These monodominants are secondary (ER) species, dominating after large-scale disturbances. Hence, they were predicted to have high growth rates in sunny environments, such as are likely after a large-scale disturbance. This was confirmed, with higher RGR and NAR than subordinate species in the sun treatment. However, ER species in general had high RGR and NAR compared with CR species in the sun treatment, with similarly high RGR and NAR in monodominants as in other ER species. Hence, high RGR and NAR may be necessary traits for these monodominants, but do not explain their dominance compared with other ER species, at least under these experimental growth conditions, and at this ontogenetic stage. The predicted slower growth of monodominants in shaded than sunny conditions was also demonstrated, with no significant difference in RGR or NAR between monodominant and subordinate species in the shade treatment. The same trend was seen in ER vs CR species, and consistent with species’ regeneration responses to light occurring along a continuum, RGR and NAR in sun plants correlated positively with Weibull c. Plasticity in RGR and NAR also correlated positively with regeneration/shade-tolerance (Weibull c), a similar trend to that reported elsewhere (Agyeman et al. Reference AGYEMAN, SWAINE and THOMPSON1999, Osunkoya et al. Reference OSUNKOYA, ASH, HOPKINS and GRAHAM1994).
The components of RGR (NAR and LAR) that best explain interspecific variation in RGR across all species varied according to light treatment, as found in studies elsewhere (Bloor & Grubb Reference BLOOR and GRUBB2003, Osunkoya et al. Reference OSUNKOYA, ASH, HOPKINS and GRAHAM1994, Poorter Reference POORTER1999). Consistent with some previous reports of rain-forest seedlings (Poorter Reference POORTER1999, Veneklaas & Poorter Reference VENEKLAAS, POORTER, Lambers, Poorter and van Vuren1998), NAR best explained interspecific variation in RGR in the sun treatment (Poorter: >10–15% daylight), whereas LAR contributed most strongly to RGR in the shade treatment. As found elsewhere (Kitajima Reference KITAJIMA1994), RGR correlated positively with Amax, but only in the sun treatment.
Biomass allocation traits of monodominants vs subordinates, ER vs CR species
There were a few notable differences between monodominants and subordinates, but traits generally varied considerably within both groups. For example, Nothofagus spp. had relatively similar traits, but the other monodominants, C. candelabra and A. gummiferum, often differed, as summarized in the PCA. This suggests that dominance can be achieved by differing suites of traits, probably in concert with different combinations of biochemistry, physiology and mycorrhizal associations.
Nevertheless, there were also some clear patterns. In particular, monodominants had a low RMF, on average combined with high SRL and percentage of very fine rootlets. However, while Nothofagus spp. had a very high percentage of very fine rootlets, C. candelabra did not, and some subordinate species also had high values, especially C. discolor. Since organs may have multiple functions, and allocation patterns show some plasticity, interpreting relationships between biomass allocation patterns and function is not necessarily straightforward (Weiner Reference WEINER2004). However, in the context of the low fertility of ultramafic soils, these species were potentially allocating root biomass very efficiently for uptake of soil nutrients and water. SRL and fine roots have been linked to rapid resource acquisition (Comas et al. Reference COMAS, BOUMA and EISSENSTAT2002), suggested to form part of a single root trait spectrum representing the trade-off between nutrient conservation (high RMF and thicker or denser roots) and acquisition (high uptake rates and SRL) (Larson & Funk Reference LARSON and FUNK2016, Roumet et al. Reference ROUMET, URCELAY and DÍAZ2006). Recent work, however, suggests a multidimensional root trait spectrum, with root tissue density, but not SRL, aligning with the plant economic spectrum (Kramer-Walter et al. Reference KRAMER-WALTER, BELLINGHAM, MILLAR, SMISSEN, RICHARDSON and LAUGHLIN2016). Nevertheless, SRL and fine root length have been shown to decline across successional phases in some tropical systems (Zangaro et al. Reference ZANGARO, ALVES, LESCANO and ANSANELO2012). High SRL may allow rapid uptake of water, and enhance exploitation of pulses of soil nutrients and water (Eissenstat Reference EISSENSTAT1991) and is commonly, but not always, associated with rapid growth, its effect possibly being context-dependent (Larson & Funk Reference LARSON and FUNK2016). For example, in our study, root length traits, including SRL, correlated positively with RGR in sun-grown plants but not shade-grown plants. In addition, the lower RMF and consequently high shoot mass fraction must contribute to high growth rates in monodominants by maximizing foliar access to light through height growth and/or leaf display. A potential cost of fine roots is shorter lifespans and higher turnover-rates (Eissenstat Reference EISSENSTAT1991), and thicker or denser roots may provide valuable protection against desiccation and pests as part of a conservative strategy in resource-limited environments (Comas et al. Reference COMAS, BOUMA and EISSENSTAT2002, Roumet et al. Reference ROUMET, URCELAY and DÍAZ2006).
Monodominants, except A. gummiferum, had relatively high SMF and stem height:total plant mass, potentially enhancing height growth for light interception. There was little or no significant difference between monodominants and subordinates in leaf allocation traits, and considerable variation among monodominant species. Cerberiopsis candelabra had particularly high SLA, and both A. gummiferum and C. candelabra had a high LAR, the former due to high LMF, and the latter to its high SLA. However, SLA and LAR (and RGR) was not higher on average in shade-intolerant (ER) species than shade-tolerant (CR) species in shade conditions, in contrast to the study of tropical seedlings by Kitajima (Reference KITAJIMA1994). The lower leaf area:root length in monodominant than subordinate species, and in ER than CR species, may reflect greater limitations of soil water and nutrients relative to light in the regeneration environments of shade-intolerant vs shade-tolerant species.
Notably, the subordinate species that commonly differed most from the monodominant species across all traits were known shade-tolerant (CR) species (Read et al. Reference READ, MCCOY and JAFFRÉ2015), such as C. caledonicum, C. transversa and D. parviflora. Known shade-intolerant species, such as A. neocaledonica, C. discolor and H. lucens (Read et al. Reference READ, MCCOY and JAFFRÉ2015) often had similar trait values to those of the monodominant species. However, these are generalist species that also occur in maquis (shrub-dominated vegetation), so may be less comparable to the monodominants that are predominantly forest species. For example, their higher RMF (contributing to high RLR) and low SMF and height:total plant mass may be better suited to a shrubland environment on sites where nutrient deficits may be more severe, and water more limiting during the dry season than in relatively closed forest (Jaffré Reference JAFFRÉ1980). However, the monodominant A. gummiferum shared some of these traits. Excluding the ER generalists, the monodominants tend to have higher SRL and fine rootlet fraction than subordinates, except C. candelabra for the latter. Notably, S. trinervis had high root mass efficiency via its root clusters (Lamont Reference LAMONT2003), and A. lanceolata from mycorrhizal (presumed) root nodules (cf. Morrison & English Reference MORRISON and ENGLISH1967).
What seedling traits are associated with forest dominance and regeneration patterns?
We previously showed for the same plants (Read et al. Reference READ, MCCOY and JAFFRÉ2015) that ER species, including monodominants, had leaf-level photosynthesis traits typical of shade intolerance, with higher Amax (on a leaf area basis) in sun plants than CR species, and high plasticity. However, these traits did not differ between monodominants and other ER species. CR species had leaf-level photosynthesis traits consistent with shade tolerance, including lower dark respiration rates than ER species in shade plants (Read et al. Reference READ, MCCOY and JAFFRÉ2015). The trends in RGR and NAR in the current study are consistent with the leaf-level photosynthesis traits of the same plants. Hence, while assimilation and growth rate traits are largely consistent with regeneration patterns across species, they do not explain why some shade-intolerant species achieve monodominance and others do not.
The lack of evidence for superior growth rates in monodominants compared with other ER species in the sun treatment may be due in part to an insufficiently high light regime (c. 30% incident irradiance), such that, at least on some cloudy days, photosynthetic rates (and so potentially growth) were light-limited. However, it is not certain that seedlings of monodominants have higher light demands than those of other ER species (Read et al. Reference READ, MCCOY and JAFFRÉ2015). Ontogenetic changes in biomass partitioning influence whole-plant responses to understorey light conditions (Givnish Reference GIVNISH1988, Lusk et al. Reference LUSK, FALSTER, JARA-VERGARA, JIMENEZ-CASTILLO and SALDAÑA-MENDOZA2008, Veneklaas & Poorter Reference VENEKLAAS, POORTER, Lambers, Poorter and van Vuren1998), with the possibility that differences in growth rates among ER species become apparent in older juveniles. It is also possible that other aspects of the growth regime, including soil nutrient levels, mycorrhizal inoculation and humidity, affected biomass allocation patterns and growth differentially in monodominants relative to other ER species (Béreau et al. Reference BÉREAU, BONAL, LOUISANNA and GARBAYE2005, Weiner Reference WEINER2004). This might occur if the experimental growth environment was suboptimal for the monodominants, or alternatively, if the growth environment did not display suboptimal features that might confer an advantage to the monodominants, either abiotic or biotic, including herbivory (Sack & Grubb Reference SACK and GRUBB2001, Reference SACK and GRUBB2003). In particular, Corrales et al. (Reference CORRALES, MANGAN, TURNER and DALLING2016) suggested that the ectomycorrhizal (EM) symbiosis may provide a competitive advantage to seedlings of EM monodominants (e.g. Nothofagus spp., A. gummiferum) by competition of EM fungi with soil microbes for nitrogen, thereby slowing litter decomposition and reducing availability of inorganic nitrogen. Multiple co-occurring stresses may influence field performance (Sack & Grubb Reference SACK and GRUBB2003, Valladares & Niinemets Reference VALLADARES and NIINEMETS2008). Indeed, monodominance may be achieved through superior survival of stresses associated with exposed post-disturbance conditions, such as drought, either directly (drought resistance) or indirectly via effects on growth rate. It is also possible that reproductive traits such as mast seeding (common to these monodominant species) play a key role in achieving monodominance, especially if linked to climate events that promote canopy disturbances (Read et al. Reference READ, SANSON, BURD and JAFFRÉ2008). Hence, field studies should provide important complementary insights to those gained from nursery-house studies (Sack & Grubb Reference SACK and GRUBB2003).
The slower growth of monodominants (and other ER species) in the shade treatment may explain, at least in part, the predicted or actual temporal decline in dominance shown by monodominants in undisturbed stands: if growth rates of monodominants in shade do not differ from those of subordinate species they are less likely to achieve a competitive advantage, particularly taking into account effects of stochastic factors such as time of establishment. RGR and NAR of ER species were substantially lower in the shade treatment than the sun treatment, but this was not the case in CR species. Therefore, it is possible that in more severe shade, RGR and NAR of monodominant (and other ER) species would decline below values recorded in CR species. Our shade treatment (c. 10% incident irradiance) was not as severe as found in the undisturbed understorey (and was less heterogeneous, e.g. sunflecks, and probably differed spectrally) (Bloor Reference BLOOR2003, Sack & Grubb Reference SACK and GRUBB2001, Watling et al. Reference WATLING, BALL and WOODROW1997). Such rank reversals in RGR frequently occur between 2% and 10% daylight irradiance in seedlings and saplings (Agyeman et al. Reference AGYEMAN, SWAINE and THOMPSON1999, Sack & Grubb Reference SACK and GRUBB2001, Reference SACK and GRUBB2003). In addition, superior growth rates in CR species may develop in older seedlings due to ontogenetic changes (Lusk et al. Reference LUSK, FALSTER, JARA-VERGARA, JIMENEZ-CASTILLO and SALDAÑA-MENDOZA2008, Niinemets Reference NIINEMETS2006, Sack & Grubb Reference SACK and GRUBB2001).
However, although there is evidence that growth rates contribute to shade-tolerance (Baltzer & Thomas Reference BALTZER and THOMAS2007, Sack & Grubb Reference SACK and GRUBB2001), the predicted higher RGR of tolerant than intolerant species has not always been recorded in shade-grown seedlings (Kitajima Reference KITAJIMA1994, Valladares & Niinemets Reference VALLADARES and NIINEMETS2008, Walters & Reich Reference WALTERS and REICH1999). Seedling tolerance of shade may be strongly influenced by other traits that influence mortality directly or via effects on net growth (where net growth include losses to all causes: Walters & Reich Reference WALTERS and REICH1999) and thereby competitiveness. These traits include large seeds with reserves that may buffer against a range of stresses in the forest understorey (Grubb & Metcalfe Reference GRUBB and METCALFE1996, Osunkoya et al. Reference OSUNKOYA, ASH, HOPKINS and GRAHAM1994, Walters & Reich Reference WALTERS and REICH2000), tolerance or resistance to pathogens and herbivores (Augspurger Reference AUGSPURGER1984, Kitajima Reference KITAJIMA1994, Kitajima et al. Reference KITAJIMA, CORDERO and WRIGHT2013, McCarthy-Neumann & Kobe Reference MCCARTHY-NEUMANN and KOBE2008), carbon storage (Canham et al. Reference CANHAM, KOBE, LATTY and CHAZDON1999, Kobe Reference KOBE1997, Myers & Kitajima Reference MYERS and KITAJIMA2007) and longer leaf lifespans that reduce costs of canopy maintenance (Lusk et al. Reference LUSK, PÉREZ-MILLAQUEO, PIPER and SALDAÑA2011).
Perhaps most important in drawing conclusions from our results is that seedlings in this study were grown independently, without interactions among species. If grown in limited space where species competed for light, nutrients and water, stronger patterns might emerge. In particular, in sunny conditions, monodominant species might preempt soil nutrients by effective root architecture and/or nutrient uptake physiology (including mycorrhizal benefits), leading to enhanced above-ground productivity and competitive success. This scenario may be important in any forest system, but probably more so on these ultramafic soils where levels of P, K and Ca are particularly low (Jaffré & Veillon Reference JAFFRÉ and VEILLON1990, Perrier et al. Reference PERRIER, AMIR and COLIN2006, Read et al. Reference READ, JAFFRÉ, FERRIS, MCCOY and HOPE2006). For example, higher P uptake rates have been associated with finer roots (Comas et al. Reference COMAS, BOUMA and EISSENSTAT2002), and furthermore, species with high densities of fine roots can impede establishment by seedlings of some competing species (Zangaro et al. Reference ZANGARO, LESCANO, MATSUURA, RONDINA and NOGUEIRA2016). In addition, Nothofagus spp. and A. gummiferum have ectomycorrhizal relationships (Demenois et al. in press, Perrier et al. Reference PERRIER, AMIR and COLIN2006), with hyphal networks potentially enhancing sharing of mineral nutrients and carbon among plants (Finlay & Read Reference FINLAY and READ1986a, b; McGuire Reference MCGUIRE2007b). Such networks might allow crucial transfer of carbon from adults to juveniles, extending the duration of a seedling bank in the forest understorey until disturbance facilitates recruitment (Demenois et al. in press, Newbery et al. Reference NEWBERY, PRAZ, VAN DER BURGT, NORGHAUER and CHUYONG2010). A similar mechanism may enhance seedling establishment following a major disturbance if networks survive, e.g. after a cyclone. It is likely that below-ground interactions contribute significantly to the structure and diversity of these forest communities (Steidinger et al. Reference STEIDINGER, TURNER, CORRALES and DALLING2015, Valverde-Barrantes et al. Reference VALVERDE-BARRANTES, SMEMO, FEINSTEIN, KERSHNER and BLACKWOOD2013).
CONCLUSIONS
High growth rates in sunlit conditions, such as occur after a large disturbance, are likely to contribute substantially to the capacity for monodominance in Nothofagus spp., A. gummiferum and C. candelabra in these species-rich forests, and efficient root allocation probably plays an important role in achieving high RGR. However, RGR in monodominant species was not higher than in other ER species under these experimental conditions, so may not alone explain dominance. It is not clear whether the growth conditions used were not sufficient to allow superior growth rates in monodominants, or whether superiority would be apparent at a later ontogenetic stage, or when grown in competition. But it is also possible that some aspect of tolerance of exposed conditions other than irradiance may play a key role in achieving post-disturbance dominance by monodominant species, either by promoting higher rates of survival directly, or indirectly by effects on growth rates. It is also possible that other traits, such as mast seeding, play a key role in facilitating dominance. Field studies of establishment, growth and survival should provide further insights into these issues.
ACKNOWLEDGEMENTS
We are grateful to Vale New Caledonia for allowing this experiment to be conducted at their Environmental Conservation Service nursery facility, and thank their staff for invaluable assistance in preparing and maintaining the seedling experiment. We thank L. L'Huillier for supplying Arillastrum gummiferum seed, A. Warren for technical assistance, and the Committee for Research and Exploration of the National Geographic Society for supporting this study as part of a larger project (Grant #8798-10).
Associations across biomass allocation and growth rate traits, separately for sun and shade plants, in seedlings of 19–20 New Caledonian rain-forest tree species. Data presented are Pearson correlation coefficients (RP) based on species’ means (means of block averages), n = 20 for all traits except RGR and NAR (n = 19). *, P < 0.05; **, P < 0.01; ***, P < 0.001. RMF, root mass fraction; SMF, stem mass fraction; LMF, leaf mass fraction; SRL, specific root length; RLR, root length ratio; %TRL0.25, % terminal rootlet length <0.25 mm diameter; LAR, leaf area ratio; SLA, specific leaf area; LA: Rt, leaf area:total root length; Ht:TM, plant height:total plant mass; RGR, relative growth rate; NAR, net assimilation rate. L, log-transformed for analysis.

Means ± SE of growth and biomass allocation traits in seedlings of 17–20 New Caledonian rain-forest tree species: monodominants vs subordinates and episodically (ER) vs continuously regenerating (CR) species. Acronyms are explained in the caption of Appendix 1.