Introduction
Over ten years have passed since Hurricane Katrina (2005; Gulf Coast, USA), but the question remains: “Have we made progress in nursing home disaster preparedness?” Disasters often overwhelm a community’s capacity to respond and recover, creating a gap between the needs of the community and the resources available to provide services. Disasters often disrupt utility, transportation, and health care services, as well as food and water sources, and even physical structures. While man-made disasters such as chemical plant explosions and structural fires tend to be of a smaller scale, their impact can be just as devastating. However, it’s usually natural disasters such as hurricanes, tornados, floods, blizzards, and wildfires that highlight the importance for health care facilities to have and execute comprehensive emergency preparedness plans. Hurricanes Rita (2005; Gulf Coast, USA), Katrina, and Sandy (2012; East Coast, USA), for example, impacted entire regions by destroying buildings, utilities, health care services, and crippling local transportation services. In addition to infrastructure damage requiring evacuation, combined fatalities of hurricanes Rita and Katrina included 103 nursing home residents.Reference Lane and McGrady 1 In 2011, an Enhanced Fujita-5 (EF5) Tornado struck Joplin, Missouri (USA) tearing the roof off of a nursing home and killing 19 residents.Reference Brunkard, Namulanda and Ratard 2 Flooding forced the evacuation of nursing homes in North Dakota (USA) and Minnesota (USA) in 2009, as well as Mississippi (USA) in 2010.Reference Dolan 3
In the wake of multiple disasters affecting nursing homes in the last decade, increased focus has shifted to this vital component of the health care system. While emergency management agencies and hospitals have emphasized collaboration in disaster response, the long-term care sector often falls through the cracks in both planning and response. For example, owners of St. Rita’s Nursing Home outside New Orleans (Louisiana, USA) maintained in court testimony that they never were notified to evacuate prior to Hurricane Katrina’s landfall. 4 Similarly, the Caldwell Hospice and Palliative Care facility (Caldwell County, North Carolina USA) never was notified formally to evacuate by emergency management, though they resided within the 2-mile evacuation zone of a chemical plant explosion.Reference Cobb 5 Successful emergency response depends on a health care facility’s comprehensive emergency preparedness plan and their ability to execute it successfully in the context of overall community response. In its report to the President following hurricane Katrina, the Department of Homeland Security (Washington, DC USA) found, “effective incident management of catastrophic events requires coordination of a wide range of organizations and activities, public and private.”Reference McGrady, Blanke and Swanson 6
The literature is replete with studies describing the impact of disasters on nursing home residents, staff, and families. Many describe the hardships faced both during and after the disaster. Challenges and hardships reported include: inadequate supplies of food and water, 7 - Reference Silverman and Weston 9 inadequate amounts and types of medication, 7 inadequate numbers of staff and staff subsequent emotional and physical exhaustion, 7 - Reference Christensen, Brown and Hyer 13 inadequate communication,Reference Saliba, Buchanan and Kington 10 - Reference Christensen, Brown and Hyer 13 loss of power and inadequate or unavailable transportation, 7 , Reference Laditka, Laditka, Cornman, Davis and Richter 11 , Reference Christensen, Brown and Hyer 13 financial loss,Reference Blanchard and Dosa 14 physical and psychological harm of residents,Reference Christensen, Brown and Hyer 13 , Reference Castro, Persson, Bergstrom and Cron 15 - Reference Dosa, Hyer and Thomas 18 and premature hospitalization and death.Reference Castro, Persson, Bergstrom and Cron 15 - Reference Brown, Dosa and Thomas 17 Fewer studies have assessed nursing home emergency preparedness plans.Reference Castle and Engberg 19 , Reference Eiring, Blake and Howard 20 Eiring and colleagues surveyed nursing homes in Georgia (USA), California (USA), and Florida (USA) and reported the following disaster preparedness processes needing improvement: contact with government officials (ie, local/state emergency operations center, emergency management office, and/or police department), contracts for emergency transportation, ability to shelter-in-place for only two days, and evacuation site plans.Reference Castle and Engberg 19 Castle reported in a review of nursing home evacuation plans that 86% of the facilities had conducted a hazard analysis, 96% had a water supply plan, and 92% had a detailed evacuation plan. Yet, only 37% had specified procedures to meet individual resident needs, and only 31% had an evacuation route.Reference Eiring, Blake and Howard 20
Two recent reports on nursing home emergency preparedness published by the US Department of Health and Human Services (DHHS; Washington, DC USA) elucidate the need for nursing homes to have comprehensive emergency preparedness and response plans, and also to provide training so staff can execute those plans properly.Reference Dolan 3 , Reference Castle 21 The first report (2006) indicated: (1) that emergency preparedness plans lacked information, (2) staff did not always follow plans during disasters, and (3) there was a lack of collaboration between nursing homes and emergency officials which impeded emergency preparedness and management.Reference Castle 21 In response to these findings, the Centers for Medicare & Medicaid Services (CMS; Baltimore, Maryland USA) issued an emergency preparedness checklist of tasks deemed a “recommended tool for effective health care facility planning.” The checklist provided guidance for facilities to develop an emergency plan, to establish the communication infrastructure and essential collaborative relationships, to determine decision criteria for executing the plan, and to create plans to shelter-in-place and evacuate. 22
In 2012, the DHHS Office of Inspector General (OIG) published the follow-up study (2010 data) that assessed the emergency preparedness and response of nursing homes three years after the guidance checklist was issued in 2007.Reference Dolan 3 The 2012 report found many facilities’ emergency preparedness plans contained only approximately one-half of the items noted on the CMS-recommended checklist, and that many of the missing tasks could adversely affect residents during disasters. The tasks not included in the plans were categorized as: plans related to staffing (ie, where staff and families would shelter); guidelines related to resident care (ie, specific characteristics and needs of residents); plans for identifying residents during evacuation (ie, method to account for individuals); plans for sheltering-in-place (ie, adequate supply of food and water); plans for evacuation (ie, transportation and protection of medical records); and plans to communicate and notify staff, residents, and families. In addition, many administrators indicated they had substantial challenges during disasters, such as following their emergency plans as written, logistical issues with communication and transportation, and maintaining resident health.Reference Dolan 3
With persistent gaps in disaster preparedness, efforts to close the gap and improve nursing home preparedness became a focus for nursing home administrators, state health care associations, as well as many local, state, and national regulators and legislators. In 2013, CMS published the proposed rule on emergency preparedness requirements for Medicare and Medicaid participating providers and suppliers, and most recently adopted the preparedness checklist as policy for all health care facilities in a February 28, 2014 letter to State Agencies. 23
The purpose of this study was to evaluate the persistent gaps remaining in nursing home preparedness in the years since the CMS standards were initially promulgated in 2007 and the 2012 OIG report was issued. The study specifically focused on the lack of initiation of the 70 tasks noted on the checklist. The objectives were to: (1) determine the lack of initiation of the 70 checklist tasks for nursing homes in North and South Carolina (USA), and (2) compare these findings with the 2012 OIG’s report on nursing home preparedness to identify current gaps in preparedness.
Methods
Survey and Participants
Approval for this study was granted by the Institution Review Board of Appalachian State University (Boone, North Carolina USA). The survey items used in the study instrument were based on the CMS “Emergency Preparedness Checklist Recommended Tool for Effective Health Care Facility Planning,” which identified 70 tasks. 22 The survey mirrored the items in the OIG’s report “Gaps continue to exist in nursing home emergency preparedness and response during disasters: 2007-2010,”Reference Dolan 3 and was organized using the three major areas used in the checklist of tasks: overall planning, sheltering-in-place, and evacuation. Also, unstructured, open-ended questions were asked regarding experience with disasters and lessons learned. Task item responses in the survey used a 5-point Likert scale, with one indicating “not initiated,” two indicating “partial completion,” three indicating “half completion,” four indicating “substantial completion,” and five indicating “completed.” The comparison study (from the OIG) used a 3-point scale of “match,” “partial match,” and “non-match” to measure completion of tasks referenced in the facility’s plan.
The survey draft was then sent to five experts to pretest for readability, usability, and content validity; 24 there were few structural suggestions, however, two of the reviewers were concerned about the length of the survey. Considering that the current study was meant to mirror the OIG study, it was decided that comprehensive data would be gathered, rather than partial data. Also, these comprehensive data were best attained in one survey, rather than three shorter surveys administered over time. North Carolina nursing homes were surveyed electronically using SurveyGizmo (Boulder, Colorado USA) from February of 2014 through August of 2014. SurveyGizmo ensures anonymity of respondents by not collecting IP addresses and administering surveys through https encryption. Responses from North Carolina facilities were collected by SurveyGizmo and viewed in aggregate. South Carolina nursing homes were surveyed electronically using the Institutional Research version of SelectSurvey (Kansas City, Missouri USA) during October and November of 2014. This software also provided thorough anonymity of survey respondents by removing their IP addresses from the response data. The Institutional Research version of SelectSurvey also did not record or store any identifiable data beyond the participants’ responses. Responses from South Carolina facilities were collected by SelectSurvey and added to the original data, also being viewed in aggregate.
Nursing homes, by definition, “...provide care for persons who have remedial ailments or other ailments, for which medical and nursing care are indicated....”Reference Gay and Airasian 25 This study defined a “nursing home” as a nursing home licensed and certified by the North Carolina DHHS, Nursing Home Licensure & Certification Section, Division of Health Service Regulation (Raleigh, North Carolina USA) and the South Carolina Department of Health and Environmental Control (Columbia, South Carolina USA) in 2014. Email addresses for North Carolina nursing homes were obtained from the North Carolina DHHS, Nursing Home Licensure & Certification Section, Division of Health Service Regulation. Emails were sent to North Carolina nursing home administrators in the spring of 2014 explaining the study and requesting their participation by completing an electronic survey. Email addresses for South Carolina nursing homes were obtained from the South Carolina Department of Health and Environmental Control web site. Emails containing the same verbiage were sent to South Carolina nursing home administrators in the fall of 2014. The body of the email contained an explanation of the study, the type of information being requested, timeframe for study completion, statement of anonymity of their responses, and contact information for the principle investigators. The email also noted that participation was voluntary and that they may stop participating at any time. A follow-up email was sent two weeks after the initial email to encourage additional participation.
There were challenges in obtaining a high response rate. Six hundred and eleven surveys were emailed, but 117 (19%) email addresses were invalid, whereby the emails were returned or noted in the survey program as “bounced-back.” The anonymity of the survey and the size of the participant pool did not permit follow-up phone calls to every nursing home. However, the facilities for which the “bounced-back” emails were received, a call was placed to each nursing home or the corporate office for multi-facility organizations and a correct email address for all but 21 facilities was obtained, leaving the true sample size at 590. In addition to phone calls to obtain correct email addresses, phone calls were also made to a random list of North Carolina nursing homes in June and July, and to a random list of South Carolina nursing homes in October and November 2014, to encourage participation.
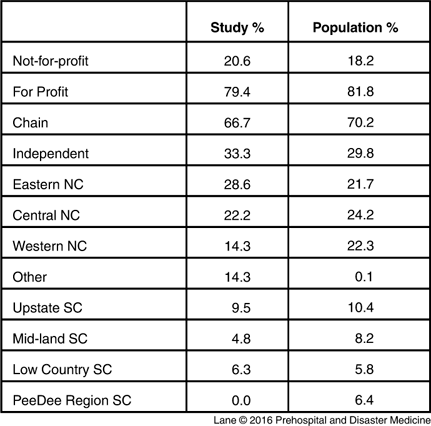
Of that sample, 95 surveys were received; 91 of the returned surveys completed the first demographic section but only 63 completed all of the survey questions. In comparing the demographics of the facilities, it appeared there was no significant difference in which facilities started the survey and which facilities finished the survey. To determine whether the sample was valid and without a non-response error bias, key demographics of North Carolina nursing homes were compared with the study North Carolina nursing homes. A chi square analysis was conducted to test the difference between observed and expected values on three characteristics available: geographic region (Eastern, Central, or Western), ownership status (nonprofit versus for profit), and ownership type (chain versus independent). The study and population groups were slightly different in region (x 2=8.228), at the .05 level (x 2=9.210) but not at the .01 (x 2=5.991) level. A slight overrepresentation was observed in the Eastern Region and underrepresentation in the Western Region, which can be explained by the increased awareness of disaster preparedness created by coastal hurricanes which impact this region. In testing for ownership status (x 2=1.00), the two groups were not significantly different at either the .05 (x 2=3.841) or .01 (x 2=6.635) levels. In testing for ownership type (x 2=0.430), the two groups were not significantly different at either the .05 (x 2=3.841) or .01 (x 2=6.635) levels. The final valid participants included a representation of all the subgroups targeted (Table 1).
Study Facility Demographics Compared to NC/SC Nursing Home Population

Abbreviations: NC, North Carolina (USA); SC, South Carolina (USA).
Data for the comparison group were obtained from the report issued by the DHHS OIG.Reference Dolan 3 This report compared emergency plans for 24 selected Medicare- and Medicaid-certified nursing homes. The 24 nursing homes were located in 16 communities in 13 counties in seven states. Four of the nursing homes were located in North Carolina, the remaining 20 were located in California, Louisiana, Minnesota, North Dakota, Tennessee (USA), and Texas (USA).
Analysis
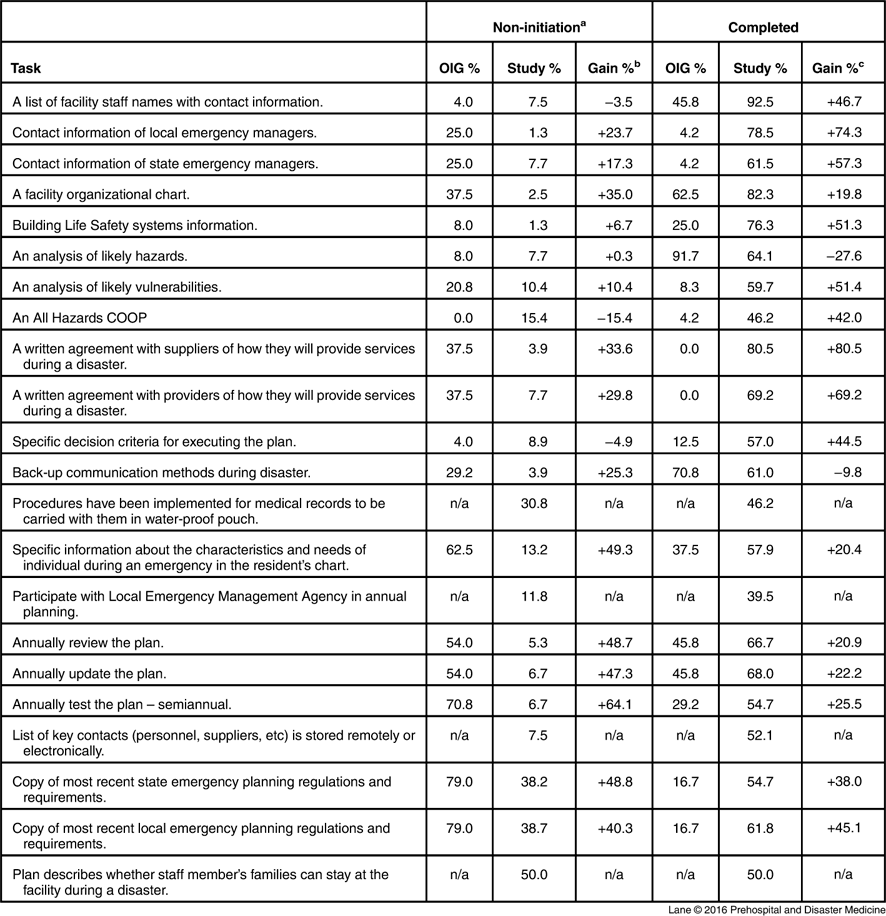
To measure current preparedness gaps, the analysis was focused on comparing non-initiated tasks of the OIG study group to this study group. For the purposes of this report, non-initiation is used in the comparison of those responses “not initiated” in the current study and “non-match” in the OIG study. Responses were analyzed using descriptive statistics with SPSS 20.0 (IBM SPSS Statistics for Windows, Version 20.0; Armonk, New York USA). The most conservative method for comparison of the 5-point scale of this study group to the 3-point scale of the OIG group was to determine the percentage of participants that responded “not initiated” (1) in the study group and “non-match” in the OIG group. The following decision rules were used to categorize tasks between this study and OIG groups: item tasks with percent point changes between this study group and the OIG group of 10% or less were considered slightly changed; those item tasks with changes of 11%-24% and higher were considered moderately changed; and those item tasks with 25% and greater were considered significantly changed. Tasks for each group with “not initiated” or “non-match” percentages of 10% or less were considered to be compliant overall and therefore not of major emphasis. Items in the study group with a “not initiated” percentage score above 10% were considered to need particular focus. Comparisons between this study group and the OIG group of tasks “not initiated” or “non-matched” were organized and reported using the three major categories used in the OIG report task checklist: overall planning (Table 2); sheltering-in-place (Table 3); and evacuation (Table 4). Decreases in non-initiation between the two groups were noted as positive (+) gains and increases in non-initiation were noted as negative gains (−).
Non-initiation and Completed % of Overall Planning Tasks Comparison Between OIG and Study Groups

Abbreviations: COOP, Continuity of Operations Plan; OIG, Office of the Inspector General Study.
a Non-initiation=tasks not started.
b Non-initiation gain=increase (+) or decrease (−) in tasks at least started, desired outcome is to increase (+) tasks at least started.
c Completed gain=increase (+) or decrease (−) in tasks finished, desired outcome is to gain (+) in completed tasks.
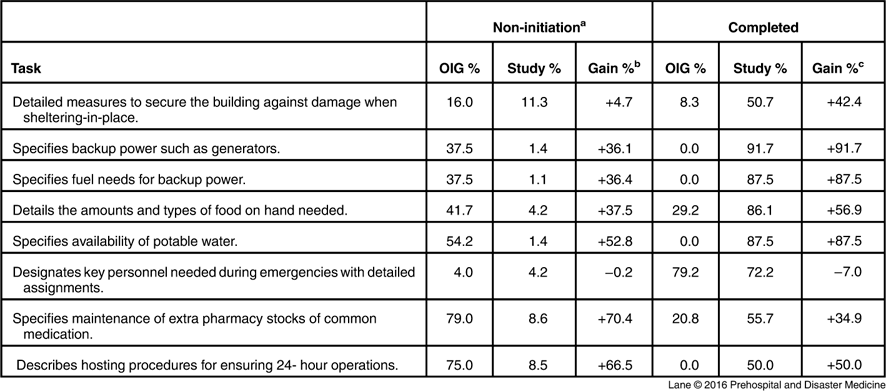
Non-initiation and Completed % of Shelter-in-place Tasks Comparison Between OIG and Study Groups

Abbreviation: OIG, Office of the Inspector General Study.
a Non-initiation=tasks not started.
b Non-initiation gain=increase (+) or decrease (−) in tasks at least started, desired outcome is to increase (+) tasks at least started.
c Completed gain=increase (+) or decrease (−) in tasks finished, desired outcome is to gain (+) in completed tasks.
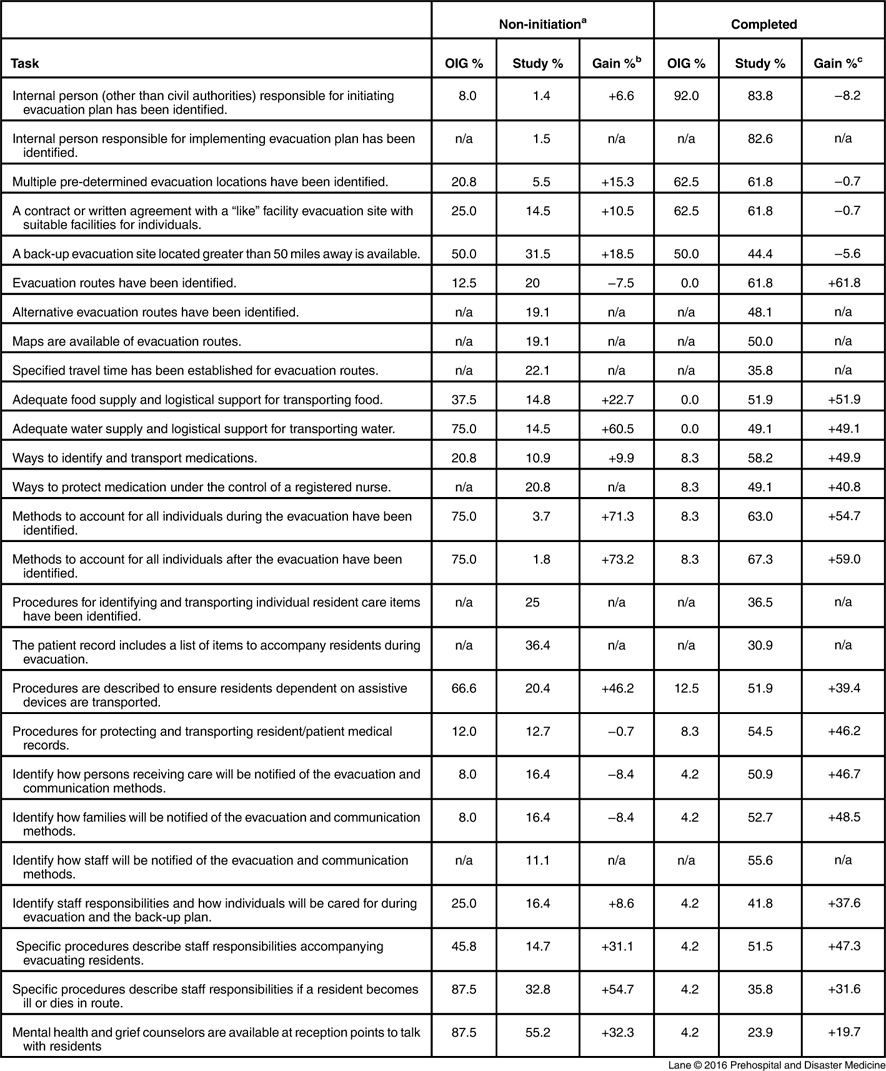
Non-initiation and Completed % of Evacuation Tasks Comparison Between OIG and Study Groups

Abbreviation: OIG, Office of the Inspector General Study.
a Non-initiation=tasks not started.
b Non-initiation gain=increase (+) or decrease (−) in tasks at least started, desired outcome is to increase (+) tasks at least started.
c Completed gain=increase (+) or decrease (−) in tasks finished, desired outcome is to gain (+) in completed tasks.
In addition, data on completed tasks are provided in Table 2, Table 3, and Table 4; but since this was not the focus of the study, no analysis of these data was completed. The method for comparison of completed tasks of the 5-point scale of this study group to the 3-point scale of the OIG group was to determine the percentage of participants that responded “completed” (5) in the study group and “match” in the OIG group. Increases in completion between the two groups were noted as positive (+) gains and decreases in completion were noted as negative (−) gains.
Results
Overall Planning
Facilities in both groups were compliant (10% or less “not initiated”) in performing the following overall planning tasks: listing and contact information of personnel, building life and safety codes, likely hazard analysis, and plan execution decision criteria. Significant progress (decrease of “not initiated” of 25% and over) had been made in the following: including an organizational chart (35.0%); establishing written agreements with both suppliers (33.6%) and providers (29.8%); having back-up communication (25.3%); characteristics and emergency needs of individual residents documented in charts (49.3%); carrying out timely reviews (48.7%), updates (47.3%), and testing of plans (64.1%); and having copies of recent state (48.8%) and local (40.3%) emergency regulations and requirements on-hand (though there are still many non-compliant facilities; Table 2). There was moderate progress (11%-24% change) in maintaining contact information for local and state emergency managers, and analysis of likely vulnerabilities. Though no facilities were found in the OIG group to not have an All-Hazards Continuity of Operations Plan (COOP), 15.0% of the study group reported they did not. Several tasks were included in the final checklist that were not studied in OIG group but were measured in this study. Only 7.5% of the nursing homes had not arranged for remote storage of the key contact list, and nearly one-third had not ensured that residents’ medical records would be carried in a waterproof pouch (30.8%). In addition, 11.8% had “not initiated” participation with local emergency management in annual disaster preparedness planning, and only 50.0% reported they had developed plans for staff family members to stay at the facility during the disaster.
In summary, planning tasks with a “not initiated” score greater than 10% in this study included: conducting an analysis of likely vulnerabilities (10.4%); having an All-Hazards COOP (15.4%); transporting records in waterproof pouches with the resident (30.8%); meeting specific needs for individuals noted in the chart (13.2%); and planning annually with a local emergency management agency (11.8%). Finally, the planning tasks least initiated were: having copies of state (38.2%) and local (38.7%) emergency planning regulations and requirements and maintaining staff member and family sheltering-in-place guidelines (50.0%).
Shelter-in-place
Significant gains were made in compliance with the shelter-in-place tasks (Table 3). Though staffing issues were identified as a major issue in previous research, facilities in both the OIG group and this study group were compliant (10% or less “not initiated”) in designating key personnel needed during an emergency with detailed assignments. There was slight progress in detailing measures to secure the building, yet it remained a gap in this study with 11.3% “not initiated.” Compared to the OIG study, significant progress had been made in many shelter-in-place tasks, as indicated by percentage point differences between the studies. Tasks with significant improvement included: specifying back-up power (36.1%) and fuel (36.4%); detailing the amounts and types of food needed (37.5%); specifying availability of potable water (52.8%) and common pharmacy stocks (70.4%); and description of hosting procedures and details ensuring 24-hour operations for a minimum of seven days (66.5%).
In summary, this category demonstrated the highest proficiency in planning, with only detailing measures to secure the building remaining as a significant gap.
Evacuation
Facilities in both groups were compliant in only one task, designating an internal person other than authorities responsible for initiating the evacuation (Table 4). Significant progress had been made in logistical support for transporting water (60.5%), accounting for individuals during (71.3%) and after the evacuation (73.2%), ensuring transportation of assistive devices (46.2%), procedures describing staff responsibilities during evacuation (31.1%) and for illness or death (54.7%) in route, and planning for availability of mental health and grief counselors at reception points (32.3%). Slight progress had been made in determining who should initiate the evacuation plan (6.6%) and staff responsibilities with a back-up plan (8.6%), though this remained a gap. There were three tasks where non-initiation was slightly higher in this study group compared to the OIG group, including: identified evacuation routes (20.0% vs 12.5% in the OIG study); and how persons receiving care (16.4% vs 8.0% in the OIG study) and their families (16.4% vs 8.0% in the OIG study) would be notified and communicated with about the evacuation. Initiation of protection and transportation of residents’ medical records was similar in both groups, remaining 12.7% non-initiation.
The evacuation category included many new tasks which were not in the OIG group and therefore provided no comparison data. Though most of the new tasks were not highly initiated in the study group, great progress was made in two task items. Identifying the person responsible for implementing the evacuation was “not initiated” by 1.5% and how staff was to be notified of the evacuation was “not initiated” by 11.1% of the respondents. The following new tasks had high “not initiated” percentages: having alternative evacuation routes (19.1%), maps of routes (19.1%), and specified travel times for routes (22.1%); ways to protect medication under control of a nurse (20.8%); procedures for identifying and transporting individual care items (25.0%); as well as resident records and lists of items to be transported (36.4%).
In summary, emergency preparedness gaps remained in many evacuation tasks. Those with the highest scores of “not initiated” included: preparing a back-up evacuation site 50 miles away (31.5%); specifying travel times for routes (22.1%); having ways to protect medication under control of a nurse (20.8%); establishing procedures for identification and transportation of individual care items (25%); as well as resident records and lists of items to be transported (36.4%). Also included were: having adequate means to transport assistive devices (20.4%); staff responsibilities if resident becomes ill or dies (32.8%); and availability of mental health and grief counselors at reception points (55.2%).
Perception of Preparedness
As a final measure, respondents were asked to rate themselves, using a scale of one to 10, to assess how prepared their facility was to respond to a disaster. The aggregate score was 7.38 (SD=1.829) and a range of eight, with one-third scoring themselves nine or 10. Only 41.5% had experienced a disaster while 58.5% had not. Those who had experienced a disaster reported slightly higher preparedness (7.78; SD=1.829) than those who had not (7.05; SD=1.972), though this difference was not significant (P=.329). These data demonstrate facilities’ acknowledgement that work remains in the area of disaster preparedness. Finally, this study examined if there were any significant differences in perception of preparedness between the demographic subgroups, and none were found.
Discussion
At a time when emergency preparedness standards have been elevated through the regulatory process, these results suggest that many nursing homes are more prepared than they were five years ago. For example, less than eight percent of the nursing homes in this study had “not initiated” the tasks required for communicating information (ie, list of facility personnel and contact information, facility organizational chart, contact information of local and state emergency agencies, and/or back-up communication methods), indicating that progress has been made in establishing methods of communicating information between facility personnel and stakeholders. In addition, more than 92% of the respondents indicated that they had written agreements with suppliers and medical providers and more than 95% of the respondents indicated they had adequate food, water, back-up power, and staff to shelter-in-place. However, not all respondents reported that they had begun work on all the required tasks in the overall planning and sheltering-in-place categories. These include methods to transport medical records securely, having copies of local and state emergency planning regulations, and establishing plans to house staff members’ families.
The study findings from nursing homes in North and South Carolina reflect some of the same findings as Castle’s 2008 evaluation of evacuation plans from 2,134 nursing homes throughout the US. Both studies report that most nursing homes had initiated analysis of likely hazards and vulnerabilities, and had provisions for emergency power, food, water, extra pharmacy stocks of common medications, and staff while sheltering-in-place. Similar findings were reported in areas identified as “not initiated.” For example, both studies reported that only approximately one-half of the facilities specified whether families could shelter at the facility. Furthermore, only 35% of the facilities included a list of items to accompany residents during evacuation, and only 77% had methods to protect medications under the control of a registered nurse.Reference Eiring, Blake and Howard 20
Notable differences between the studies include having specified evacuation routes and adequate food and water supply during evacuation. Eighty percent of the respondents in this study versus 31% in Castle’s study reported having evacuation routes and secondary routes, including maps and specified expected travel times. Castle found that 72% of the facilities had adequate food supplies and only 36% had adequate water supplies during evacuation.Reference Eiring, Blake and Howard 20 On the other hand, 85% of the respondents of this study believed that they had adequate food and water supplies and logistical support for transporting them. The findings of this study could indicate that nursing homes have made improvements in evacuation planning since 2008. Differences in aggregation of these data limited comparison of some areas, including the various communication tasks. Castle reported that only 66% of the facilities had clear communication protocols, while less than eight percent of this study’s respondents indicated they had “not initiated” the various tasks that contribute to clear communication between stakeholders.Reference Eiring, Blake and Howard 20 This difference could be due to improvements made in communication processes since 2008, the items used to assess communication in each study, or that the results of this study are self-reported as opposed to an external review of evacuation plans.
Overall, progress has been made in many emergency preparedness planning and sheltering-in-place tasks, some more so than others, such as collaboration with emergency management agencies. Nursing homes depend on state and local emergency agencies to provide information and guidance to plan for an emergency, as well as respond during the emergency, which is why collaboration and information sharing are critical. Only 62% of this study’s respondents indicated that they had the most recent local and state emergency planning regulations and requirements, although this reflected a 21% increase from the OIG study. These findings could be attributed to the relationship that the nursing home has with the emergency management agency. Castro and colleagues reported that only 40% of the nursing homes that sheltered-in-place during hurricane Rita had a good to very good relationship with the local emergency management agency.Reference Blanchard and Dosa 14 Whereas a majority of those facilities that evacuated reported having a good relationship and a “need to strengthen their relationship with the local office of emergency management.”Reference Blanchard and Dosa 14 (p13) The number of nursing homes obtaining the most current state and local emergency planning regulations and requirements may improve, as nursing homes increase participation in local emergency management agency annual planning (88.2% of the respondents reported they did collaborate in planning with local Emergency Medical Services). Relationships and coordination (as well as obtaining planning regulations) with local and state emergency management agencies should continue to improve as nursing home staff become more comfortable with their role as Emergency Support Function-8 (ESF-8) agencies. As of 2015, both North and South Carolina Emergency Operation Plans include nursing homes as ESF-8 agencies. In addition, both states have initiatives in place to increase emergency management coordination and communication with nursing homes during emergency planning, response, and recovery stages of a disaster. 26 , 27
Establishing a plan for whether staff and residents’ families can stay at or evacuate with the facility during a disaster is a complex process; it’s no surprise that nursing homes continue to struggle with formulating a written plan. Nursing home staff regularly plan for the residents they provide care and services for; typically, a known number of residents with established and documented dietary, medical, psychosocial, and assistive equipment needs. Needless to say, planning for the unknown can be an overwhelming task: “How many resident families will need shelter?” “How long will shelter be necessary?” “What are their special needs?” The same questions must be asked when planning for staff members’ families, as well. While the task of planning for the unknown is in itself intimidating, the costs of accommodation can be prohibitive.
Evacuation tasks seem to be the most challenging to complete for nursing homes. While the secure transportation of residents’ medical records is noted as an overall planning task, the contents of the medical record, including the list of items to accompany residents during evacuation, as well as procedures to ensure residents’ wheelchairs and other assistive devices are available during transit, are evacuation tasks. Ensuring processes for secure transportation of medical records that contain essential information for individualized care of the resident continues to be problematic. This could be due to changes in resident needs and the need to constantly update lists, or the arduous nature of the task and limited staff time. Access to medical records during and after an evacuation might be improved by use of electronic medical records or off-site medical records access. In Blanke and McGrady’s 2012 study, 28 they document how off-site storage of electronic medical records enabled immediate continuity of operations after a fire destroyed the facility of the Visiting Nurses Association of North Texas (Dallas, Texas USA). However, Eiring and colleagues’ study of emergency preparedness plans revealed that few facilities had electronic medical records (23%) or off-site medical record access (17%).Reference Castle and Engberg 19
Although many of the nursing homes indicated they had pre-determined evacuation locations, fewer had written agreements with “like” facilities, and even fewer had back-up evacuation sites more than 50 miles away; this was a common theme across studies.Reference Dolan 3 , Reference Eiring, Blake and Howard 20 , Reference Castle 21 A contributing factor could be that there is limited confidence in the hosting organization’s ability to actually accept residents during an emergency event. One study reported that after hurricane Charley (2004; Florida USA), multi-facility organizations accepted residents from their sister facilities but not from the nursing homes with which they had host agreements.Reference Laditka, Laditka, Cornman, Davis and Richter 11 This is consistent with Eirings’ findings in that 73% of the nursing homes plan to evacuate to a facility within the multi-facility organization.Reference Castle and Engberg 19 Pre-determined evacuation locations nearby and greater than 50 miles away may be an appropriate focus of state and local emergency planning efforts among nursing home leaders, emergency management agencies, and regulatory authorities.
Of the three areas of preparedness planning, sheltering-in-place, and evacuation, the study respondents indicated that they have completed more planning and sheltering-in-place tasks than evacuation tasks. This could be due to the newness of some of the evacuation tasks, whereas many of the planning and sheltering-in-place tasks were required in the existing regulations.Reference Blanke and McGrady 29 In fact, when reviewing tasks with the highest non-completion rates, most were not reported in the OIG study and are newly required tasks. These include having maps and alternate evacuation routes, as well as detailed lists of items patients need during and after evacuation. On the surface these appear as simple tasks, but are complex and fraught with vagaries due to unknowns with availability of transport vehicles and road accessibility, and changes in patient acuity or exacerbation of existing medical conditions during transport. On the other hand, there are newly required tasks that have very low “not initiated” percentages; these appear to be tasks that were easily implemented or were already in place, although not measured. For example, identifying a person who will implement the plan could be accomplished by reviewing the organization chart and emergency call list. Those tasks with the highest “not initiated” percentages could be due to the challenges they pose to nursing homes. Recent studies illuminate the lack of support, and even feelings of abandonment from emergency management agencies, ombudsman, public authorities, transportation services, and utility, food, water, and medical suppliers, making evacuation planning a challenging and complex task for nursing home staff.Reference Castro, Persson, Bergstrom and Cron 15 , 30
Limitations
Data from this survey relied on self-report rather than objective determination by an external reviewer. The low response rate and sample size are limitations of this study. As described by Stallings in his seminal work on disaster preparedness research, the context of the situation at the time of the study may impact both participation and responses.Reference Dosa, Hyer, Brown, Artenstein, Polivka-West and Mor 31 The electronic surveys were emailed to administrators within months of the emergency preparedness guidelines becoming policy and enforceable tasks during licensure and certification surveys. Timing may have contributed to the low response rate: 11.9% for North Carolina and 6.7% in South Carolina. Of the North Carolina respondents, 28.6% were from Eastern North Carolina, an area prone to floods and hurricanes. Respondent views may differ from non-respondents, especially those in non-coastal regions of North and South Carolina. Obtaining data from one region may limit the generalizability of the findings to other like regions of the country (coastal regions). Further study of the hazard vulnerabilities and disasters in various regions of the country is needed to assess the impact of an all hazards nationwide checklist.
Conclusion
Nursing homes have made progress in preparing for disasters, yet persistent gaps suggest several implications for policy, practice, and further study. While studies suggest that compliance with the new CMS regulatory standards will result in better preparedness and improved outcomes, more research is needed to determine which tasks will result in the most important outcome: preventing premature morbidity and mortality. Of the 70 items on the checklist, the largest gaps were found in shelter-in-place and evacuation tasks. Relationships with local emergency management agencies may contribute to improvements in these areas. Further study of the hazard vulnerabilities and disasters in various regions of the country could shed light on why some shelter-in-place and evacuation tasks are more challenging than others for nursing homes.