

NOMENCLATURE
 $AR$
aspect ratio
- $b$
wingspan
- ${C_L}$
lift coefficient
- ${C_D}$
drag coefficient
- ${C_{D0}}$
parasitic drag coefficient
- $D$
drag
- $E$
energy
- $h$
flight altitude
- ${H_R}$
reference height
- $I$
solar constant
- ${I_0}$
vertical solar illumination intensity
- ${K_D}$
induced drag factor
- $L$
lift
- $M$
number of nodes
- $m$
mass
- $nd$
number of days in a year
- ${{\bf{n}}_{\bf{s}}}$
vector of the earth–sun direction
- ${{\bf{n}}_{\bf{w}}}$
normal vector of the wing
- $P$
power; energy change per time
- $p$
intensity of the wind field gradient
- ${S_w}$
wing area
- ${t_{mission}}$
the time of the mission
- ${\bf{u}}$
input control vector
- $V$
airspeed
- ${V_R}$
wind speed at reference height
- ${V_W}$
wind speed
- ${\bf{x}}$
state vector of the system
- ${\beta_s}$
solar elevation angle
- $\varepsilon$
eccentricity of the earth
- ${\eta_{asc}}$
ratio of the area of the solar panels to the wing area
- ${\eta_{sc}}$
energy conversion efficiency of the solar panels
- ${\eta_T}$
efficiency of the propulsion system
- ${\eta_m}$
efficiency of the energy management system
- $\gamma$
pitch angle
- ${\gamma_s}$
solar azimuth
- ${\kappa_{bat}}$
battery energy density
- $\mu$
bank angle
- ${\omega_s}$
sun hour angle
- $\psi$
heading angle
- ${\sigma_T}$
power weight ratio of propulsion system
- ${\theta_s}$
geographical latitude of the flight location
- ${\varphi_s}$
declination angle
- ${\xi_T}$
power output factor of the propulsion system


Subscripts
- sp
solar power system
- T
propulsion system
- bat
battery
- max
maximum
- D
drag
1.0 INTRODUCTION
A solar aircraft uses solar power as its main energy source and has better endurance and mission sustainability than other types of aircraft; therefore, solar aircraft research is being conducted worldwide. UAVs offer prominent advantages for reconnaissance and surveillance tasks(Reference Luo, Rongzeng and Haibin1,Reference Ouyang, Zhuang, Lin and Liu2) , and they are already being operated by military forces and civilian organisations(Reference Ng and Leng3,Reference Harasani, Arai, Khalid and Fukuda4) . Small solar UAVs are less costly than larger UAVs; however, due to load limitations, the on-board energy capacity is relatively low(Reference Yang and Wei5), limiting their practical applications. Long-endurance flight is a key design objective of aircraft, and all-day flight is a long-term goal in solar vehicle design(6,Reference Noth7) . However, due to the contradiction between battery weight and energy capacity limitations(Reference Langelaan and Roy8), small solar UAVs have difficulty achieving all-day flight.
Numerous studies have been conducted to extend the flight duration of solar UAVs and achieve all-day flight. Klesh and Kabamba(Reference Klesh and Kabamba9) focused on maximising the energy ratio and found that the range of solar-powered UAVs could be increased by efficient design and optimal path planning. Sineglazov et al. developed a power–energy system for energy management(Reference Sineglazov and Karabetsky10,Reference Sineglazov and Karabetsky11) . Spangelo et al.(Reference Spangelo, Gilberty and Kleshz12,Reference Spangelo and Gilbert13) investigated the relationship between the flight trajectory and energy acquisition efficiency for a vertical cylindrical surface, and the effects of the flight path angle and heading angle were analysed. Chang et al.(Reference Chang, Zhou and Zheng14,Reference Chang, Zhou and Li15) used active rotation of photovoltaic modules to obtain more solar energy. In these studies, the efficiency of the solar energy acquisition was improved by adjusting the flight trajectory, flight attitude and energy management, but the energy loss at night when there is no solar energy was not addressed. Research on the constraint of energy on-board still needs to be done.
Other research has focused on energy consumption reduction. Brandt and Gilliamt(Reference Brandt and Gilliamt16) proposed the concept of storing gravitational potential energy. Ma Dongli et al. analysed the effect of the flight trajectory of solar aircraft at different flight altitudes(Reference Ma, Bao and Qiao17). In these studies, the energy consumption was reduced at night, but the efficiency of solar energy acquisition during the day was not addressed.
An additional onboard energy source is needed to improve energy acquisition during the day and reduce energy consumption at night. Therefore, the dynamic soaring technique is investigated in this study. All-day flight of small solar UAVs can be achieved by obtaining additional energy from the wind field.
Dynamic soaring is a technique for extending the flight duration and allows small UAVs to obtain energy from a horizontal wind gradient using flight manoeuvres. Lord Rayleigh analysed the flight pattern of albatrosses and proposed the theory of dynamic soaring(Reference Rayleigh18). According to Sachs et al., drifting albatrosses use dynamic soaring to gain extra energy from the wind field. The birds can fly continuously from South Georgia to the Southwest Pacific with a flight power of 81 W in 13.2 days. The energy they consume is equivalent to 5.6–11.9 L of gasoline, far exceeding their energy reserves(Reference Sachs, Traugott and Nesterova19). Horizontal wind field gradients are ubiquitous at the altitudes commonly used by small UAVs. With appropriate path planning and flight manoeuvres, the combination of dynamic soaring and solar energy technology can overcome the shortcomings of solar energy systems, which do not provide energy at night, and improve the energy acquisition efficiency during the day. The combination of these two energy acquisition techniques can reduce energy consumption and battery weight and allow small UAVs to achieve long-duration flight. Dynamic soaring is also available in high altitude, but due to the heavy structure and high flight speed of high-altitude solar UAVs, the energy acquisition rate provided by dynamic soaring is limited. This research mainly focusses on small solar UAV to analyse optimal energy acquisition methods.
In recent years, dynamic soaring techniques have been developed. Zhao used NPSOL to optimise the minimum energy consumption of dynamic soaring vehicles(Reference Zhao20,Reference Zhao and Qi21) . Sachs determined the minimum gradient wind field needed for dynamic soaring of powerless gliders(Reference Sachs22,Reference Sachs and Bussotti23) . Deittert et al. studied optimisation of the flight path to minimise the energy consumption of small UAVs using dynamic soaring(Reference Deittert, Richards and Toomer24). Liu Duoneng et al. used the Runge–Kutta integral method to optimise dynamic soaring flight trajectories of different types of travelling and loitering patterns(Reference Liu, Hou and Guo25).
Zhu Bingjie analysed the energy variations during dynamic soaring flight using the Gauss pseudospectral method(Reference Zhu and Hou26). The use of a single type of energy has limited applications for small UAVs, whereas the combination of different energy acquisition technologies shows greater promise. Gao Xianzhong analysed the advantage of combining solar energy, dynamic soaring and gravitational potential; the benefits of dynamic soaring were preliminary discussed, but further research is needed(Reference Gao27).
The objectives of this study are to combine dynamic soaring with solar energy acquisition, determine the optimal energy acquisition methods for small solar UAVs using dynamic soaring and decrease the battery load to achieve all-day flight. A periodic loitering pattern is chosen to analyse the total energy change in the simulation(Reference Zhao20). Analyses and flight simulations of small solar UAVs using dynamic soaring are conducted to demonstrate the following: (1) the use of dynamic soaring significantly reduces the energy consumption after optimisation, and the battery weight is significantly lower when dynamic soaring is used; (2) the flight speed and flight attitude angles have significant effects on the optimal total energy acquisition; (3) the wind field shape and solar conditions have considerable effects on the ability of the solar UAV to exploit dynamic soaring for all-day flight.
2.0 MODELLING
Modelling is used to analyse the energy acquisition from the wind field and the influence of solar illumination. The models include a wind field model, a model of the solar power energy system and a flight dynamics model. The models are used to determine the energy acquisition from the horizontal wind gradient, the energy acquisition and conversion of solar radiation energy, the changes in the flight attitude and the energy expenditure during the flight.
2.1 Wind field model
Horizontal wind gradients occur widely in the atmosphere and are most common at altitudes at sea level, which is the common flying height of small UAVs. An exponential wind shear model is used to describe the wind field, with a horizontal gradient that is used as the energy source for dynamic soaring(Reference Sachs, Traugott and Nesterova19):
 \begin{equation}{V_W}(h) = {V_R}{\left( {\frac{h}{{{H_R}}}} \right)^p}\end{equation}
where  ${H_R}$ and
 ${V_R}$ represent the reference height and the wind speed at this height, respectively, h is the altitude,
 ${V_W}$ is the wind speed at altitude h, and p is the power-law exponent, which reflects the intensity of the wind field gradient. Different values are used for different environmental conditions. Deittert chose p = 0.143 to describe the horizontal wind gradient above a water surface(Reference Deittert, Richards and Toomer24), and Liu Duoneng chose p = 0.25 for a long-term flight mission over complex terrain(Reference Zhu and Hou26). The default wind field value
 ${H_R}$ = 20m, p = 0.25 and
 ${V_R}$ = 8m/s are used in the simulation for a persistent wind field on land in the mid-latitude area of the Northern Hemisphere(Reference Zhu and Hou26). Wind fields with different parameters p and
 ${V_R}$ are also discussed in this paper. The wind fields with different parameters are shown in Fig. 1.
Wind field model with different values of p or VR.

In the flight simulation, we assume that the wind direction is the +X direction of the earth’s axis to control variables. The wind direction changes at different times of the year, but considering the terrain and other factors, the wind direction can still be considered to be in the same direction in a local environment.
2.2 Model of the solar power energy system
The model of the solar power energy system describes the solar energy acquisition and the energy output of the propulsion system. The vertical solar illumination intensity  ${I_0}$ is modelled as follows(Reference Ma, Bao and Qiao17,Reference Zhu, Li and Xu28,Reference Jun, Jun and Yuxin29) :
 \begin{align}{I_0} &= I{\left( {\dfrac{{1 + \varepsilon \cos {\alpha_s}}}{{1 - {\varepsilon ^2}}}} \right)^2}\nonumber\\[3pt]{\alpha_s} &= 2\pi (\text{nd} - 4)/365\end{align}
where I is the solar constant, which is 1367W/m2,  $\varepsilon $ is the eccentricity of the earth (0.017) and nd is the number of days in a year, beginning on January 1. The vector of the earth–sun direction is
 ${{\bf{n}}_{\bf{s}}}$:
 \begin{align}\sin {\beta_s} &= \sin {\theta_s}\sin {\varphi_s} + \cos {\theta_s}\cos {\varphi_s}\cos ({\omega_s})\nonumber\\[3pt]\sin {\gamma_s} &= \dfrac{{\sin {\beta_s}\sin {\theta_s} - \sin {\varphi_s}}}{{\cos {\beta_s}\cos {\theta_s}}}\nonumber\\[3pt]{\varphi_s} &= 23.45\pi \sin \left( {2\pi \times \dfrac{{284 + nd}}{{365}}} \right)/180\nonumber\\[3pt]{\omega_s} &= \pi - \pi {t_{mission}}/12\nonumber\\[3pt]{{\bf{n}}_{\bf{s}}} &= \left( {\cos {\beta_s}\sin {\gamma_s},\cos {\beta_s}\cos {\gamma_s},\sin {\beta_s}} \right)\end{align}
where  ${\beta_s}$ is the solar elevation angle,
 ${\gamma_s}$ is the solar azimuth measured clockwise from east,
 ${\varphi_s}$ is the declination angle,
 ${\theta_s}$ is the geographical latitude of the flight location,
 ${\omega_s}$ is the sun hour angle and
 ${t_{mission}}$ is the time of the mission. The solar altitude angle on different dates is shown in Fig. 2.
The solar altitude angle on different dates.

The efficiency of solar energy acquisition depends on the angle between the vector of the earth–sun direction  ${{\bf{n}}_{\bf{s}}}$ and the normal vector of the wing
 ${{\bf{n}}_{\bf{w}}}$:
 \begin{equation}{P_{sun0}} = {I_0}\cos \left\langle {{{\bf{n}}_{\bf{s}}}{\bf{,}}{{\bf{n}}_{\bf{w}}}} \right\rangle\end{equation}
The solar energy is converted to mechanical energy using the solar power energy system:
 \begin{equation}{P_{sun}} = {P_{sun0}}{S_w}{\eta_{sc}}{\eta_{asc}}{\eta_m}{\eta_T}\end{equation}
where  ${S_w}$ is the wing area,
 ${\eta_{asc}}$ is the ratio of the area of the solar panels to the wing area,
 ${\eta_{sc}}$ is the energy conversion efficiency of the solar panels,
 ${\eta_T}$ is the efficiency of the propulsion system and
 ${\eta_m}$ is the efficiency of the energy management system.
2.3 Flight dynamics model
A three-degree-of-freedom model of the UAV is adopted(Reference Zhao20). The sideslip angle is ignored to simplify the model and focus on the influence of dynamic soaring on the energy acquisition of small solar UAVs(Reference Sachs22,Reference Deittert, Richards and Toomer24,Reference Zhu and Hou26) . The lift L and drag D are calculated using a simplified model as follows:
 \begin{align}L = \rho {S_w}{C_L}{V^2}/2\nonumber\\[3pt]D = \rho {S_w}{C_D}{V^2}/2\\[3pt]{C_D} = {C_{D0}} + {K_D}C_L^2\nonumber\end{align}
where  ${C_L}$ is the lift coefficient and
 ${C_D}$ is the drag coefficient;
 ${C_D}$ depends on
 ${C_L}$,
 ${C_{D0}}$ is the parasitic drag coefficient and
 ${K_D}$ is the induced drag factor.
The definition of the forces and angles used in the flight model of the dynamic soaring simulation of the UAV is shown in Fig. 3.
Forces and angles acting on the UAV.

The dynamic soaring flight model of the UAV is defined in Equation (7), which shows the changes in the flight state and position of the UAV during dynamic soaring.
 \begin{align}m\dot V &= T - D - mg\sin \gamma - m{{\dot V}_W}\cos \gamma \sin \psi \nonumber\\mV\cos \gamma \dot \psi &= L\sin \mu - m{{\dot V}_W}\cos \psi \nonumber\\mV\dot \gamma &= L\cos \mu + m{{\dot V}_W}\sin \gamma \sin \psi - mg\cos \gamma \nonumber\\\dot h &= V\sin \gamma \nonumber\\\dot x &= V\cos \gamma \sin \psi + {V_W}\nonumber\\\dot y &= V\cos \gamma \cos \psi \end{align}
The equation is defined in the flightpath axis system, where  $\psi $ is the heading angle,
 $\gamma $ is the pitch angle of the flight path and
 $\mu $ is the bank angle. The pitch angle is positive when climbing upward, and the heading angle is positive when deflecting from the positive direction of the +Y axis to the the +X axis, both of which are defined in the flightpath axis system. These parameters define how the flight attitude changes during dynamic soaring.
 $(x,y,h)$ describes the position of the UAV in an earth-fixed reference frame,
 $V$ is the airspeed and
 ${V_W}$ is the wind speed; the wind direction is always in the x-axis direction. The lift L, drag D and thrust T are defined in the wind axis system. The variables in the kinematic formula are defined in the earth axis system.
One of the glider models that is commonly used in dynamic soaring simulations is chosen in this study(Reference Deittert, Richards and Toomer24,Reference Zhu and Hou26) . The parameters are shown in Table 1(Reference Chang, Zhou and Li15,Reference Ma, Bao and Qiao17) :
Model reference parameter of a small UAV

3.0 ENERGY ANALYSIS
It is necessary to limit the energy use of the aircraft to balance the energy acquisition and expenditure and ensure that the aircraft can fly day and night; therefore, closed-loop energy analysis is conducted. Analyses of the energy expenditure needed to maintain flight, the relationship between the energy acquisition and the flight attitude, the energy conditions needed for ultra-long flight and the load cost of the closed-loop energy system are also carried out.
3.1 Closed-loop energy system
The solar power energy system manages the solar energy acquisition, storage and output. The amount of energy  ${E_{sp}}$ changes as a result of the acquisition of solar energy
 ${E_{sun}}$ and the energy output by the propulsion system
 ${E_T}$.
 ${E_{sp}}$ is expressed as
 \begin{equation}{E_{sp}} = {E_{sun}} - {E_T}\end{equation}
The solar energy power system of the aircraft must be a closed-loop system to achieve all-day flight. During the day, solar radiation is absorbed and converted into electrical energy by the solar power energy system, while the system outputs energy to propel the aircraft and excess energy is stored in the batteries. At night, there is no solar radiation, and the energy output required for flight is provided by the batteries. A closed-loop energy system must be used to achieve continuous flight day and night. In the daytime, the energy converted from solar radiation by the solar cells should be greater than the energy consumption for flight, and the extra energy stored in the battery is used to maintain flight during the night. This process is called the daytime closed-loop energy process. At night, the residual energy in the battery should be no less than the energy required for night flight. This process is called the nighttime closed-loop energy process. Both processes together are called the all-day closed-loop energy process, which is expressed in Equation (9) and Fig. 4.
 \begin{align}{E_{wholeday}} &\ge {E_{need\_day}} + {E_{ch\arg e}}\nonumber\\ &= {E_{sun}} - {E_{T\_day}} + {E_{ch\arg e}}\\{E_{ch\arg e}} &\ge {E_{need\_night}} = {E_{T\_night}}\nonumber\end{align}
Sketch of all-day energy change.

In this study, we focus on a loitering flight pattern; therefore, the system has to be a closed-loop system with regard to mechanical energy. The mechanical energy  ${E_{mechnical}}$ is defined as follows:
 \begin{equation}{E_{mechnical}} = mgh + \frac{1}{2}m{V^2}\end{equation}
The time derivative of the mechanical energy is expressed as
 \begin{equation}{\dot E_{mechnical}} = mg\left(\dot h + \frac{1}{g}V\dot V\right)\end{equation}
The parameters in this equation are defined as
 \begin{equation}\quad\dot h = V\sin \gamma\end{equation}
 \begin{equation}{\dot V_W} = \frac{{d{V_W}}}{{dh}}\dot h\end{equation}
We combine Equations (7), (12), (13) and (10) to obtain
 \begin{align}{{\dot E}_{mechnical}} &= - \frac{{d{V_W}}}{{dh}}m{V^2}\sin \gamma \cos \gamma \sin \psi \nonumber\\&\quad+ TV - DV \end{align}
Equation (14) represents the changes in mechanical energy during the flight. The path of dynamic soaring is shown in Fig. 5. The right-hand side of the equation represents the wind energy obtained from dynamic soaring  ${P_{wind}}$, the energy output of the propulsion system
 ${P_T}$ and the energy consumption to overcome the resistance of aerodynamic drag
 ${P_D}$. When
 $\sin \gamma \sin \psi < 0$, i.e. when the UAV climbs upwind or dives downwind, then
 ${P_{wind}}>0$, and the UAV gains energy from the wind field; otherwise, the UAV loses energy. Therefore, using appropriate flight control and path planning, the UAV represents a closed-loop energy system that does not consume mechanical energy, thereby improving its endurance.
Path of dynamic soaring.

The expression of mechanical energy is provided in Equation (15)
 \begin{align}{E_{mechnical}} &= \int_0^{{t_n}} {({P_{wind}} - {P_D} + {P_T})dt} \nonumber\\ & = {E_{wind}} - {E_D} + {E_T}\end{align}
The energy storage capacity of the solar power energy system is the primary factor that prevents a small solar UAV from meeting closed-loop conditions. The expression of the energy storage capacity is as follows:
 \begin{equation}{E_{ch\arg e}} = {E_{sp\_\max }} \le {\eta_m}{\eta_T}{m_{bat}}{\kappa_{bat}}\end{equation}
where  ${m_{bat}}$ is the mass of the battery and
 ${\kappa_{bat}}$ is the battery energy density. After satisfying the closed-loop energy conditions, all-day flight can be achieved. In the daytime, dynamic soaring is used to charge the battery in conjunction with solar energy, whereas at night, it becomes the only external energy source to decrease the consumption of the energy stored in the battery. When the total energy output at night is less than the battery storage, the closed-loop energy conditions are met, which is expressed as:
 \begin{align}{P_{bat\_out}} &= {P_{need}} - {P_{sun}} - {P_{wind}}\nonumber\\{P_{bat\_out}} &\ge 0\\{P_{need}} &= {P_D}\nonumber\end{align}
where  ${P_{need}}$ is the power required for flight and
 ${P_{bat\_out}}$ is the battery power output.
3.2 Minimum mass required for power energy systems
The minimum mass of the solar power energy system,  ${m_{sp}}$, is used as the evaluation index to determine the energy efficiency of the small solar UAV using dynamic soaring in a closed-loop energy system. The expression for
 ${m_{sp}}$ is
 \begin{equation}{m_{sp}} = {m_{sp0}} + {m_{bat}} + {m_p}\end{equation}
The components of the mass of the solar power energy system include the battery mass  ${m_{bat}}$, the power system mass
 ${m_p}$ and the other mass
 ${m_{sp0}}$. The weight of the battery is an important part of the solar power energy system, and it is also the part that is most affected by dynamic soaring. The calculation function is obtained from Ref. Reference Sineglazov and Karabetsky10.
 \begin{align}{m_{bat}} &= \frac{{{E_{ch\arg e}}}}{{{\eta_m}{\eta_T}{\kappa_{bat}}}} = \frac{{{P_{T\_night}}{t_{night}}}}{{{\eta_m}{\eta_T}{\kappa_{bat}}}}\nonumber\\[3pt]{m_p} &= \frac{{{P_{T\_\max }}{\xi_T}}}{{{\eta_T}{\sigma_T}}}\end{align}
A smaller  ${m_{sp}}$ indicates that the small solar UAV can carry a larger mission load in one mission, or complete the same mission with less energy consumption because more energy is acquired due to energy sources external to the UAV.
3.3 Analysis of optimal energy acquisition methods
The energy analysis in Equation (14) shows that most of the energy required during the flight of the small UAV comes from the energy  ${E_{wind}}$ obtained by dynamic soaring from the wind field gradient and the solar energy
 ${E_{sun}}$ obtained by the solar power energy system. The energy acquisition is related to the flight attitude; therefore, the amount of energy can be maximised by adjusting the flight attitude of the aircraft.
The power corresponding to the energy obtained by dynamic soaring  ${P_{wind}}$ can be expressed as
 \begin{align}{P_{wind}} &= - \frac{{d{V_W}}}{{dh}}m{V^2}\sin \gamma \cos \gamma \sin \psi \nonumber\\&= - \frac{1}{2}\frac{{d{V_W}}}{{dh}}m{V^2}\sin 2\gamma \sin \psi \end{align}
Equation (20) shows that the wind energy acquisition is related to the heading angle and flight path angle.  ${P_{wind}}$ is positive during upwind climbing and downwind diving, thus wind energy is acquired; in the opposite conditions, energy is expended. When
 $\psi = 90^\circ ,\gamma = - 45^\circ $ or
 $\psi = - 90^\circ ,\gamma = 45^\circ $, the aircraft can maximise the energy acquisition from the wind gradient when the aircraft is flying downwind at a 45° angle or upwind at an angle of 45°. The maximum power
 ${P_{wind}}$ is
 \begin{equation}\max ({P_{wind}}) = \frac{1}{2}\frac{{d{V_W}}}{{dh}}m{V^2}\end{equation}
In this condition, the wind energy acquisition is related to the wind gradient and flight speed. According to the actual flight conditions of a small UAV, when  $d{V_W}/dh = 0.2{s^{ - 1}},V = 21m/s$, the relationship between the wind energy acquisition and flight attitude can be obtained in Fig. 6:
Relationship between wind energy acquisition and flight attitude.

There are two maximum value points of wind energy acquisition, corresponding to the two cases in the previous analysis, as well as two minimum value points, namely the points of upwind diving and downwind climbing. These points are in agreement with the results of the analysis of  ${P_{wind}}$.
The expression for the solar energy acquisition is then
 \begin{align}{P_{sun}} &= {I_1}\cos \left\langle {{{\bf{n}}_{\bf{s}}},{{\bf{n}}_{\bf{w}}}} \right\rangle \nonumber\\{I_1} &= {I_0}{S_w}{\eta_{sc}}{\eta_{asc}}{\eta_m}{\eta_T}\end{align}
where
 \begin{align}{\bf{n}}_{\bf{s}} &= \left( {\cos {\beta_s}\sin {\gamma_s},\cos {\beta_s}\cos {\gamma_s},\sin {\beta_s}} \right) = ({\text{n}_{\text{s}1}},{\text{n}_{\text{s}2}},{\text{n}_{\text{s}3}})\nonumber\\{{\bf{n}}_{\bf{w}}} &= \left( \begin{array}{l}\sin \mu \cos \psi - \sin \gamma \cos \mu \sin \psi ,\\ - \sin \mu \sin \psi - \sin \gamma \cos \mu \cos \psi ,\\\cos\mu \cos \gamma \end{array} \right)^T\end{align}
The expression  $\cos \left\langle {{{\bf{n}}_{\bf{s}}}{\bf{,}}{{\bf{n}}_{\bf{w}}}} \right\rangle $ can be expanded as follows:
 \begin{align}\cos \left\langle {{{\bf{n}}_{\bf{s}}}{\bf{,}}{{\bf{n}}_{\bf{w}}}} \right\rangle &= (\sin \mu \cos \psi - \sin \gamma \cos \mu \sin \psi ){\text{n}_{\text{s}1}}\nonumber\\&\quad+ ({-} \sin \mu \sin \psi - \sin \gamma \cos \mu \cos \psi ){\text{n}_{\text{s}2}} + \cos\mu \cos \gamma {\text{n}_{\text{s}3}}\nonumber\\ &= (\cos \psi {\text{n}_{\text{s}1}} - \sin \psi {\text{n}_{\text{s}2}})\sin \mu \nonumber\\&\quad+ ({-} \sin \gamma \sin \psi {\text{n}_{\text{s}1}} - \sin \gamma \cos \psi {\text{n}_{\text{s}2}} + \cos \gamma {\text{n}_{\text{s}3}})\cos \mu \nonumber\\ &= A\sin \mu + B\cos \mu \end{align}
When the bank angle is a free variable in the formula,  $\cos \left\langle {{{\bf{n}}_{\bf{s}}}{\bf{,}}{{\bf{n}}_{\bf{w}}}} \right\rangle $ reaches its maximum when
 $\sin \mu = A/\sqrt {{A^2} + {B^2}} $:
 \begin{align}\max(\cos \left\langle {{{\bf{n}}_{\bf{s}}}{\bf{,}}{{\bf{n}}_{\bf{w}}}} \right\rangle ) &= \sqrt {{A^2} + {B^2}} \nonumber\\ &= \sqrt {{{(\cos \psi {\text{n}_{\text{s}1}} - \sin \psi {\text{n}_{\text{s}2}})}^2} + {{({-} \sin \gamma (\sin \psi {\text{n}_{\text{s}1}} + \cos \psi {\text{n}_{\text{s}2}}) + \cos \gamma {\text{n}_{\text{s}3}})}^2}} \end{align}
We use the flight date nd = 180 and the flight time  ${t_{mission}}$ = 12:00 as examples,
 ${I_1} = 553.8J$. The relationship between the solar energy acquisition and the flight attitude is shown in Fig. 7.
Relationship between solar energy acquisition and flight attitude.

The maximum values can be obtained by a series of points, which reflect the relationship between the heading angle and flight path angle. When the following is satisfied:
 \begin{equation}\sin \gamma = \frac{{\cos \psi {n_{s2}} + \sin \psi {n_{s1}}}}{{\sqrt {{{(\cos \psi {n_{s2}} + \sin \psi {n_{s1}})}^2} + {n_{s3}}^2} }}\end{equation}
the maximum solar energy acquisition is
 \begin{equation}{P_{sun}} = {I_1}\sqrt {{n_{s1}}^2 + {n_{s2}}^2 + {n_{s3}}^2} = {I_1}\end{equation}
In this case, the normal vector of the wing surface is parallel to the direction of the sunlight. The maximum solar power is obtained without considering other constraints.
The amounts of energy obtained from the wind gradient and solar radiation according to Equations (20) and (25) are related to the heading angle and flight path angle. When the bank angle is optimum, the total energy acquisition can be obtained.
 \begin{align}{P_{in}} &= - \frac{{d{V_W}}}{{dh}}m{V^2}\sin \gamma \cos \gamma \sin \psi \nonumber\\ &\quad+ {I_1}\sqrt {{{(\cos \psi {n_{s1}} - \sin \psi {n_{s2}})}^2} + {{({-} \sin \gamma (\sin \psi {n_{s1}} + \cos \psi {n_{s2}}) + \cos \gamma {n_{s3}})}^2}} \end{align}
The relationship between the total energy acquisition and the flight attitude is shown in Fig. 8 for the following conditions:  $d{V_W}/dh = 0.2{s^{ - 1}},V = 21m/s$, nd=180,
 ${t_{mission}}$ = 12:00,
 ${I_1} = 553.8J$:
Relationship between total energy acquisition and flight attitude.

When the bank angle is unlimited, the maximum energy acquisition rate is closer to the bank angle during dynamic soaring in the wind field. The reason is that the maximum points of the two methods are close to each other, whereas the gradient is smaller near the peak of solar power acquisition.
Equation (28) shows the relationship between the energy acquisition and the flight attitude under ideal conditions. The maximum energy acquisition can be achieved by changing the flight attitude. We obtain the partial derivative of Equation (28) and set it equal to 0 to obtain:
 \begin{align}\frac{{\partial {P_{in}}}}{{\partial \gamma }} = 0 &= - \frac{{d{V_w}}}{{dh}}m{V^2}(\cos^{2}\gamma - {\sin ^2}\gamma )\sin\psi \nonumber\\ &\quad + {I_0}\frac{{A \cdot (\cos\psi {n_{s1}} + \sin\psi {n_{s2}})\cos\gamma }}{{\sqrt {{A^2} + {{(\sin\psi {n_{s1}} - \cos \psi {n_{s2}})}^2}} }}\end{align}
 \begin{align}\frac{{\partial {P_{in}}}}{{\partial \psi }} = 0 &= - \frac{{d{V_w}}}{{dh}}m{V^2}\cos^{2}\gamma \sin \gamma \cos\gamma \cos \psi \nonumber\\ &\quad+ {I_0}\frac{{A\sin \gamma ({-} \sin\psi {n_{s1}} + \cos \psi {n_{s2}})}}{{\sqrt {{A^2} + {{(\sin\psi {n_{s1}} - \cos \psi {n_{s2}})}^2}} }}\nonumber\\ &\quad+ {I_0}\frac{{(\sin\psi {n_{s1}} - \cos \psi {n_{s2}})(\cos\psi {n_{s1}} + \sin \psi {n_{s2}})}}{{\sqrt {{A^2} + {{(\sin\psi {n_{s1}} - \cos \psi {n_{s2}})}^2}} }}\end{align}
 \begin{equation}A = \sin \gamma (\cos\psi {n_{s1}} + \sin\psi {n_{s2}}) + \cos\gamma {n_{s3}}\end{equation}
The maximum energy acquisition can be obtained when the partial derivative functions are satisfied. The effects of the flight speed and wind gradient on the maximum energy acquisition and the corresponding flight attitude can be determined by changing these factors. The results are shown in Figs 9 and 10.
Effect of flight speed on maximum energy acquisition.

Effect of wind gradient on maximum energy acquisition.

Figures 9 and 10 show the maximum energy acquisition of a small UAV, which combines two energy acquisition techniques, varying with the flight speed and wind gradient. In Figs 9 and 10, the maximum energy acquisition point together with the points where  $\left| {{P_{in}} - {P_{in\_\max }}} \right| \,{<=}\, 0.5W$ corresponding to different flight velocities or wind gradients are shown in the form of a colour gradient surface. The closer to the value of the maximum points, the redder the colour. The coordinate projection on the horizontal plane shows the flight path angle, and the heading angle corresponds to the maximum energy acquisition. The longitudinal coordinate projection represents the value of the energy acquisition, which is convenient for comparing different flight conditions.
Figure 8 shows that the relationship between the energy acquisition and the flight attitude is symmetrical with respect to the origin centre, therefore, we limit the discussion to  $ - 180^\circ \,{<=}\, \psi = 0^\circ ,0^\circ < \gamma < 90^\circ $ for convenience.
As shown in Fig. 9, as the flight speed increases, the horizontal coordinate projection of the maximum energy acquisition point gradually approaches the maximum wind field energy acquisition point  $\psi = - 90^\circ ,\gamma = 45^\circ $, while the total energy acquisition increases. Equation (28) shows that, as the flight speed increases, the solar energy acquisition remains unchanged, whereas the maximum wind energy acquisition further increases, gradually occupying a dominant position. Similarly, in Fig. 10, it is observed that, as the wind gradient increases, the horizontal coordinate projection of the maximum energy acquisition point gradually approaches the maximum wind field energy acquisition point. This result can be attributed to the increase in the wind gradient, which increases the proportion of wind field energy acquisition.
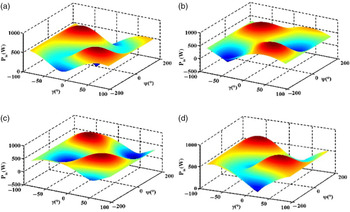
Different values of  ${{\bf{n}}_{\bf{s}}} = ({\text{n}_{\text{s}1}},{\text{n}_{\text{s}2}},{\text{n}_{\text{s}3}})$ at different times of the day also affect the energy acquisition, as shown in Fig. 11. To obtain the optimal energy acquisition, the small UAV should deflect to the direction of favourable solar energy acquisition and keep the overall trend of upwind climb and downwind dive.
The influence of the solar illumination conditions on the maximum energy acquisition is shown in Fig. 12.
Relation between energy acquisition and flight attitude at different times of day. (a) 6:00 am (b) 9:00 am (c) 3:00 pm (d) 6:00 pm.

Effect of solar illumination conditions on maximum energy acquisition.

The maximum intensity of the solar illumination varies little at different flight times, but the angle of solar illumination with the ground varies greatly. To maximise the ability to obtain solar energy, it is necessary to change the flight path angle and heading angle based on the illumination conditions and to ensure that the wing of the plane is as perpendicular as possible to the illumination vector. Since the maximum point of solar energy acquisition of the aircraft at 06:00 and 18:00 is closer to the maximum point of wind energy acquisition, the maximum energy acquisition is greater than at 12:00.
Different flight times affect the energy acquisition, but the maximum value is still concentrated near the maximum energy acquisition value of dynamic soaring. Considering the constraints and control requirements regarding the flight trajectory, the attitude variables may not satisfy the requirement for maximum total energy acquisition, but at the optimal attitude, the angle between the solar incident vector and the plane-normal vector of the wing surface should be minimised under the conditions of upwind climbing and downwind diving.
4.0 SIMULATION AND ANALYSIS
A cyclic flight pattern is chosen for the simulation, and a loitering pattern flight path(Reference Zhao20) is chosen as the reference flight trajectory. First, the single-cycle circular flight pattern is optimised to obtain the optimal energy acquisition under this condition, and the energy change is analysed to verify the advantages of the dynamic soaring technology in a single cycle for energy acquisition by a small solar UAV. Then, the optimal total energy acquisition at all times of the day is calculated to determine whether the all-day closed-loop energy conditions and the minimum mass of the power energy system can be met. Finally, the minimum mass required for the power energy system under different conditions is calculated to determine the effect of different wind field shapes and sunlight conditions.
4.1 Trajectory optimisation system
The trajectory optimisation system is established based on the model in Section 1 with the parameters of a typical aircraft (Table 1). The information flow and structural framework are shown in Fig. 13. The solar power energy system is an essential module to manage the total energy acquisition and output, including wind and solar energy management.
Information flow and structural framework of the trajectory optimisation system.

The trajectory optimisation system is solved with SNOPT.
The objective of the optimisation is to maximise the total energy acquisition to satisfy the all-day closed-loop energy condition:
 \begin{equation}\min J = - {E_{sp}} = - \int_0^{{t_n}} {{{\dot E}_{sp}}dt}\end{equation}
The model that includes the solar energy model and the dynamic soaring flight model is expressed as follows:
 \begin{equation}{\dot{\bf x}}(t) = {\bf{f}}({\bf{x}}(t),{\bf{u}}(t))\end{equation}
where  ${\bf{x}} = [V,\psi ,\gamma ,h,x,y]$ is the state vector of the system and
 ${\bf{u}} = [\mu ,{C_L},T]$ is the input control vector. The flight trajectory is discretised into M points, and the state vector of each point is determined by the flight control and initial flight state. Therefore, the design variables are
 \begin{align}{\bf{X}} &= [{x_{1,1}},...,{x_{6,1}},\nonumber\\ &\qquad {u_{1,1}},{u_{2,1}},...,{u_{1,M}},{u_{2,M}},{t_f}]\nonumber\\ &= [{\bf{x}}_1^T,{\bf{u}}_1^T,...,{\bf{u}}_M^T,{t_f}]\nonumber\\{x_{i,m+1}} &= {x_{i,m}}\nonumber\\ &\quad + (k_{i,m}^1+2k_{i,m}^2+2k_{i,m}^3 + k_{i,m}^4)\Delta t/6\end{align}
The periodic loitering pattern flight path is selected as the reference optimisation path. The aircraft should be able to return to the initial flight state after completing one cycle to ensure the repeatability of the flight. According to this condition, the following constraints are obtained:
 \begin{align}V({t_f}) &= V({t_0})\nonumber\\\lambda ({t_f}) &= \lambda ({t_0})\nonumber\\h({t_f}) &= h({t_0})\nonumber\\\psi ({t_f}) &= \psi ({t_0})\nonumber\\x({t_f}) &= x({t_0})\nonumber\\y({t_f}) &= y({t_0})\end{align}
For reasons of flight safety, the aircraft cannot touch the ground or enter the water during the flight, so there are additional height constraints:
 \begin{equation}h - \frac{1}{2}b\left| {\sin (\mu )} \right| \ge {h_{\min }}\end{equation}
Table 2 presents the optimal initial parameter settings.
Optimal initial parameter settings

4.2 Single-cycle simulation
The flight date is nd = 180 in the summer, and the time is  ${t_{mission}}$ = 18:00 for the single-cycle simulation. At this time, energy can still be obtained from solar radiation, but it is insufficient to provide all the energy required for flight. It is thus necessary to obtain additional energy from the wind field through dynamic soaring. The simulation path results are shown in Fig. 14, and the flight speed, heading angle and flight path angle during the flight are shown in Fig. 15. Figure 16 shows the changes in the energy components during the flight.
Simulated flight path.

Changes in flight states and control variables.

Summary of energy changes.

In Fig. 14, the thick solid blue line is the flight trajectory, the dotted blue line is the projection of the flight trajectory on each plane, the dotted green line represents the incident sunlight and the red line represents the normal vector of the main wing plane of the aircraft.
Figure 16 shows that the energy obtained from the wind field is about equal to the solar energy absorbed by the aircraft. At sunset, the aircraft still acquires energy from the sun. While offsetting the energy consumption of the propulsion system and aerodynamic drag, 72.1J of energy is obtained in each circular flight cycle via dynamic soaring. Without the energy from dynamic soaring, the aircraft would lose 320.6J of energy in each circle. The use of dynamic soaring reduces the output energy of the solar power energy system by 32.2%. The total energy budget shows that the combination of solar energy and dynamic soaring provides greater endurance.
4.3 Verification of the all-day closed-loop energy system
4.3.1 72-h flight simulation with a fixed mass
We used the simulation of Section 4.2 and conducted a simulation to optimise the energy acquisition at different times in one day (summer nd = 180) to determine whether the requirements for the all-day closed-loop energy system were met. The results are shown in Fig. 17.
In Fig. 17, the total power output of the small solar UAV using dynamic soaring is Pbat, and the power output without dynamic soaring is Pbat2. The results show that Pneed, which is the energy that the aircraft needs to maintain flight, is the same during the day and night. Solar energy acquisition during the day supports the energy required for flight, whereas, at night, the UAV relies on dynamic soaring to obtain additional energy from the wind field. Otherwise, it will rely entirely on the energy output of the battery to maintain flight. The use of dynamic soaring at night reduces the battery energy expenditure by 6.7%, thereby greatly improving the endurance of the small UAV.
Power variation in the all-day closed-loop energy system.

It can be seen from Fig. 18 that the flight trajectory at each time point follows the overall trend of upwind climb and downwind dive, and according to the different sunlight directions, the flight trajectory deflects to the direction of favourable solar energy acquisition.
Flight trajectories at different times of the day. (a) 6:00 am (b) 9:00 am (c) 3:00 pm (d) 6:00 pm

Assuming that the mass of the power system is 40% of the total mass of the aircraft (5.443kg), i.e., 2.17kg, the battery energy storage is 597Wh. A 72-h flight simulation is conducted, and the results are shown in Fig. 19.
The results show that the energy consumption during dynamic soaring (DS in Fig. 19) is much lower than that without dynamic soaring (no_DS in Fig. 19); the DS curve shows that the use of dynamic soaring meets the requirements for the all-day closed-loop energy system, and 72h of continuous flight is achieved. Without dynamic soaring, the energy reserve would be exhausted after 26h. The slope of the DS curve during the day is greater than that of the no_DS curve, which indicates that dynamic soaring is conducive to daytime energy acquisition.
Energy changes during the 72-h flight simulation.

Simulation results of the solar power energy system

4.3.2 Simulation of the solar power energy system with the minimum mass
The 72-h flight simulations with DS and no_DS are performed to calculate the minimum mass of the solar power energy system that is required to ensure all-day closed-loop energy conditions. The minimum mass required to maintain a closed-loop energy system is shown in Table 3. The energy change of the solar power energy system in 72h starting at 0:00 is shown in Fig. 20.
Energy change results without mass constraints.

Table 3 shows that the total mass of the solar power energy system needed to maintain 72h of uninterrupted flight for the small solar UAV using dynamic soaring (DS) is 0.659kg; this mass is only 7.8% of the mass of the system that does not use dynamic soaring. The minimum mass of the solar power energy system required for the UAV without dynamic soaring (no_DS) is 5.443kg, which is larger than the total mass of the UAV, indicating that this is not a feasible solution. As shown in Fig. 20, the energy of the DS energy system exhibits changes during the 24-h cycle, demonstrating that the system is an all-day closed-loop energy system, and the UAV is able to fly continuously day and night. In contrast, the no_DS system has insufficient energy at night to maintain flight and is not an all-day closed-loop energy system. The simulation results show that dynamic soaring significantly reduces the energy consumption of the small solar UAV, increases its endurance and results in an all-day closed-loop energy system.
4.4 Influence of the wind field
Equation (14) shows that the wind field representative velocity  ${V_R}$ and the wind field power-law exponent p have strong effects on the ability to obtain energy from dynamic soaring. Since dynamic soaring is a key energy source, it is important to assess the effect of the wind field on the energy system. The effects of the wind field are assessed using a 72-h simulation of the solar power energy system with a minimum mass. The results are shown in Fig. 21 and Table 4.
Influence of different values of p on the mass of the energy system

Simulation results showing the influence of different values of p.

The wind field model shows that, the greater the wind field power-law exponent p, the larger the wind gradient. Equation (28) shows that a larger wind gradient allows for more energy extraction from the wind field, resulting in less energy loss at night and faster energy replenishment in the daytime. Therefore, the mass requirement of the system is lower. When p = 1, the aircraft is powered only by the energy obtained from dynamic soaring, and there is no need for a battery to maintain a closed-loop energy system.
As shown in Fig. 22 and Table 5, as the wind field representative velocity V R increases, less battery energy is used at night, and the minimum mass of the energy system decreases. As V R decreases, the minimum mass increases significantly. When V R = 2, the minimum mass exceeds 50% of the total mass of the UAV, which poses a dangerous load on the aircraft, but the minimum mass is still lower than for the system that does not use dynamic soaring.
Influence of different value of V R on the mass of the energy system

Simulation results showing the influence of different values of V R.

In summary, larger p and V R values enable the aircraft to obtain more energy from the wind field by using dynamic soaring and the ability to achieve closed-loop energy conditions.
4.5 Influence of solar conditions
Solar conditions affect the efficiency of energy acquisition. The solar elevation angle and radiation intensity depend on the flight date. The simulation results showing the influence of different flight dates on the minimum mass of the power energy system are shown in Fig. 23 and Table 6.
Influence of different flight dates nd on the mass of the energy system

Simulation results showing the influence of different flight dates nd.

In the winter (nd = 0), the days are short while the nights are long. The efficiency of solar energy acquisition is low, and more battery energy is used; therefore, a heavier battery pack is required to provide energy. In the summer (nd = 180), a lighter battery pack can be used; the battery requirements are similar in the spring and autumn. The results show that stronger solar illumination has energy and load advantages. The slopes of the curves are the same, indicating that the energy obtained from dynamic soaring is the same in all seasons.
5.0 CONCLUSION
We investigated the conditions to achieve a closed-loop energy system in a small solar UAV by exploiting dynamic soaring. The method to maximise the energy acquisition from dynamic soaring and solar radiation during the day and night is analysed. The following conclusions can be drawn:
1. The key factors that influence the ability to achieve a closed-loop energy system in the small solar UAV are the battery weight and the energy capacity. We determined the minimum mass of the energy system that is required to achieve a closed-loop energy system. The flight speed and flight attitude angles have significant effects on the efficiency of energy acquisition.
2. Dynamic soaring enables the UAV to obtain additional energy from the wind field and reduce energy consumption, especially at night. The simulation results show that the use of dynamic soaring reduces the energy consumption of the UAV energy system by 32.3%. The 72-h flight simulation shows that dynamic soaring results in closed-loop energy conditions, and the minimum mass of the energy system is only 6.7% of the mass of a system that does not use dynamic soaring. Dynamic soaring greatly reduces the energy consumption and significantly improves the endurance of the UAV.
3. The influence of the wind field shape and solar conditions on the ability of the UAV to achieve all-day closed-loop energy conditions are investigated to lay a foundation for future research on the combination of dynamic soaring and solar power in small UAVs. A larger wind field intensity index
$p$ and wind velocity ${V_R}$ enable the UAV to obtain more energy from the wind field. The flight date affects the efficiency of the solar energy acquisition and energy consumption at night but has little effect on the ability to obtain energy from dynamic soaring.