INTRODUCTION
Mass administration with the microfilaricidal drug ivermectin (Mectizan) has been a cornerstone for onchocerciasis control for the last two decades, since it was licensed for human use in the late 1980s and donated for as long as necessary to eliminate the burden of onchocerciasis by Merck & Co. (Meredith and Dull, Reference Meredith and Dull1998). In the Onchocerciasis Control Programme in West Africa (OCP), ivermectin was initially used in conjunction with vector control in some areas and as a sole control measure in others (Molyneux and Davies, Reference Molyneux and Davies1997). In the African Programme for Onchocerciasis Control (APOC), operational in those countries not covered by the OCP, and in the Onchocerciasis Elimination Program for the Americas (OEPA), control relies mainly on the long-term and regular treatment of endemic populations with ivermectin (annually in APOC and biannually in OEPA; Richards et al. (Reference Richards, Boatin, Sauerbrey and Sékétéli2001) ), with a few focal vector elimination projects in APOC.
Regular treatment with ivermectin reduces the microfilarial load in the skin of infected individuals. This leads to substantial reductions in morbidity, transmission of the parasite to vectors, and eventually of the force of infection (see Basáñez et al. (Reference Basáñez, Pion, Churcher, Breitling, Little and Boussinesq2006) for a recent review). Within 14 days of treatment, microfilarial loads are typically reduced to 1% of pre-treatment levels (Diallo et al. Reference Diallo, Aziz, Larivière, Diallo, Diop-Mar, N'Dir, Badiane, Py, Schulz-Key and Gaxotte1986).
In addition to a microfilaricidal effect, treatment with ivermectin exerts a so-called embryostatic effect, by which the production of live microfilariae by adult Onchocerca volvulus female worms is inhibited for several weeks and occurs at a reduced rate during subsequent months (Duke, Zea-Flores and Muñoz, Reference Duke, Zea-Flores and Muñoz1991). Basáñez et al. (Reference Basáñez, Pion, Boakes, Filipe, Churcher and Boussinesq2008) have conducted a systematic review and mathematical modelling of meta-analysed data both for the microfilaricidal and embryostatic effects of single-dose ivermectin, and their results agreed with those of Plaisier et al. (Reference Plaisier, Alley, Boatin, Van Oortmarssen, Remme, De Vlas, Bonneux and Habbema1995) who found that about 10–12 months after treatment microfilarial production would have recovered only to ~65–70% of its initial value. However, the question still remains as to whether or not this effect is cumulative, i.e. whether subsequent ivermectin treatments lead to further reductions in microfilarial production (Kläger et al. Reference Kläger, Whitworth, Post, Chavasse and Downham1993). The assumption that rates of microfilarial production are progressively reduced with each treatment round has been central to the predictions, derived from the microsimulation ONCHOSIM model that onchocerciasis can be eliminated from African settings with the sole use of ivermectin as a control measure (Winnen et al. Reference Winnen, Plaisier, Alley, Nagelkerke, van Oortmarssen, Boatin and Habbema2002). Since OEPA is an elimination and not only a morbidity reduction programme, and since treatment is administered twice per year instead of annually in Latin American settings, we set out to investigate the anti-fertility effect of multiple doses of ivermectin administered during a field trial in Central America (Collins et al. Reference Collins, Gonzales-Peralta, Castro, Zea-Flores, Cupp, Richards and Cupp1992). In this trial, the residents of five hyperendemic communities (coffee fincas) in the central onchocerciasis focus of Guatemala received ivermectin every 6 months for 30 months for a total of five treatment rounds.
To estimate rates of microfilarial production we develop a model for the dynamics of expected microfilarial load by way of a model for worm burden during the 30-month study period. The model incorporates both the death of adult worms as well as parasite transmission. To fit the model to data, we adopt a hierarchical Bayesian approach using Markov chain Monte Carlo (McMC) to simulate from the posterior distribution of parameters. This work follows on from that of Plaisier et al. (Reference Plaisier, Alley, Boatin, Van Oortmarssen, Remme, De Vlas, Bonneux and Habbema1995) who examined rates of microfilarial production by fitting a mathematical model to data obtained during a field trial conducted in the Asubende region of Ghana, where five ivermectin treatment rounds were administered annually during a 60-month study period (Alley et al. Reference Alley, Plaisier, Boatin, Dadzie, Remme, Zerbo and Samba1994).
MODELS AND METHODS
Study area and parasitological procedures
We use data on microfilarial loads recorded by Collins et al. (Reference Collins, Gonzales-Peralta, Castro, Zea-Flores, Cupp, Richards and Cupp1992) from three coffee fincas (namely, Los Tarrales, Santa Emilia and Los Andes) located in the vicinity of Lake Atitlán, in the central onchocerciasis focus of Guatemala. The original study comprised five hyperendemic villages (microfilarial prevalence ⩾60%), including also El Vesubio and Santa Isabel. In our analysis, we excluded data from the latter two communities because of the small population size in El Vesubio, and the low compliance to skin-snipping and treatment in Santa Isabel. Also, El Vesubio received placebo during the first three treatments, and ivermectin only during the last two rounds (Collins et al. Reference Collins, Gonzales-Peralta, Castro, Zea-Flores, Cupp, Richards and Cupp1992).
Five ivermectin treatment rounds were administered to the eligible population of these communities at six-month intervals between May 1988 and May 1990. Two skin-snips were taken to measure microfilarial burden immediately prior to each treatment round: one from the left shoulder, and the other from the left iliac crest. A 2·0 mm corneoscleral punch was used to obtain the samples, and they were subsequently incubated for 24 h in physiological saline. Skin-snip processing and weighing, and microfilarial counts were done following the methods of Brandling-Bennett et al. (Reference Brandling-Bennett, Anderson, Fuglsang and Collins1981). On the occasion of each parasitological examination, subcutaneous nodules (onchocercomata) were palpated and recorded on a body chart for each individual. Since at the time of the original study the only accepted form of treatment was excision of detectable nodules, nodulectomy was offered to the participants on a voluntary basis and undertaken by nodulectomy brigades, sometimes weeks or months after skin-snipping and treatment. In fact, after the second treatment round, skin-snipping and ivermectin were disassociated from nodulectomy in order to increase compliance (Collins et al. Reference Collins, Gonzales-Peralta, Castro, Zea-Flores, Cupp, Richards and Cupp1992). We do have nodulectomy data on the subjects that volunteered for the time period of the study but the excised nodules were not analysed for their worm content. Therefore, we lack individual host data on the precise number of adult worms actually removed. However, since it is biologically reasonable to suppose that removal of nodules would cause some degree of excess adult worm mortality, its possible effects were accounted for by assessing the sensitivity of model outputs to variation in the per macrofilaria (adult worm) death rate (see sensitivity analysis section).
On average, treatment coverage of the census population was 67·1% in Los Tarrales, 61·1% in Santa Emilia, and 75·5% in Los Andes. In our analysis we used data only from individuals who received treatment at all five timepoints (N=267 in Los Tarrales, N=119 in Santa Emilia, and N=124 in Los Andes). Further details of the epidemiological, parasitological, and entomological characteristics of these fincas, and of the methods employed during the surveys can be found in Collins et al. (Reference Collins, Gonzales-Peralta, Castro, Zea-Flores, Cupp, Richards and Cupp1992) and Cupp et al. (Reference Cupp, Ochoa, Collins, Cupp, Gonzales-Peralta, Castro and Zea-Flores1992).
A deterministic model of mean worm burden
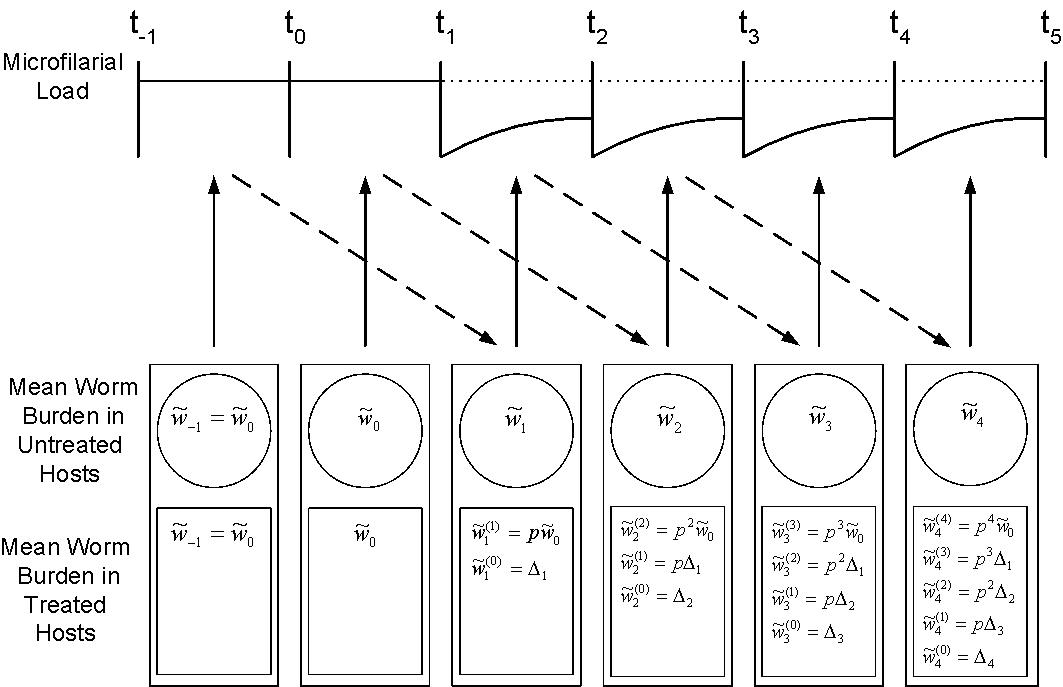
The following deterministic model describes the evolution of mean worm burden in a population of hosts (see Fig. 1).
A model for the evolution of mean worm burden in the host population. The rate of microfilarial production by an adult worm depends on the number of treatments experienced. The mean number of worms having received n treatments is denoted by  j(n) and the average worm burden in untreated hosts is j. Treatments occur at six-month intervals with the first treatment at t 1. The solid and dotted lines represent mean microfilarial loads in treated and untreated hosts respectively. The solid arrows represent the effect of mean worm burden in treated and untreated hosts on mean microfilarial load, and the dashed arrows relate microfilarial load to infection and the establishment of adult worms after a 12 month maturation period. Thus the average number, Δj, of adult worms newly acquired by a host during the interval (t j, t j+1) depends on mean microfilarial load in the host population 12 months previously in the period (t j−2, t j−1).

We model worm burden in discrete time, with time steps every six months. The five treatment times occur at times t 1, …, t 5. Between treatments a proportion, p, of the worms die for reasons unrelated to treatment. In general we suppose that for t in the interval (t j, t j+1) there are on average j(n)(t) adult worms per host that have survived (n) rounds of treatment (n=0, …, j). Here n tracks both the number of treatment rounds and the worm's age in multiples of 6 months. Since treatment occasions correspond to times when microfilaridermia was assessed, the model described below enables observed microfilarial load to be linked to unobserved worm burden, appropriately lagged. Prior to treatment (t<t 1) we set mean worm burden to be constant so that j(0)(t)=0 when j<1 (this assumption is satisfied if the distribution of worm burden is at equilibrium before treatment). After the start of the treatment programme (j⩾1) mean worm burden is modelled using the following difference equation (time-dependence has been omitted to simplify the notation)

where Δj is the average number of adult worms newly acquired per host in (t j, t j+1) that survive to the end of this period, and p is the fraction of established worms that survive the interval between treatments. The parameter Δj depends on microfilarial loads within both the treated and untreated host populations, since microfilariae are transmitted to the simuliid vectors where they develop into stages infective to humans.
Among treated (+) hosts average microfilarial load per mg of skin,  j+(t), is set to zero at treatment time t j, i.e. 100% microfilaricidal efficacy is assumed. Subsequently, for t in (t j, t j+1) the change in average microfilarial load is

where j(n)/2 is the average number of female worms per host (assuming a 1:1 sex ratio according to Schulz-Key and Karam (Reference Schulz-Key and Karam1986) ); ɸ(n) is the rate of microfilarial production per mated female worm after n rounds of treatment, and μm is the per capita death rate of microfilariae. We ignore the impact of human mortality on mean microfilarial load as the study period is short relative to human life-expectancy.
The solution to eqn 2 is,

For untreated (−) hosts we assume that the mean microfilarial load, j−(t) has reached an equilibrium so that for this group,

where j is the average worm burden among untreated hosts. Since the dynamics of mean worm burden is the same in the treated and untreated host populations (assuming no macrofilaricidal effect of ivermectin), we let  .
For the host population as a whole (both treated and untreated hosts) the average microfilarial load during (t j, t j+1) is

where f j is the fraction of hosts treated at the jth treatment. Prior to treatment (j<1) by definition. f j=0. For j⩾1 we use treatment coverages of the total, census populations, as reported in Collins et al. (Reference Collins, Gonzales-Peralta, Castro, Zea-Flores, Cupp, Richards and Cupp1992) for each treatment round and within each community.
Transmission of the parasite between hosts occurs via the bites of blackfly (Diptera: Simuliidae) vectors. In Guatemala, Simulium ochraceum Walker s.l. is the main blackfly species responsible for transmission (Collins, Reference Collins1979). We chose not to model this process explicitly for the purposes of this paper. Instead, we note that the life-expectancy of the vectors and of the larvae within them are short relative to that of microfilariae and adult worms within humans, and assume that transmission between hosts occurs instantaneously. Such an assumption has also been made in other models of filariases transmission (Duerr, Dietz and Eichner, Reference Duerr, Dietz and Eichner2005).
Following infection of humans, the L3 infective larvae mature to become adult worms; this is incorporated into the model through a time delay. In particular, the rate at which worms are newly acquired, encapsulated by the parameter Δj, is assumed to depend on average microfilarial loads in the population of hosts 12 months earlier (Duke, Reference Duke1980) during the period (t j−2, t j−1). (The sensitivity of model outcomes to varying incubation periods of 6, 12, and 18 months was low when explored for an earlier version of the model.) Thus we use the following expression for Δj

where q is the product of the per microfilaria rate of transmission from one human to another human (via the vector) and the probability that an inoculated L3 larva survives the process of maturation within the human host. Note that the rate of human to human transmission itself depends proportionally on the following: (1) the ratio of vectors to humans; (2) the square of the biting rate per fly on humans; (3) the probability of establishment of microfilariae within vectors and of L3 larvae within humans, and (4) the life-expectancy of parasites within surviving vectors. In reality, q is likely to be density-dependent (Collins et al. Reference Collins, Campbell, Wilton and Newton1977; Basáñez et al. Reference Basáñez, Remme, Alley, Bain, Shelley, Medley and Anderson1995, Reference Basáñez, Collins, Porter, Little and Brandling-Bennett2002, Reference Basáñez, Razali, Renz and Kelly2007; Duerr et al. Reference Duerr, Dietz, Schulz-Key, Büttner and Eichner2003), but we ignore this complexity in the modelling approach presented here and expound on its implications in the Discussion. The term  represents the probability that a worm newly acquired at time t survives to t j−1 (μw is the per capita death rate of worms).
Combining eqns 3–6, we obtain

where s=(t j−1−t j−2).
For j<3 eqn 7 simplifies to become

When j<3, we must have that 0=Δj+p 0 since we are assuming that mean worm burden is constant prior to treatment. It therefore follows that  and q=2μmμw/ɸ(0) for j<1.
For j⩾1, the parameter q is unlikely to remain constant since it will almost certainly depend on the level of worm burden and the density of various parasite life-stages. However, we will assume that changes in worm burdens are sufficiently small during the 30-month study period so that we may set q=2μmμw/ɸ(0) for j=1, …, 5.
Expected microfilarial load within an individual host
The model of the previous section can be extended to describe the expected dynamics of worm burden and microfilarial load within individual hosts. (In the context of the analysis presented in this paper the term ‘expectation’ or ‘expected value’ refers to the mean or average value of the random variable in question.) In the following description, the dynamics of mean worm burden and microfilarial load within the host mimic the dynamics of mean worm burden across the population of hosts, except that we allow each host to have a different initial worm burden (w 0). By extending the model to the individual, it can be fitted to individual-level data on microfilarial loads.
Let w j(n)(t) denote the expected number of worms within a host at time t in the interval (t j, t j+1) that have survived (n) rounds of treatment and set w 0(0)=w 0, prior to treatment (t<t 1). Following treatment (j⩾1) we have

where p is the fraction of worms surviving the interval between treatments and Δj is the average number of adult worms newly acquired per host in (t j, t j+1) that survive to the end of this period. The parameter, Δj, is defined by the model for mean worm burden of the previous section.
We use the model of the previous section for the dynamics of mean microfilarial load per mg skin in the host population to describe the expected microfilarial load per mg skin within an individual host, except that we replace the initial mean worm burden (0) with the initial worm burden of the individual (w 0). To obtain the expected microfilarial load of a skin snip sample, we multiply by the combined weight of the two skin-snips that were taken from each individual.
Specifically, for the skin-snip sample taken immediately prior to treatment j at the end of the interval (t j−1, t j) the expected microfilarial load for an individual with initial worm burden w 0 is m j−1+(t j)d j, where d j is the combined weight of the two skin snips and

Observed microfilarial loads
Up to this point the model has been deterministic, i.e. conditional upon an initial worm burden and set of parameters it provides the expected microfilarial load for the skin snip sample. To model observed microfilarial load we introduce a stochastic element which arises from the distribution of microfilariae within a host's skin. For randomly distributed microfilariae, a Poisson distribution would be appropriate. However, it is likely that there is ‘clumping’ of microfilariae in the skin (Kershaw, Duke and Budden, Reference Kershaw, Duke and Budden1954), leading to an excess of zeros in comparison with the Poisson distribution (Grenfell et al. Reference Grenfell, Das, Rajagopalan and Bundy1990; Pion et al. Reference Pion, Filipe, Kamgno, Gardon, Basáñez and Boussinesq2006). We have chosen to model the observed distribution of microfilariae with a zero-inflated Poisson distribution. Mechanistically this distribution may be thought of in terms of selecting a skin-snip sample from a ‘clumped’ versus an ‘unclumped’ area (note that this interpretation is slightly artificial since we have for simplicity combined data from two skin snips). Within ‘clumped’ areas we assume that the distribution of an individual's microfilarial load at time t j is Poisson with probability mass function f(x) and mean d jm j−1+(t j). If the probability of selecting from an ‘unclumped’ area is π, then the probability mass function for observed microfilarial load, x, is π+(1−π) f(x) when x=0 and (1−π)f(x) for x>0.
Model fitting
Estimates were obtained for a restricted set of parameters (Table 1) using a hierarchical Bayesian approach. These include, for each village, the mean worm burden per host prior to treatment and the per female worm rate of microfilarial production per mg of skin after n treatments. For some parameters, estimation was unnecessary since their values were known, i.e. skin-snip weights – recorded for each individual, and fraction of hosts treated at each round and village – given in Table 1 of Collins et al. (Reference Collins, Gonzales-Peralta, Castro, Zea-Flores, Cupp, Richards and Cupp1992). It was necessary to fix other parameters to improve the identifiability of the model, i.e. to estimate the parameters from the data with acceptable precision (Huang, Reference Huang, Everitt and Howell2005). Fixed parameters were: the death rates of microfilariae and of adult worms, and pre-treatment rate of microfilarial production by female worms – taken from Table 2 of Basáñez and Boussinesq (Reference Basáñez and Boussinesq1999). The parameters for pre-treatment worm distribution and the zero-inflation parameter, π, of the microfilarial distribution were also estimated for each village.
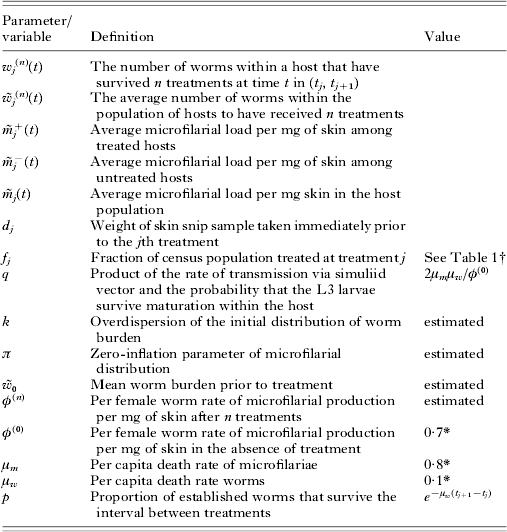
Parameter/variable definitions

All rates are per year. Data source
* Basáñez and Boussinesq (Reference Basáñez and Boussinesq1999) † Collins et al. (Reference Collins, Gonzales-Peralta, Castro, Zea-Flores, Cupp, Richards and Cupp1992).
All variables are indexed by treatment number j. Variables w j(n)(t), j(n)(t), j+(t), j−(t), j(t) are functions of time t.
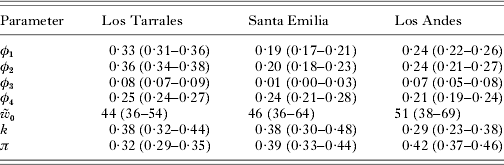
Parameter estimates with 95% Bayesian credible intervals

The hierarchical Bayesian approach involved estimating parameters associated with the distribution of initial worm burdens. Specifically, we assumed that the initial worm burdens, w0, are independent draws from a negative binomial distribution with parameters 0 and k representing respectively the mean and degree of overdispersion.
To ensure positive estimates of ɸ(n), 0, and k these parameters were log-transformed, while π was logit-transformed since it is constrained to be between 0 and 1. The set of transformed parameters, λ, is

It is convenient to form two groups of parameters λm=(λ1, …, λ5) and λw=(λ6, λ7); the former are parameters associated with the distribution of microfilarial burden, whereas the latter are parameters that specify the distribution of initial worm burden in individuals who took all five treatments.
Given the initial worm burdens, w0, and parameters λm, the likelihood of the observed microfilarial loads, x, is defined by the zero-inflated Poisson distribution described in the previous section.
The posterior distribution for the transformed parameters can be expressed in terms of this likelihood p(x|λm,w0), the distribution of initial worm burdens p(w0|λw), and the prior p(λ). Up to a constant of proportionality the posterior distribution is

We used a prior for p(λ) in which the transformed parameters were assigned independent normal priors each with standard deviation of 100; for parameters λ1−λ4 the mean of the prior was log (0·7), and for parameters λ5, λ6 and λ7 the means were respectively logit (0·5), log (50) and log (1). To sample from the posterior distribution we used the McMC algorithm described below. The model parameters, definitions, and sources are listed in Table 1.
McMC algorithm
Draws were obtained from the posterior distribution using the Gibbs sampler. The Gibbs algorithm works by iteratively sampling from the distribution of each parameter, conditional on the data and on the remaining parameters being fixed at their current values (Gelman et al. Reference Gelman, Carlin, Stern and Rubin2004). Specifically, samples were drawn from p(w0|λ, x) and then from p(λi|λ−i, w0, x), (i=1, …, 7) where λi is the ith parameter and λ−i is the parameter vector, λ, excluding the ith parameter.
The conditional distributions p(w0|λ, x) and p(λi|λ−i, w0, x) are known up to a constant of proportionality from eqn 10. Samples were obtained from p(w0|λ, x) using the Adaptive Rejection Metropolis Sampling (ARMS) algorithm (Gilks, Best and Tan, Reference Gilks, Best and Tan1995), and from p(λi|λ−i, w0, x) using the Metropolis algorithm (Metropolis et al. Reference Metropolis, Rosenbluth, Rosenbluth, Teller and Teller1953).
The McMC algorithm was programmed using the R programming language (http://www.r-project.org), and the ARMS algorithm was implemented using the arms function from the HI library. The algorithm used in arms gives real-valued samples, not integers. To sample from the conditional distribution of initial worm burden p(w0|λ, x), the output of the arms algorithm was rounded and used as the proposal distribution in a final Metropolis step.
The model was fitted separately to data from each of the three villages. Three sets of simulations (chains) were produced for each village. We used microfilarial load at treatment 1 multiplied by 2μm/(ɸ(0)d 1) (see eqn 9) as starting values for the initial worm burden (w 0) in all three chains. For the remaining parameters different starting values were chosen for each of the three chains. The starting values were ‘overdispersed’, i.e. they were selected to be outside the simulated posterior distributions. Each chain was run for 2000 iterations. The three sequences appeared to have converged after 1000 iterations. We treated the first half of each chain as ‘burn-in’ and used the second half of each chain to provide a sample of 3000 on which inference was based.
Sensitivity analysis
Sensitivity or uncertainty analysis permits exploration of how model outcomes are affected by changes in structural assumptions (biological hypotheses and their mathematical formulation) or changes in parameter values (Haefner, Reference Haefner1996). To explore the sensitivity of the results to changes in the parameter value chosen for ɸ(0) (the pre-treatment rate of microfilarial production) we used the endpoints of the range given in Table 2 of Basáñez and Boussinesq (Reference Basáñez and Boussinesq1999) (i.e. ɸ(0)=0·54 and 0·79 yr−1 female−1 mg of skin−1). In addition the potential impact of nodulectomy on the results was assessed, albeit approximately, by performing a sensitivity analysis in which the death rate of worms post treatment was increased to μw=0·2 yr−1 (compared to a pre-treatment value of 0·1 yr−1).
RESULTS
Table 2 presents the estimates for the average rates of microfilarial production corresponding to the 6-month period following each treatment round; the estimated mean adult worm burden at baseline in those individuals that took all five treatments; the overdispersion parameter for the initial distribution of adult worms among hosts, and the zero-inflation parameter for the distribution of microfilarial loads. Each parameter estimate is presented with its associated 95% Bayesian credible interval. Excluding the values for treatment 3, the values for the average rate of microfilarial production 6 months after the previous treatment varied between 0·19 (Santa Emilia, treatment 1) and 0·36 (Los Tarrales, treatment 2), averaging 0·25 microfilariae per mg of skin, per female worm per year. This represents a reduction of 64% from the initial value of 0·7 presented by Basáñez and Boussinesq (Reference Basáñez and Boussinesq1999). The values corresponding to the third treatment are very low across the three villages but do not indicate a systematic downward trend. The values of the mean initial worm burden per host and overdispersion parameter among hosts are similar for all three villages averaging to 47 (mean) and 0·35 (overdispersion).
Estimates of the relative change in microfilarial production are robust to changes in the value of ɸ(0). For both ɸ(0)=0·54 and ɸ(0)=0·79 microfilariae per female worm per year and per mg of skin, the estimated rate of microfilarial production is 37% of the pre-treatment value (compared to 36% in the original simulation where ɸ(0)=0·7). By contrast, increasing the death rate of adult worms post treatment appeared to increase estimates of microfilarial production. Setting μw=0·2 after treatment (pre-treatment μw=0·1 per year) the estimate of production increased to 42% of the pre-treatment value (i.e. an overall reduction of 58% compared with 64% for the nominal value). This agrees with intuition, which suggests that for the same observed microfilaridermia the per worm microfilarial production must be higher if there are fewer adult worms as a result of nodulectomy (life-expectancy reduced from 10 years to 5 years).
DISCUSSION
Our results (Table 2) show a substantial reduction in the rate of microfilarial production during the six months after the first treatment. On average, the per capita rate of microfilarial production (scaled per mg of skin) was reduced to ~36% of its pre-treatment (nominal) value of 0·7 microfilariae per female per year. (This pre-treatment value had been estimated by Basáñez and Boussinesq (Reference Basáñez and Boussinesq1999) by combining rates of microfilarial release by adult worms maintained in vitro (Engelbrecht and Schulz-Key, Reference Engelbrecht and Schulz-Key1984) with in vivo estimates presented by Duke (Reference Duke1993).) However, we did not find, unlike Plaisier et al. (Reference Plaisier, Alley, Boatin, Van Oortmarssen, Remme, De Vlas, Bonneux and Habbema1995), that subsequent treatments reduced cumulatively the rate of microfilarial production by O. volvulus.
Estimates of microfilarial production were similarly reduced for the six-month periods following treatments 2 and 4, but were significantly lower for the six months after treatment 3. This pattern was consistent across the 3 communities. A reduction in microfilarial loads at treatment 3 followed by an increase at treatment 4 had been observed by Collins et al. (Reference Collins, Gonzales-Peralta, Castro, Zea-Flores, Cupp, Richards and Cupp1992) The low rate of microfilarial production following treatment 3 is difficult to explain biologically since it does not appear to be part of a systematic downward trend. A possibility is that this result may simply reflect a change in the way the sample was collected or analysed at this treatment time. Other explanations include the possible effects of nodulectomy on worm burden, and the observation that during the trial transmission of L3 by S. ochraceum s.l. was substantially reduced (Cupp et al. Reference Cupp, Ochoa, Collins, Cupp, Gonzales-Peralta, Castro and Zea-Flores1992). The latter effect, however, is likely to be small since the reduction in transmission due to treatment is incorporated into the model; furthermore even with complete interruption of transmission, the adult worm population would only decline by approximately 5% per six months (assuming an average life-expectancy of 10 years for adult worms as in Basáñez and Boussinesq (Reference Basáñez and Boussinesq1999) and Plaisier et al. (Reference Plaisier, van Oortmarssen, Remme and Habbema1991) ). A reduced worm life-expectancy, due to nodulectomy may be responsible for a larger reduction in the size of the worm population between treatment 2 and treatment 3. Furthermore, this reduction in the size of the worm population may cause a decline in mating probability and insemination rates which will in turn further reduce observed microfilarial loads. However, this does not explain the recovery of microfilarial production at treatment 4, unless this is itself an anomalous result.
The estimated average reduction in microfilarial production 6 months after ivermectin treatment is consistent with the results of other studies on the evolution of microfilarial load following treatment. In a study of 5 yearly treatments in Asubende, Ghana, Plaisier et al. (Reference Plaisier, Alley, Boatin, Van Oortmarssen, Remme, De Vlas, Bonneux and Habbema1995) fitted a model to the data in which female worms ceased producing microfilariae immediately after treatment, and then gradually recovered microfilarial production with time post-ivermectin. They estimated that microfilarial production had reached a value of approximately 68% of the pre-treatment level 10 months after treatment. This corresponds to an average rate of microfilarial production during the first six months of 20% of the pre-treatment value assuming microfilarial production increases linearly during this period.
Duke et al. (Reference Duke, Zea-Flores and Muñoz1991) found in a longitudinal study of reproductive activity by O. volvulus after ivermectin treatment in Guatemala, that 6 months post-treatment only 17 out of 53 live females (32%, 95% CI=0·20, 0·45) were releasing live microfilariae. This finding is less easy to compare to our result although the two may be consistent if ivermectin eliminates microfilarial production in a proportion of worms and has little or no effect in the remaining worms, as proposed by Plaisier et al. (Reference Plaisier, Alley, Boatin, Van Oortmarssen, Remme, De Vlas, Bonneux and Habbema1995).
Further comparisons are possible by using the model to predict microfilarial loads post treatment. For a static worm population whose rate of microfilarial production remains at 36% of the pre-treatment level during the period 6–12 months following treatment, the expected microfilarial load at 12 months is predicted to be 20% of the pre-treatment load (from eqns 3 and 4). This figure is in agreement with the findings of a recent meta-analysis and mathematical model by Basáñez et al. (Reference Basáñez, Pion, Boakes, Filipe, Churcher and Boussinesq2008), in which average microfilarial loads are ~20% of their pre-treatment levels one year after single-dose ivermectin.
Mean baseline microfilarial load was similar across the villages (Los Tarrales: 27·0 microfilariae per mg; Santa Emilia: 23·5 microfilariae per mg, and Los Andes: 18·6 microfilariae per mg). This is reflected in similar estimates of worm burden among the three villages, averaging 47 worms per person. Basáñez et al. (Reference Basáñez, Collins, Porter, Little and Brandling-Bennett2002) analyzed data on microfilarial loads collected by Brandling-Bennett et al. (Reference Brandling-Bennett, Anderson, Fuglsang and Collins1981), approximately 10 years earlier than the data used in this study. They found a higher microfilarial load per mg of skin in Santa Emilia (64·3), but similar loads in Los Tarrales (18·2) and Los Andes (28·9). This lends support to the hypothesis of endemic equilibrium prior to treatment, particularly in the latter two villages. Although it appears less plausible that Santa Emilia may have been at endemic equilibrium pre-ivermectin, this may not significantly affect our results. This is because the analysis undertaken requires only that mean worm burden should be approximately constant for the 12 months preceding the introduction of chemotherapy (the assumed length of the maturation period from L3 to adult worm used here). The assumption may be reasonable even if the system is not at endemic equilibrium, since it is unlikely that adult worm numbers would have changed considerably within a 12-month period. Also, mean microfilaridermia at the two timepoints may not be strictly equivalent, as the data published in 1981 and analysed by Basáñez et al. (Reference Basáñez, Collins, Porter, Little and Brandling-Bennett2002) referred to all the population examined whereas the data published in 1992 and analysed in this paper refers to the subset of the population who adhered to all 5 treatment rounds.
In this study we lacked data on the numbers of worms removed by nodulectomy from each participant at each treatment for the reasons mentioned above; we can therefore not exclude the possibility that in addition to ivermectin effects, some of the measured reduction in microfilarial load may be due to nodulectomy (via increased worm mortality). However, the sensitivity analysis shows that even a doubling in the rate of worm mortality post ivermectin has only a modest effect on the estimate of worm fertility. It is also reassuring that the estimated effects are in agreement with those measured in other studies not confounded by excision of onchocercomata (Plaisier et al. Reference Plaisier, Alley, Boatin, Van Oortmarssen, Remme, De Vlas, Bonneux and Habbema1995; Basáñez et al. Reference Basáñez, Pion, Boakes, Filipe, Churcher and Boussinesq2008). In addition to eliminating a potential source of bias, nodulectomy data would also provide a means of validating the estimates of mean worm burden using the relationship between numbers of adult worms and excisable (palpable) onchocercomata developed by Duerr et al. (Reference Duerr, Dietz, Buttner and Schulz-Key2001). According to their model we would expect an average of approximately 10 palpable nodules per person.
Concluding remarks and future directions
One of the strengths of these data is that they may be used to estimate the effect of successive treatments on microfilarial production by the adult female worms. This is important in order to further our understanding of the long-term impact of ivermectin-based onchocerciasis control programmes. Our estimates suggest that the production of microfilariae is not cumulatively reduced by successive ivermectin treatments over the 30-month study period. However, this does not rule out the possibility that longer-term, multiple ivermectin treatments may lead to a decline in the rate of microfilarial production by the adult worms, or to other changes in the reproductive biology of the parasite such as female-biased (intra-nodular) sex ratios, decreased mating probabilities and insemination rates, and increased macrofilaricidal effects (equivalent to irreversible sterilisation of adult worms) (Duke et al. Reference Duke, Zea-Flores and Muñoz1991; Gardon et al. Reference Gardon, Boussinesq, Kamgno, Gardon-Wendel, Demanga-Ngangue and Duke2002; Cupp et al. Reference Cupp, Duke, Mackenzie, Guzmán, Vieira, Mendez-Galván, Castro, Richards, Sauerbrey, Dominguez, Eversole and Cupp2004; Cupp and Cupp, Reference Cupp and Cupp2005).
The only other model that has been fitted to time-dependent microfilarial data from multiple regular treatments is that of Plaisier et al. (Reference Plaisier, Alley, Boatin, Van Oortmarssen, Remme, De Vlas, Bonneux and Habbema1995). Although their modelling approach is different from ours, and the frequency of treatment in Asubende, Ghana (Alley et al. Reference Alley, Plaisier, Boatin, Dadzie, Remme, Zerbo and Samba1994) was annual rather than 6-monthly as in Guatemala, the results of both studies are compatible and also comparable to those obtained by Basáñez et al. (Reference Basáñez, Pion, Boakes, Filipe, Churcher and Boussinesq2008), who modelled the effect of a single ivermectin dose. However, Plaisier et al. (Reference Plaisier, Alley, Boatin, Van Oortmarssen, Remme, De Vlas, Bonneux and Habbema1995) found that a progressive reduction of microfilarial production with each dose would be the scenario most consistent with the data. It would be very interesting to reanalyse such data with the modelling approach presented here, as projections of onchocerciasis elimination assume operation of such cumulative effects (Winnen et al. Reference Winnen, Plaisier, Alley, Nagelkerke, van Oortmarssen, Boatin and Habbema2002).
In order to extend our model beyond the 30-month study period with the aim to investigate the probability of onchocerciasis elimination, we would also have to acknowledge that q (the per microfilaria rate of success in becoming an established worm) is likely to be strongly nonlinear, as density dependence has been identified to operate upon microfilarial uptake and survival, parasite establishment, vector and human survival, and the biting rate per fly on humans (Basáñez et al. Reference Basáñez, Remme, Alley, Bain, Shelley, Medley and Anderson1995, Reference Basáñez, Townson, Williams, Frontado, Villamizar and Anderson1996, Reference Basáñez, Collins, Porter, Little and Brandling-Bennett2002, Reference Basáñez, Razali, Renz and Kelly2007; Duerr et al. Reference Duerr, Dietz, Schulz-Key, Büttner and Eichner2003; Little et al. Reference Little, Breitling, Basáñez, Alley and Boatin2004).
In conclusion, our ability to project the long-term impact of ivermectin on transmission and the possibility of infection elimination with microfilaricidal chemotherapy alone depends on improving our understanding of the effects of repeated treatment on the population biology of O. volvulus. Modelling analyses of further time-series of microfilarial loads and/or of the reproductive and viability status of adult parasites obtained from repeatedly treated patients (such as the data presented by Gardon et al. (Reference Gardon, Boussinesq, Kamgno, Gardon-Wendel, Demanga-Ngangue and Duke2002) ) will be required to clarify the effect of long-term ivermectin treatment, and any changes in treatment efficacy (Osei-Atweneboana et al. Reference Osei-Atweneboana, Eng, Boakye, Gyapong and Prichard2007) that may result from chemotherapy-induced selection pressure acting upon the parasites genome (Bourguinat et al. Reference Bourguinat, Pion, Kamgno, Gardon, Duke, Boussinesq and Prichard2007, Reference Bourguinat, Ardelli, Pion, Kamgno, Gardon, Duke, Boussinesq and Prichard2008).
The data analysed in this paper were collected during a study funded by the UNDP/World Bank/WHO Special Program for Research and Training in Tropical Disease (project ID870340) conducted in Guatemala between 1988 and 1990. CB would like to thank the Department of Statistical Science at University College London for financial support provided during the preparation of this paper. M-GB acknowledges the Medical Research Council, UK for a Career Establishment Grant.