Introduction
Graphene with a unique two-dimensional hexagonal lattice structure has attracted a lot of attention owing to its high specific surface area, outstanding electronic conductivity, and remarkable mechanical as well as chemical stability, and these superior features render it one of the most fascinating materials in the field of energy storage and conversion, including supercapacitor, battery, and electrocatalysis [Reference Bonaccorso, Colombo, Yu, Stoller, Tozzini, Ferrari, Ruoff and Pellegrini1, Reference Meng, Lu, Li, Byun, Oh and Chou2, Reference Zhou, Qiao, Yang and Zhang3]. Regular synthesis of graphene mainly comprises bottom-up and top-down approaches. Typical bottom-up methods, such as chemical vapor deposition (CVD), often adopt expensive facilities. The relevant synthetic process appears much complicated and time-consuming, and the yield proves very limited. By contrast, the preparation of graphene by a top-down way turns out to be more facile and low cost, and the production can reach a large-scale level, attracting much more attention. Classical Hummers’ method as one representative top-down way has been widely used to produce graphene for massive application [Reference Voiry, Yang, Kupferberg, Fullon, Lee, Jeong, Shin and Chhowalla4, Reference Sadeghinezhad, Mehrali, Saidur, Mehrali, Latibari, Akhiani and Metselaar5]. In general, graphene oxide (GO) is first fabricated by drastically oxidizing natural graphite, and then reduced to graphene. Compared to pure graphene manufactured by CVD, GO with abundant oxygen-containing groups appears more favorable to receive subsequent modification (including heteroatoms doping, organic groups grafting, and metal-based compound hybridizing), which markedly broadens the application of graphene [Reference Hummers and Offeman6, Reference Dou, Tao, Huo, Wang and Dai7, Reference Wang, Wang, Wang, Dou, Ma, Wu, Tao, Shen, Ouyang, Liu and Wang8, Reference Chen, Zhou, Wei, Chen, Huang, Huang, Zhang and Kuang9].
Recently, a large number of researches have reported that doping heteroatoms (N, B, S, etc.) into carbon skeleton can adjust the energy band and electronic structure of carbon materials; the obtained heteroatom-doped carbon always displays enhanced conductivity and reactive activity [Reference Wang and Su10, Reference Chen, Feng, Zhou, Fu, Wang, Yang, Xu, Chen, Yang and Kuang11, Reference Yan, Li, Huo, Chen, Dai and Wang12, Reference Xia, Fang, Xiao, Huang, Gan, Yang, Lu, Liang, Zhang, Tao and Zhang13, Reference Li, Zhou, Yang, Chen, Huang, Zhang, Fu and Kuang14]. Liu et al. reported the synthesis of N-doped graphene (NG) and found that N doping not only improved the conductivity, reactive activity, and accessibility to electrolyte but also provided pseudocapacitance by reversible redox reaction, thus significantly elevating the capacitive performance [Reference Liu, Fu, Zhang, Zhou and Kuang15, Reference Liu, Fu, Zhang, Li, Zhou and Kuang16]. Dai et al. prepared vertically aligned N-doped carbon nanotube arrays (VA-NCNT) as electrocatalyst for oxygen reduction reaction (ORR) and confirmed the positive role of N doping in boosting the activity toward ORR [Reference Gong, Du, Xia, Durstock and Dai17]. Meanwhile, Dai et al. uncovered the possible N-doping mechanism of NG, i.e., the oxygen-containing groups in GO functioning as reactive sites reacted with ammonia decomposed from N-rich sources, and then realized N doping [Reference Li, Wang, Robinson, Sanchez, Diankov and Dai18].
Despite much process achieved in the aspect of doping heteroatoms into graphene, there is still lack of valid strategies to controllably prepare heteroatom-doped graphene-based materials. It is widely acknowledged that different doping pathways produce distinct heteroatom-doped graphene-based materials, and the electrochemical performance of the obtained heteroatom-doped graphene-based materials mostly relies on their morphology, structure, composition, and conductivity [Reference Higgins, Zamani, Yu and Chen19, Reference Wang, Maiyalagan and Wang20]. Typical three-dimensional (3D) porous architecture, large specific surface area, enriched structural defects, optimized heteroatom configurations, and high conductivity have already been demonstrated to devote positively to promoting related electrochemical performance, especially in the field of energy conversion and electrocatalysis. Specifically, 3D porous architecture facilitates electrolyte infiltration and reactants/products diffusion [Reference Su, Zhang, Zhuang, Li, Wu, Zhang and Feng21, Reference Wu, Winter, Chen, Sun, Turchanin, Feng and Müllen22], whereas high conductivity promises fast electron transport inside the carbon framework. Meanwhile, large specific surface area offers sufficient exposed sites for ion adsorption/desorption and electrochemical reaction [Reference Wu, Sun, Tan, Yang, Feng and Mullen23, Reference Chen, Chen, Huang, Huang, Wang, Li, Zhou and Kuang24, Reference Yang, Chen, Cui, Luo, Liang, Yang, Liu, Wang and Luo25], whereas enriched structural defects further strengthen the interaction between carbon and ions, and reactive activity [Reference Zhou, Paek, Hwang and Manthiram26]. Besides, optimized heteroatom configurations are capable of targetedly adjusting the physicochemical property of heteroatom-doped graphene. For instance, graphitic N helps for improving the conductivity, whereas pyridinic N proves in favor of elevating the wettability and adsorbability for oxygen and water [Reference Maiti, Lee, Lee, Oh, Kim, Kim, Shim, Han and Kim27, Reference Chen, Higgins, Yu, Zhang and Zhang28, Reference Huang, Liao, Yang, Zhou, Fu, Gong, Chen and Kuang29].
Until now, hydrothermal method and thermal annealing have been widely accepted as two representative postdoping pathways. Most previous works about heteroatom-doped graphene-based materials mainly focus on the selection of heteroatom sources or the regulation of doping crafts (including reactants concentration, reaction temperature, and reaction time) [Reference Sheng, Shao, Chen, Bao, Wang and Xia30, Reference Lin, Waller, Liu, Liu and Wong31]; only few reports the influence of doping pathways on the preparation and electrochemical properties of heteroatom-doped graphene-based materials [Reference Zheng, Wang, Wang and Xia32].
Given the synergistic effect of different heteroatoms doped into carbon skeleton [Reference Su, Zhang, Zhuang, Li, Wu, Zhang and Feng21, Reference Liang, Jiao, Jaroniec and Qiao33], in this work, for the first time, ammonium sulfide was used as N and S sources, and a facile two-step doping pathway, that is hydrothermal method followed by thermal annealing process, was conducted on GO to synthesize annealed 3D N,S-codoped graphene framework (A-NSG). For comparison, direct hydrothermal method was carried out to prepare 3D N,S-codoped graphene framework (NSG) and pure graphene (G) with and without the addition of ammonium sulfide. The morphology, structure, composition, and conductivity of these graphene-based materials were all systematically investigated. In the meantime, the capacitance and ORR behaviors of them were also detected. The results showed that A-NSG possessed typical 3D mesoporous thin nanosheets, much increased specific surface area, as well as structural defects, strengthened conductivity, and optimized N and S configurations (especially for dominated pyridinic N as well as graphitic N and –C–S–C–). As a consequence, the as-prepared A-NSG presented much better capacitance and ORR performance than NSG and G. Clearly, our work not only provides a promising electrode material for supercapacitors and ORR but also offers a novel and facile two-step doping strategy for the synthesis of advanced heteroatom-doped carbon materials. In addition, the specific influence of annealing temperature on the preparation of heteroatom-doped carbon materials will further be explored in depth.
Results and discussion
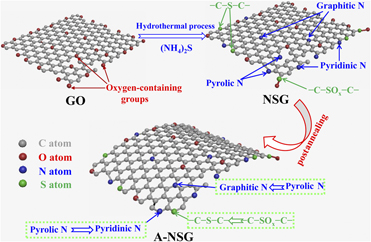
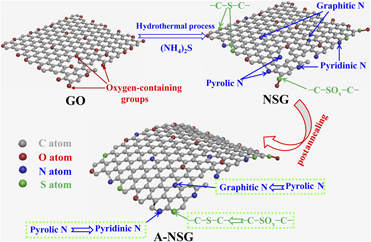
Figure 1 shows the typical two-step synthesis of A-NSG. First, 3D NSG was synthesized via hydrothermal method followed by freeze-drying process using GO and ammonium sulfide as precursors. After being thermal annealed at 750 °C for one hour under nitrogen atmosphere, 3D A-NSG framework was successfully fabricated. The obtained 3D A-NSG framework was featured with typical 3D mesoporous thin nanosheets, much increased specific surface area, as well as structural defects, strengthened conductivity, and optimized N and S configurations, thus leading to remarkably enhanced capacitance and ORR performance.
Typical schematic diagram of the synthesis of A-NSG.

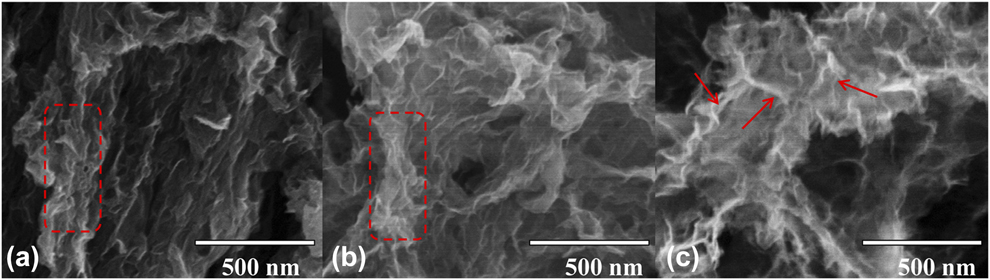
To study the effect of the two-step doping pathway on the morphology, structure, composition, and conductivity of A-NSG, the scanning electron microscope (SEM), BET, X-ray diffraction (XRD), Raman spectroscopy, X-ray photoelectron spectroscopy (XPS), and four-probe techniques are all employed. Figure 2 shows the SEM images of G, NSG, and A-NSG. Apparently, all of these samples displayed typical 3D porous shape, which was due to the coeffect of hydrothermal assembly and subsequent freeze-drying [Reference Zhou, Paek, Hwang and Manthiram26, Reference Lu, Chen, Wu, Wang and Li34]. Similar to G, NSG showed loose interconnected nanosheets, and part of them agglomerated to some extent, as seen in the red dashed region in Figs. 2(a) and 2(b). The formation of these reunited nanosheets mostly resulted from the strong π–π interaction. By contrast, A-NSG exhibited highly crumpled thin nanosheets (see the red arrow areas), which might be attributable to the subsequent thermal annealing that induced the distortion of nanosheets, therefore effectively alleviating the agglomeration of A-NSG.
SEM images of G (a), NSG (b), and A-NSG (c).
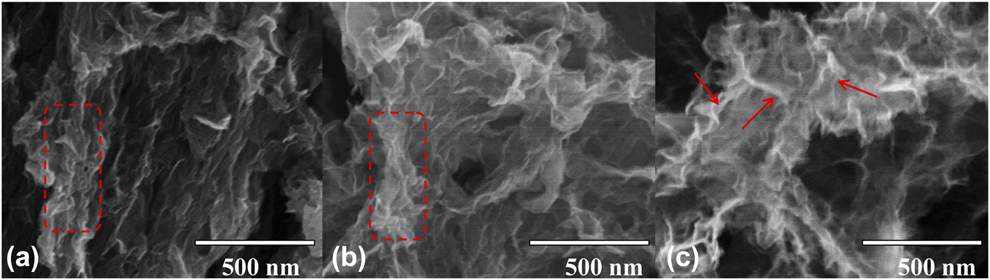
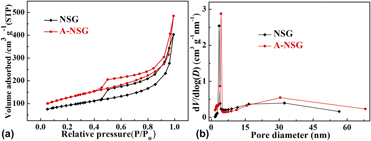
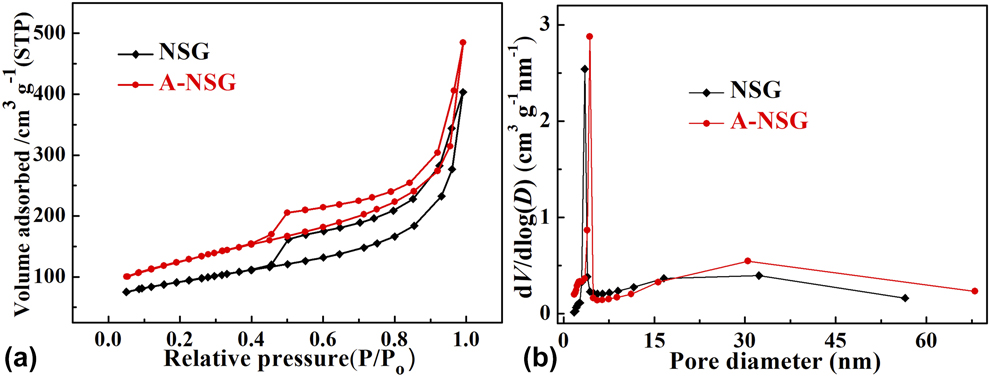
Figure 3(a) presents the nitrogen adsorption/desorption isotherms of NSG and A-NSG. It was clear that both of them belonged to type IV isotherms featured with typical capillary condensation step, indicating mesoporous characteristics [Reference He, Li, Chen, Chen, Jing, Zhou, Zhou, Zeng and Hou35, Reference Chen, Zhou, Fu, Chen, Xu and Kuang36]. The specific BET results are provided in Table SI. It was found that the specific surface area of A-NSG (431 m2/g) was remarkably larger than that of NSG (312 m2/g), and the pore volume of A-NSG (0.77 cm3/g) was also larger than that of NSG (0.63 m3/g). The increased specific surface area and pore volume for A-NSG were mostly related to the subsequent thermal annealing that suppressed the agglomeration of graphene nanosheets in some degree, which was accorded with the SEM result [Reference Wen, Wang, Mao, Bo, Kim, Cui, Lu, Feng and Chen37]. Figure 3(b) gives the pore size distribution curves of NSG and A-NSG. Two typical peaks located at ∼4 and ∼31 nm could be apparently observed, again demonstrating the formation of mesopores. In addition, the peak at 3.5 nm for NAG shifted positively to 4.3 nm for A-NSG, which was due to the increased nanosheets gap caused by thermal distortion.
Nitrogen adsorption/desorption isotherms (a) and pore size distribution curves (b) of NSG and A-NSG.
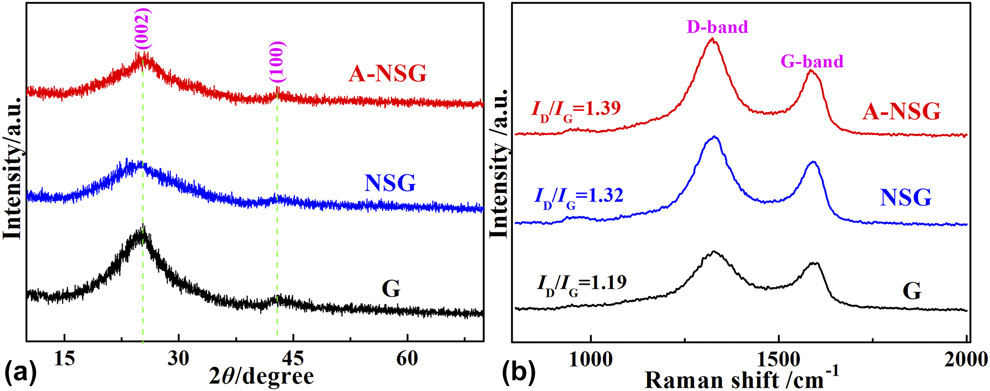
In order to investigate the effect of two-step doping pathway on the structure of 3D A-NSG, the XRD and Raman spectra of G, NSG, and A-NSG are all measured. Figure 4(a) exhibits the XRD patterns of them. Different from the XRD pattern of GO [Reference Liu, Fu, Zhang, Li, Zhou and Kuang16, Reference Chen, Zhu, Wu, Han and Wang38], all these patterns showed typical graphite (002) and (100) peaks emerging at ∼26° and ∼42°, respectively, suggesting effective reduction of GO during hydrothermal process. Meanwhile, it was found that the peak intensity and position for these samples differed from each other. The (002) peak for NSG and A-NSG appeared much broader than that for G, indicating decreased graphitization degree, which was illustrated for the presence of intercalated “N and S defects” [Reference Zhou, Paek, Hwang and Manthiram26, Reference Qu, Liu, Baek and Dai39]. Additionally, the (002) peak shifted negatively from 25.52° for G to 25.16° for NSG, meaning increased d 002 spacing. The increased interplanar spacing was mainly ascribed to the effect of foreign N and S codoping [Reference Zhou, Paek, Hwang and Manthiram26]. With regard to A-NSG, the (002) peak intensity became a bit stronger and moved slightly to a higher angle (2θ = 25.44°), showing newly generated graphitic carbon domains and declined d 002 spacing. This result was attributed to the subsequent thermal annealing that got rid of much residual oxygen-containing groups and unstable N or S species existing in NSG [Reference Li, Fan, Zheng and Dong40, Reference Zhao, Sun, Jin, Wang, Yan, Chen, Zhu and Yao41, Reference Li, Jia, Chang, Chen, Liu, Wang, Hu, Xia, Yang and Yao42], demonstrated by the XPS result (vide infra). Figure 4(b) shows the Raman spectra. Two characteristic peaks positioned at ∼1350 and ∼1580 cm−1, corresponding to the D band and G band of carbon samples, could be clearly observed. In general, the intensity rate of the D band to G band (I D/I G) reflects carbon defect nature [Reference Chen, Chen, Huang, Wang, Zhou and Kuang43]. Compared with G (I D/I G = 1.19), the I D/I G value for NSG increased to 1.32. In the meantime, the G band shifted negatively from 1591 cm−1 for G to 1584 cm−1 for NSG, verifying successful N and S doping. These results were consistent with those reported previously [Reference Jeong, Lee, Shin, Choi, Shin, Kang and Choi44, Reference Chen, Chen, Kuang, Xu, Yang, Zhou, He, Jing, Li, Li, Chen and Hou45]. As for A-NSG, this value further increased to 1.39, implying much more structural defects induced by subsequent thermal annealing. These produced structural defects possibly existing in the form of active divacancy can not only function as reactive sites toward ORR but also strengthen the interaction between carbon surface and ions, thus elevating the capacitance [Reference Yan, Li, Huo, Chen, Dai and Wang12, Reference Zhao, Sun, Jin, Wang, Yan, Chen, Zhu and Yao41].
XRD patterns (a) and Raman spectra (b) of G, NSG, and A-NSG.

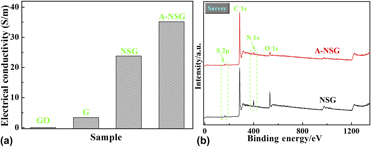
Figure 5(a) displays the four-probe test result of A-NSG. For comparison, the conductivity of GO, G, and NSG is also measured. After hydrothermal reduction, the conductivity of GO (0.41 S/m) rapidly soared to 3.4 S/m for G, manifesting much removal of oxygen-containing groups and effective restored graphitic carbon domains. As for NSG, the conductivity further enlarged to 23.8 S/m, which was explained for the introduction of ammonium sulfide, enhancing the reduction degree of GO. This promoted conductivity was also indicative of successful N and S doping [Reference Chen, Feng, Zhou, Fu, Wang, Yang, Xu, Chen, Yang and Kuang11, Reference Zhou, Paek, Hwang and Manthiram26]. Suffering from postthermal annealing, the obtained A-NSG exhibited elevated conductivity of 35.2 S/m, which was due to the increased graphitic carbon domains caused by thermal annealing.
(a) Electrical conductivity of GO, G, NSG, and A-NSG; (b) XPS survey spectra of NSG and A-NSG.
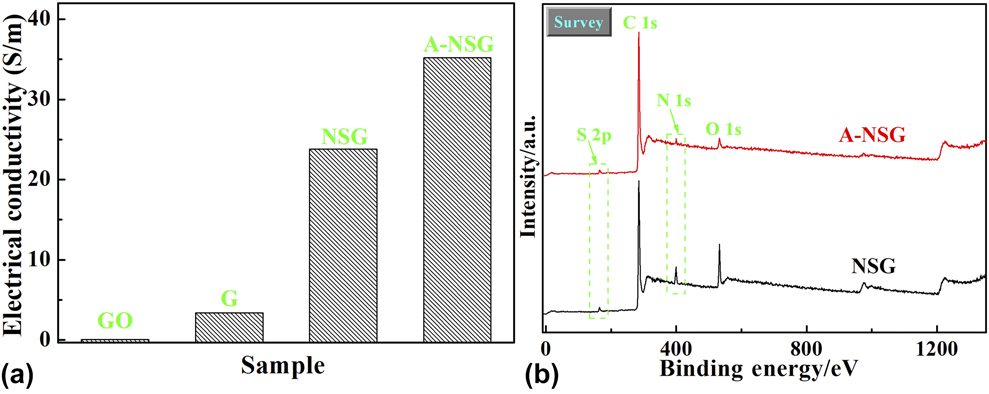
Figure 5(b) shows the XPS survey spectra of NSG and A-NSG. We found that two typical peaks appeared at ∼400 eV and ∼164 eV, which were assigned to the N 1s and S 2p peaks, respectively, confirming N and S atoms simultaneously doped into graphene framework. The specific XPS results on the atomic percentages are given in Table SII. It was observed that the O content decreased from 12.50 at.% for NSG to 5.13 at.% for A-NSG, indicating the loss of plentiful oxygen-containing groups during subsequent thermal annealing. Meanwhile, the N and S contents in NSG (5.02 and 2.24 at.%) also went down to 1.97 and 1.57 at.% after thermal annealing, testifying the removal of some unstable N or S species [Reference Li, Fan, Zheng and Dong40, Reference Zhao, Sun, Jin, Wang, Yan, Chen, Zhu and Yao41]. Furthermore, the drastic climb of the C/O ratio from 6.40 for NSG to 17.80 for A-NSG was discerned, again demonstrating enhanced graphitic carbon domains. Obviously, this result was in good agreement with the above XRD and four-probe analysis.
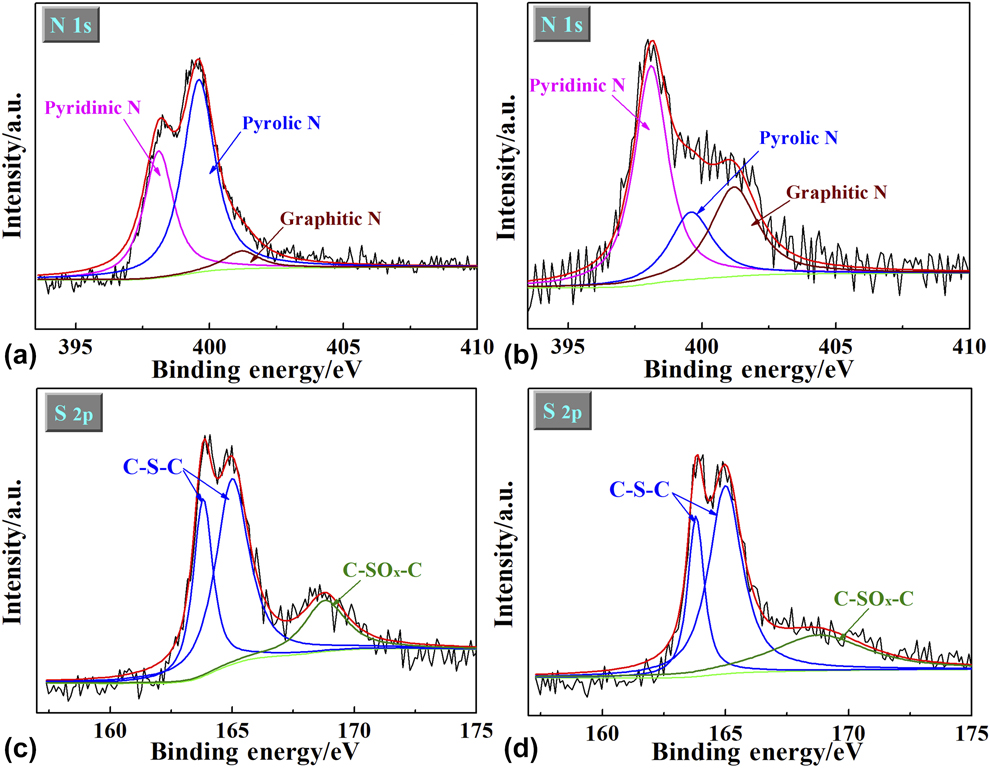
As seen from Figs. 6(a) and 6(b), the N 1s spectrum was deconvoluted into three main peaks: pyridinic N (398.1 eV), pyrolic N (399.6 eV), and graphitic N (401.2 eV), respectively [Reference Chen, Zhou, Fu, Chen, Xu and Kuang36, Reference Wang, Zhang, Qu, Lai and Li46]. Similarly, the S 2p spectrum was also resolved into –C–S–C– (163.8 eV for S 2p 3/2 and 165.0 eV for S 2p 1/2) and –C–SOx–C– (168.8 eV), as shown in Figs. 6(c) and 6(d) [Reference Li, Jia, Chang, Chen, Liu, Wang, Hu, Xia, Yang and Yao42, Reference Yang, Yao, Li, Fang, Nie, Liu, Zhou, Chen and Huang47]. Table SIII provides the specific XPS results on the N and S distributions of NSG and A-NSG. Interestingly, the contents of pyridinic N and graphitic N ascended from 35.6 and 5.9% for NSG to 51.2 and 28.9% for A-NSG, which was possibly due to the transformation of pyrolic N into pyridinic N and graphitic N during post-annealing process [Reference Zheng, Wang, Wang and Xia32]. Meanwhile, it was found that the content of –C–S–C– increased from 70.3% for NSG to 82.8% for A-NSG, whereas the content of –C–SOx–C– fell down from 29.7% for NSG to 17.2% for A-NSG, indicating the conversion of –C–SOx–C– to –C–S–C–. As demonstrated previously [Reference Zhang, Chen, Guo, Jin, Wang, Li, Zhang, Wang, Sun and Zhang48], pyridinic N with a pair of lone electrons can make remarkable pseudocapacitance contribution by reversible redox reaction (–C=N–C– + H2O + e− ↔ –C–NH–C– + OH−) and improve the wettability and hydrophilicity. Additionally, it boosts the adsorbability for O2 and directly acts as active catalytic sites toward ORR [Reference Lai, Potts, Zhan, Wang, Poh, Tang, Gong, Shen, Lin and Ruoff49]. In contrast, graphitic N embedded into sp 2-type carbon basal plane does favor to enhance the conductivity of carbon framework [Reference Sui, Meng, Xiao, Zhao, Wei and Han50]. As for –C–S–C– configuration, it also devotes valid pseudocapacitance by reversible redox reaction (–C–S–C– + H2O + 3e− ↔ –C–SO2–C– + 3OH−) and functions as effective catalytic sites toward ORR [Reference Yang, Yao, Li, Fang, Nie, Liu, Zhou, Chen and Huang47, Reference Zhang, Chen, Guo, Jin, Wang, Li, Zhang, Wang, Sun and Zhang48].
High-resolution N 1s spectra of NSG (a) and A-NSG (b); High-resolution S 2p spectra of NSG (c) and A-NSG (d).

On the basis of the above analysis, it can be concluded that subsequent thermal annealing on NSG brings about unique 3D mesoporous thin nanosheets, much elevated specific surface area, as well as structural defects, enhanced conductivity, and optimized N and S configurations (especially for pyridinic N as well as graphitic N and –C–S–C–). Therefore, the obtained A-NSG is anticipated to exhibit much promoted electrochemical performance. Herein, both the capacitance and ORR performance of A-NSG are measured (specific testing details can be found in Supplementary material).
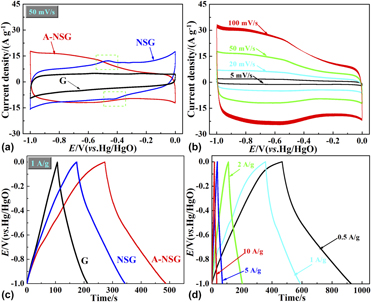
Figure 7(a) shows the cyclic voltammetry (CV) curves at a scan rate of 50 mV/s. The CV curve of G exhibited approximately rectangular shape, suggesting a good double-layer capacitance property. In contrast, two peaks located at ∼−0.45 V and −0.42 V (see the dotted rectangle area) were evidenced in the CV curve of NSG, which was related to the pseudocapacitance effect induced by N and S codoping [Reference Zhang, Chen, Guo, Jin, Wang, Li, Zhang, Wang, Sun and Zhang48, Reference Xin, Wang, Zhang, Song and Zhang51]. In addition, the loop area for NSG appeared much larger than that for G, implying better capacitance behavior. With regard to A-NSG, the corresponding loop area further aggrandized, indicating increased capacitance, which was connected with the coeffect of optimized morphology, structure, composition, and conductivity caused by subsequent thermal annealing. Figure 7(b) exhibits the CV curves of A-NSG at various scan rates. It was found that the CV curve could still remain in a quasirectangular shape even at a high scan rate of 100 mV/s, manifesting excellent rate performance.
(a) CV curves at a scan rate of 50 mV/s for G, NSG, and A-NSG; (b) CV curves at different scan rates from 5 to 100 mV/s for A-NSG; (c) GCD curves at a current density of 1 A/g for G, NSG, and A-NSG; (d) GCD curves at different current densities from 0.5 to 10 A/g for A-NSG.

Figure 7(c) displays the galvanostatic charge/discharge (GCD) curves at current density of 1 A/g. Slight distortion in the GCD curves of NSG and A-NSG electrodes reflected the pseudocapacitance behavior. The capacitance value of A-NSG calculated from the GCD curve at 1 A/g was 233 F/g, which was much higher than those of G (106 F/g) and NSG (169 F/g), exhibiting significantly enhanced capacitance performance. Figure 7(d) presents the GCD curves of A-NSG at different current densities. We observed that the capacitance value could maintain as high as 158 F/g even at 10 A/g, also revealing superior rate property. Figure S1(a) gives the Nyquist plot of A-NSG. The charge transfer resistance (R ct) of A-NSG calculated from the diameter of semicircle turned out to be only 1.8 Ω, indicating rapid charge transfer kinetics [Reference Yang, Zhou, Huang, Li, Fu, Chen, Li, Liu and Kuang52]. To detect the cycling stability, the CV curve at a scan rate of 100 mV/s over 5000 cycles was measured, as shown in Fig. S1(b). Apparently, A-NSG just showed less than 12% capacitance loss after long-term cycling, demonstrating prominent cycling stability.
To detect the ORR performance of the as-prepared carbon samples, CV was employed. Figure S2(c) showed the CV curves of A-NSG electrode in N2- and O2-saturated 0.1 M KOH electrolyte, and a distinct oxygen reduction peak at −0.23 V was discerned, indicating good catalytic activity toward ORR. In contrast, similar oxygen reduction peaks were also found on G and NSG electrodes at −0.39 V and −0.26 V, respectively, as shown in Figs. S2(a) and S2(b). Moreover, the A-NSG electrode displayed much higher current density than G and NSG electrodes. The more positive peak potential and higher current density reflected better ORR performance on the A-NSG electrode [Reference Chen, Chen, Kuang, Xu, Yang, Zhou, He, Jing, Li, Li, Chen and Hou45]. Figure S2(d) gives the CV curve of A-NSG electrode in oxygen saturated 0.1 M KOH electrolyte before and after 5000 cycles. No obvious curve change was found after continuous cycles, demonstrating excellent cycling stability.
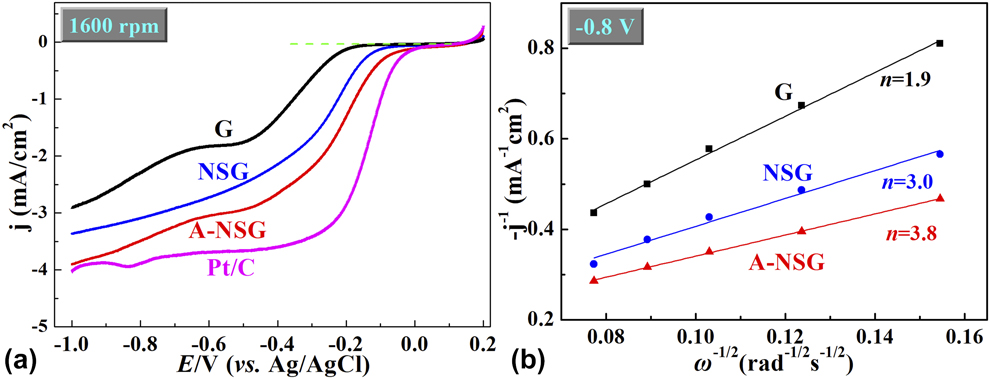
To further explore the ORR performance, the linear sweep voltammetry (LSV) curve was tested. Figure 8(a) exhibited the LSV curve of G, NSG, and A-NSG electrodes at 1600 rpm in O2-saturated 0.1 M KOH electrolyte. For comparison, the LSV curve at 1600 rpm of commercial Pt/C (De Nora Elettrodi Co., Ltd., Somerset, NJ; 20 wt% Pt on carbon black) was also measured. Two reduction platforms at −0.18 and −0.51 V were evidenced in the LSV curve of G electrode, suggesting typical two-step two-electron process with the formation of intermediate HO2− [Reference Lin, Song, Ding, Liu, Liu and Wong53]. Compared with G and NSG electrodes, A-NSG showed more positive ORR onset potential of −0.02 V, which was much close to that of commercial Pt/C (−0.03 V). Additionally, A-NSG exhibited much higher current density toward ORR, agreeing with the CV results discussed above. The more positive onset potential and higher current density on A-NSG electrode confirmed much promoted catalytic activity toward ORR. Figure S3(c) presents the LSV curves of A-NSG electrode at various rotation speeds from 400 to 1600 rpm. Also, similar LSV curves of G and NSG electrodes are provided in Figs. S3(a) and S3(b). The K–L plots at −0.8 V on the LSV curves at various rotation speeds were analyzed to qualify the ORR process. Figure 8(b) displayed the K–L plots with good linearity. The electron transfer number (n) of these electrodes calculated from the slopes of linearly fitted K–L plots was 3.8 for A-NSG electrode, 3.0 for NSG electrode, and 1.9 for G electrode. Obviously, the A-NSG electrode possessed the largest n value, signifying fastest ORR kinetics.
(a) LSV curves in O2 saturated 0.1 M KOH electrolyte (rotation rate 1600 rpm, scan rate 10 mV/s) for G, NSG, A-NSG, and Pt/C electrodes; (b) K–L plots (i −1 versus ω−1/2) at the potential of −0.8 V for G, NSG and A-NSG electrodes.

As investigated above, it could be recognized that the obtained A-NSG electrode possessed much improved electrochemical performance in the application of supercapacitor and ORR, and this promoted electrochemical performance was ascribed to the coeffect of unique 3D porous architecture, increased specific surface area, as well as structural defects, strengthened conductivity, and optimized N and S configurations. Specifically, 3D porous architecture was beneficial to electrolyte penetration and reactants/products diffusion, whereas high conductivity guaranteed rapid ions transfer inside carbon framework. Meanwhile, large specific surface area offered sufficient exposed sites for ions/oxygen adsorption/desorption and oxygen reduction, thus leading to good electrical double-layer capacitor and catalytic activity toward ORR. Abundant structural defects further enhanced ion adsorption behavior and catalytic activity toward ORR. Besides, increased percentages of pyridinic N, graphitic N, and –C–S–C– configuration not only devoted effective pseudocapacitance but also improved wettability, conductivity, and catalytic activity toward ORR.
Conclusions
Three-dimensional N,S-codoped graphene framework (3D A-NSG) could be successfully fabricated by a facile two-step doping pathway using GO and ammonium sulfide as carbon precursor and N and S sources. The results showed that the obtained A-NSG possessed typical 3D mesoporous thin nanosheets, much increased specific surface area, as well as structural defects, strengthened conductivity, and optimized N and S configurations (especially for dominated pyridinic N as well as graphitic N and –C–S–C–). Benefitting from all these advantages, the A-NSG electrode presented much better capacitance and ORR performance than other counterparts. Apparently, our work not only provides a promising electrode material for supercapacitors and ORR but also offers a novel and facile two-step doping strategy for the synthesis of advanced heteroatom-doped carbon materials.
Experimental section
Preparation of annealed N,S-codoped graphene framework
First, GO was prepared from natural graphite flakes by the modified Hummers’ method [Reference Hummers and Offeman6]. 100 mg GO was dispersed in 60 mL distilled water in a beaker under strong ultrasonic treatment for 2 h to make uniform GO suspension; then, 1.0 g ammonium sulfide solution was gradually added into the above GO suspension with continuous stirring. After this, the obtained mixture was transferred into a 100-mL Teflon-lined autoclave and maintained at 180 °C for 12 h. The final solid product was rinsed with ethanol and distilled water, and then dried by vacuum freeze-drying to get 3D NSG. The annealed NSG (A-NSG) was obtained by annealing NSG under nitrogen atmosphere at 750 °C for one hour. For comparison, pure graphene (G) was also produced by similar hydrothermal method without adding (NH4)2S solution.
Material characterization
The morphology of the obtained samples was detected by scanning electron microscope (SEM; Hitachi S-4800, Japan). The specific surface area and pore size distribution were measured on the basis of the nitrogen physical sorption (Beckman Coulter SA-3100, USA). X-ray diffraction (XRD) pattern was tested by a X-ray diffractometer (Philips PC-APD, Netherlands) with Cu Kα radiation (λ = 1.5418 Å). Raman spectroscopy was performed on a Raman spectrometer (Labram-010) from 800–2000 cm−1. Electrical conductivity was measured on a SZT-2 four-probe conductivity meter. X-ray photoelectron spectroscopy (XPS) analysis was conducted on an ESCALAB250 (USA) XPS spectrometer equipped with a Mg Kα X-ray source (1350 eV).
Supplementary material
To view supplementary material for this article, please visit https://doi.org/10.1557/jmr.2019.107.
Acknowledgments
This work was supported by the National Natural Science Foundation of China (Grant Nos. 51804116, 51772092, and 51873059), Natural Science Foundation of Hunan Province, China (Grant Nos. 2018JJ3207 and 2017JJ2103), Hunan Province College Students Research Learning and Innovative Experiment Project (Grant No. 716). Prof. Zhaohui Hou, Wenyuan Xu, and Yong Tao as well as Miss Yajing Li were appreciated for their experiment guidance and manuscript polishment.