Introduction
Transmission electron microscopy (TEM) of graphene has developed into a thriving field, especially over the past five years, during which feats such as imaging single carbon atoms have become almost routine. These developments, however, are just the latest in a long, symbiotic history between graphitic materials and electron microscopy. At least as early as 1960,Reference Moran1 electron microscopists prepared few-layer graphene by exfoliation, sometimes producing graphite flakes less than 2 nm thick.Reference Johansen2 These graphite flakes were used in some of the earliest TEM studies of crystal defectsReference Mitsuishi, Nagasaki and Uyeda3–Reference Hedley6 and as imaging substrates for biological samples such as deoxyribonucleic acid (DNA).Reference Moran1, Reference Johansen2, Reference Beer and Highton7 Over the intervening decades, this synergy, in which graphene acts as both a TEM sample and a substrate for other studies, has persisted. In this review, we attempt a broad, materials-oriented review of TEM applications to graphene. We focus on recent developments, first with respect to instrumentation and sample preparation. We then explain how TEM has contributed to our understanding of the physical and electronic properties of graphene sheets and their defects and finish by discussing how graphene is becoming a platform for diverse TEM investigations using in situ techniques, as well as an imaging substrate.
Instrumentation and sample preparation
Like all materials investigated by TEM, graphene must be suspended on TEM grids for study. Graphene sample preparation for high-resolution microscopy is particularly challenging because it requires extraordinary cleanliness: When a sample is a single atom thick, even a monolayer of contamination is unacceptable. Whereas cross-sectional TEM samples of graphene on substrates can be prepared using conventional TEM preparation techniques, most TEM studies investigate graphene in plan view, perpendicular to the graphene basal plane. Fabricating these plan-view samples is nontrivial—still more art than science—and is tailored specifically for graphene imaging.
In plan-view sample preparation, graphene membranes are transferred onto a TEM grid, typically a metallic or SiN mesh, possibly with additional support provided by perforated amorphous carbon (for example, Quantifoil® holey carbon films). Graphene produced by mechanical or chemical exfoliation is either (1) scooped from solution onto a TEM gridReference Hernandez, Nicolosi, Lotya, Blighe, Sun, De, McGovern, Holland, Byrne, Gun’Ko, Boland, Niraj, Duesberg, Krishnamurthy, Goodhue, Hutchison, Scardaci, Ferrari and Coleman8 or (2) transferred from another surface by placing the graphene and grid in contact and using isopropanol to adhere them.Reference Meyer, Girit, Crommie and Zettl9 Graphene grown by chemical vapor deposition on copper or nickel substrates can be transferred in large sheets to TEM grids by supporting the graphene with a polymer layer (optional); etching the metal growth substrate; scooping the graphene onto TEM grids; and removing the polymer layer, if used, using solvents or by annealing in air. This technique has produced single-layer graphene suspended over ∼2-μm holes, covering up to 90% of 3-mm TEM grids,Reference Huang, Ruiz-Vargas, van der Zande, Whitney, Levendorf, Kevek, Garg, Alden, Hustedt, Zhu, Park, McEuen and Muller10–Reference Regan, Alem, Alemán, Geng, Girit, Maserati, Wang, Crommie and Zettl12 although these grids often contain amorphous carbon and metal etchant residues.
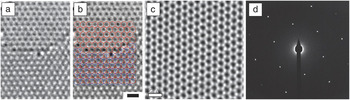
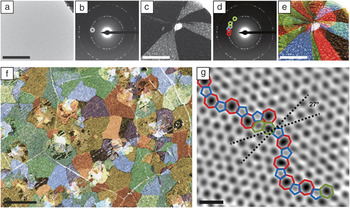
TEM techniques, which include high-resolution TEM (HRTEM), scanning transmission electron microscopy (STEM), and electron diffraction, typically probe the structure of a material from micrometer to angstrom scales. This wide range of accessible length scales makes it possible to study properties of graphene ranging from micrometer-scale grain structure to atomic defects in the graphene lattice. In both TEM and STEM, a high-energy beam of electrons is fired though a thin sample. In TEM, this beam broadly illuminates the area of interest, and the transmitted electrons form an image on a viewing screen or charge-coupled device (CCD). In STEM, the beam is instead focused to an angstrom-scale spot, which is scanned across the sample to form the image. As shown in Figure 1a–c, both TEM and STEM form real-space images of a graphene sheet at up-to-atomic resolution. Although STEM and TEM imaging are not completely equivalent, in many cases, the two techniques provide similar information. Therefore, the two are often mentioned here in tandem, as (S)TEM. (S)TEM real-space imaging techniques are often used in conjunction with diffraction techniques that probe the reciprocal lattice of graphene, such as selected-area electron diffraction (SAED), nanodiffraction, and dark-field TEM. An example of an SAED pattern, the most commonly used and familiar type of diffraction data, is shown in Figure 1d. Other electron microscopy techniques, such as three-dimensional imaging, energy-filtered TEM, and electron energy-loss spectroscopy (EELS), and in situ manipulations further extend the range of questions that can be addressed by (S)TEM. Textbooks and reviews discussing (S)TEM and related techniques can be found in References Reference Urban14–Reference Williams and Carter18.
Electron microscope imaging of graphene. (a–b) Atomic-resolution high-resolution transmission electron microscopy (HRTEM) images of (top) monolayer and (bottom) AB-stacked bilayer graphene. The scale bar is 5 Å. Reproduced with permission from Reference Reference Meyer, Kisielowski, Erni, Rossell, Crommie and Zettl13. ©2008, American Chemical Society. (c) Atomic-resolution scanning transmission electron microscopy (STEM) image of monolayer graphene. The scale bar is 5 Å. Reproduced with permission from Reference Reference Huang, Ruiz-Vargas, van der Zande, Whitney, Levendorf, Kevek, Garg, Alden, Hustedt, Zhu, Park, McEuen and Muller10. ©2011, Nature Publishing Group. (d) Selected-area electron diffraction pattern of a single graphene crystal.

Applying (S)TEM to graphene samples at atomic resolution raises unique challenges. Aside from sample preparation, the greatest of these challenges is high-resolution, low-voltage imaging. Because graphene is a low-Z (i.e., low-atomic-number) material, it is a weak electron scatterer. Correcting the aberrations in electron optics is therefore crucial to maximize contrast and signal for imaging at the single-atom level in graphene. Also, the knock-on damage threshold of graphene is below the accelerating voltages used in many electron microscopes. Graphene can be imaged using electrons below its knock-on damage threshold of ∼90 kVReference Smith and Luzzi19, Reference Meyer, Eder, Kurasch, Skakalova, Kotakoski, Park, Roth, Chuvilin, Eyhusen, Benner, Krasheninnikov and Kaiser20 to minimize damage to the lattice or above this voltage to induce structural transformations. Along with other radiation-sensitive systems, such as biological samples, graphene has driven the development of low-voltage, high-resolution instruments.
Imaging atomic-scale point and line defects in graphene
Applying high-resolution (S)TEM to understand the structure, energetics, and properties of atomic-scale defects has been among the richest areas of electron microscopy on graphene. As shown in Figure 1, aberration-corrected (S)TEM is one of the few methods (along with scanning tunneling microcopy) that can image the hexagonal lattice in graphene at atomic resolution. Defects can contribute to or even dominate the physical properties of graphene—from its electrical conductivity and mechanical strength to its chemical reactivity or thermal conductivity. As a result, characterizing the structure of defects in graphene is critical to understanding and controlling its large-scale properties. For example, scanning tunneling microscopy has demonstrated that line defects can behave as metallic one-dimensional wires in graphene.Reference Lahiri, Lin, Bozkurt, Oleynik and Batzill21 Additionally, the atomic structure at the edges of graphene sheets can contribute strongly to the electrical performance of graphene devices, especially in narrow conducting channels such as nanoconstrictions or nanoribbons.Reference Nakada, Fujita, Dresselhaus and Dresselhaus22 Here, we treat these defects only cursorily and instead focus on (S)TEM applications. In-depth reviews of defects in graphene can be found in other articles in this issue and in Reference Reference Banhart, Kotakoski and Krasheninnikov23.
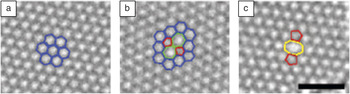
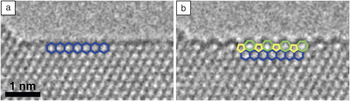
TEM has been used to image many structural defects in graphene, including zero-dimensional structures, such as vacancies and Stone–Wales (SW) defects, and one-dimensional structures, such as edges and grain boundaries. (S)TEM images such as those in Figure 2 have shown that many of these defects are formed from or reconstruct into similar building blocks: Pentagons, heptagons, or rings of other sizes replace the hexagons in graphene while maintaining sp 2 bonding. These structures can be localized (Figure 2b–c), forming point defects such as SW defects and reconstructed divacancies. When they are repeated in strings of dislocation cores, these motifs form grain boundaries in single-layerReference Huang, Ruiz-Vargas, van der Zande, Whitney, Levendorf, Kevek, Garg, Alden, Hustedt, Zhu, Park, McEuen and Muller10, Reference Kim, Lee, Regan, Kisielowski, Crommie and Zettl25 and multilayerReference Warner, Rummeli, Gemming, Buchner and Briggs26, Reference Park, Meyer, Roth and Skákalová27 graphene. At the edges of graphene sheets, (S)TEM images have depicted several different configurations—not only atomically sharp armchair- or zigzag-terminated conformations, but also rough combinations of the two.Reference Girit, Meyer, Erni, Rossell, Kisielowski, Yang, Park, Crommie, Cohen, Louie and Zettl28 Combining (S)TEM imaging with high-energy electron radiation or in situ heating can induce graphene sublimation and produce stunning images of edge formation and reconstruction at the atomic scale (Figure 3).Reference Girit, Meyer, Erni, Rossell, Kisielowski, Yang, Park, Crommie, Cohen, Louie and Zettl28–Reference Chuvilin, Meyer, Algara-Siller and Kaiser31
Examples of elementary defects with structure overlay: (a) pristine lattice, with hexagons overlaid in blue; (b) Stone–Wales defect, in which a pair of carbon atoms is rotated by 90° to form two heptagons (green) and two pentagons (red); (c) divacancy displaying 5–8–5 reconstruction consisting of an octagon (yellow) flanked by two pentagons (red). The scale bar is 1 nm. Adapted from Reference Reference Kotakoski, Meyer, Kurasch, Santos-Cottin, Kaiser and Krasheninnikov24.

Dynamic observation of the edge of a graphene sheet by HRTEM: (a) A zigzag edge configuration transforms to (b) a 5–7 reconstructed edge and back repeatedly under irradiation. Adapted from Reference Reference Chuvilin, Meyer, Algara-Siller and Kaiser31.

In addition to atomic structure, local image contrast in (S)TEM depends on the nuclear potential of the atoms, making TEM and especially STEM sensitive to atomic number. This sensitivity enables identification of even single-atom substitutions in two-dimensional materials,Reference Krivanek, Chisholm, Nicolosi, Pennycook, Corbin, Dellby, Murfitt, Own, Szilagyi, Oxley, Pantelides and Pennycook32 including nitrogen dopantsReference Meyer, Kurasch, Park, Skakalova, Künzel, Groß, Chuvilin, Algara-Siller, Roth, Iwasaki, Starke, Smet and Kaiser33 and transition-metal atoms embedded in vacanciesReference Wang, Wang, Cheng, Li, Yao, Zhang, Dong, Wang, Schwingenschlögl, Yang and Zhang34 in graphene. The identity of these atoms can be confirmed using electron spectroscopy.Reference Suenaga, Tencé, Mory, Colliex, Kato, Okazaki, Shinohara, Hirahara, Bandow and Iijima35, Reference Suenaga, Kobayashi and Koshino36 Larger-scale chemical substitutions and modifications, including boron nitride–graphene hybrid structures,Reference Ci, Song, Jin, Jariwala, Wu, Li, Srivastava, Wang, Storr, Balicas, Liu and Ajayan37 graphene oxide,Reference Mkhoyan, Contryman, Silcox, Stewart, Eda, Mattevi, Miller and Chhowalla38 fluorinated graphene,Reference Jeon, Lee, Pollak, Moreschini, Bostwick, Park, Mendelsberg, Radmilovic, Kostecki, Richardson and Rotenberg39, Reference Nair, Ren, Jalil, Riaz, Kravets, Britnell, Blake, Schedin, Mayorov, Yuan, Katsnelson, Cheng, Strupinski, Bulusheva, Okotrub, Grigorieva, Grigorenko, Novoselov and Geim40 and adsorbates, can be similarly characterized. In studies that strive to tune the properties of graphene through chemical modification, TEM is one of the few measures that can directly characterize whether modifications are successful, image their structure, and quantify their density.
Probing the structure of graphene on larger scales, in two and three dimensions: Domains, stacking, and three-dimensional structure
As graphene fabrication techniques expand from exfoliation to include growth methods such as epitaxial growth and chemical vapor deposition (CVD), tools that can simply and accurately characterize large-scale measures of graphene quality, including grain structure, thickness, and multilayer stacking, become increasingly important. These new growth methods can also produce structures that are not typical of graphite, such as rotational misalignments between grains or between graphene multilayers.
Characterizing these structures is critical for three reasons. First, both in-plane and out-of-plane domain structures affect graphene properties.Reference Yazyev and Louie41–Reference Lopes dos Santos, Peres and Castro Neto43 Second, studies correlating growth conditions and structure can shed light on graphene growth mechanisms and how to tune them. Third, conventional techniques that are typically used to address domain structure in bulk materials, such as electron backscatter or x-ray diffraction, often lack the sensitivity to characterize single-layer graphene. TEM has three main tools for addressing stacking and domain structure in macroscopic samples of graphene: (1) high-resolution imaging in either plan view or cross section, (2) diffraction, and (3) dark-field TEM.
Imaging graphene stacking configurations at high resolution
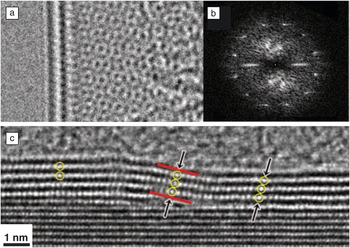
High-resolution imaging in plan view can determine the stacking registry between layers of graphene. For example, when stacked graphene layers are rotated with respect to one another, they produce moiré patterns that represent the relative shift and rotation of the layers, such as the bilayer ∼30° moiré pattern in Figure 4a. When the layers are rotationally aligned,Reference Gass, Bangert, Bleloch, Wang, Nair and Geim45 multilayers of graphene can generally be identified (Figure 1a–b) by comparing TEM image contrast to simulations.Reference Nelson, Diebold and Hull46
Structures of multilayer graphene: (a) a moiré pattern in bilayer turbostratic graphene grown by chemical vapor deposition (CVD) and (b) a fast Fourier transform of the pattern in (a), showing two orientations of graphene with a relative rotation of ∼30°. Reproduced with permission from Reference Reference Warner, Rummeli, Gemming, Buchner and Briggs26. ©2009, American Chemical Society. (c) Cross-sectional image of multilayer graphene grown on SiC. As the graphene crosses a step in the SiC surface, the out-of-plane registry between the layers changes. Reproduced with permission from Reference Reference Norimatsu and Kusunoki44. ©2010, American Physical Society.

Graphene on a substrate can be imaged in cross section using conventional TEM sample preparation techniques, including mechanical polishing and focused-ion-beam milling. Figure 4c displays an example of a cross-sectional image of few-layer graphene grown epitaxially on SiC. In edge-on images such as Figure 4c, the local graphene thickness; the spacing, orientation, and registration between layers;Reference Norimatsu and Kusunoki44, Reference Weng, Robinson, Trumbull, Cavalero, Fanton and Snyder47, Reference Norimatsu and Kusunoki48 and the density of each layerReference Norimatsu and Kusunoki44, Reference Norimatsu and Kusunoki48 can be directly measured. The interfaces of graphene with other materials, such as a substrate or electrical contact, are also readily visible. Graphene growth mechanisms can be inferred by comparing the atomic stacking in graphene with the local morphology of SiCReference Norimatsu and Kusunoki44, Reference Weng, Robinson, Trumbull, Cavalero, Fanton and Snyder47–Reference Handa, Takahashi, Abe, Imaizumi, Saito, Jung, Ito, Fukidome and Suemitsu51 or metal growth substrates.Reference Colby, Yu, Cao, Pei, Stach and Chen52 These techniques have provided atomic-resolution images of SiC facets and step edges, as well as the defects they cause in graphene formation.Reference Norimatsu and Kusunoki49, Reference Nagase, Hibino, Kageshima and Yamaguchi50
Diffraction techniques for understanding domain structure and stacking
Diffraction techniques, such as SAED, nanodiffraction, convergent-beam electron diffraction, and dark-field TEM, probe crystal structure by measuring the reciprocal lattice of graphene. These tools are particularly valuable because they can sample large areas simultaneously and, compared with high-resolution (S)TEM, they are relatively accessible. Another advantage of diffraction-based TEM techniques is that their sample preparation is simpler: Diffraction can be conducted through electron-transparent substrates such as ultrathin ∼10-nm SiN and is relatively insensitive to sample contamination.
A polycrystalline diffraction pattern is shown in Figure 4b. The rotational misalignment of the adjacent graphene crystals produces diffraction patterns that are also rotated from one another. This enables easy local identification of rotational misalignment, both in-plane in polycrystalline graphene and out-of-plane in turbostratic (rotated) multilayerReference Brown, Hovden, Huang, Wojcik, Muller and Park53 or foldedReference Kim, Lee, Malone, Chan, Alemán, Regan, Gannett, Crommie, Cohen and Zettl54 graphene. In cases where multilayer graphene is rotationally aligned, a combination of diffraction and sample tilt can uniquely distinguish between AA, AB, and ABC stackings; determine the local thickness; and even quantify out-of-plane rippling (typically ∼1-nm height variations).Reference Meyer, Geim, Katsnelson, Novoselov, Booth and Roth55
The utility of diffraction can be greatly extended through dark-field TEM, which is illustrated in Figure 5. In dark-field TEM images, the diffracted electron beams are filtered to select particular graphene diffraction spots and then Fourier-transformed within the TEM instrument into real-space images (Figure 5a–d). This makes it possible to convert nearly any information that can be obtained in a diffraction pattern into real-space, large-area images (Figure 5e–f). For example, dark-field TEM is useful for mapping the sizes and orientations of graphene domains.Reference Huang, Ruiz-Vargas, van der Zande, Whitney, Levendorf, Kevek, Garg, Alden, Hustedt, Zhu, Park, McEuen and Muller10 Similar results can be achieved by acquiring large maps of diffraction patterns, each from a nanoscale volume.Reference Kim, Lee, Regan, Kisielowski, Crommie and Zettl25 Information from large-scale diffraction studies can complement atomic-resolution work. For example, the image of a graphene grain boundary in Figure 5g augments dark-field maps to jointly provide a complete picture of polycrystalline graphene from atoms to grains.
Diffraction-contrast imaging of grains in graphene. (a–e) Dark-field transmission electron microscopy (TEM) imaging process: (a) Bright-field TEM image, where the sample appears uniform. (b) Diffraction pattern taken from the region shown in (a). Placing an aperture in the diffraction plane filters the scattered electrons, forming (c) a dark-field image showing the real-space shape of these grains. (d) Using several different aperture locations and color-coding them produces (e) a false-color, dark-field image overlay depicting the shapes and lattice orientations of several grains. Scale bars are 500 nm. (f) A large-area dark-field image of graphene grown by CVD on copper and imaged through a thin SiN window. The scale bar is 2 μm. (g) An atomic-resolution STEM image of atoms at a graphene grain boundary with a 27° relative rotation between grains. Colored polygons indicate the heptagons (red), pentagons (blue), and hexagons (green) that make up the grain boundary. The scale bar is 5 Å. Modified from Reference Reference Huang, Ruiz-Vargas, van der Zande, Whitney, Levendorf, Kevek, Garg, Alden, Hustedt, Zhu, Park, McEuen and Muller10.

Dark-field TEM is not simply limited to characterizing grain structure. In multilayer CVD graphene, dark-field TEM can be used to catalog out-of-plane stacking, identify stacking faults in AB-stacked graphene, and visualize local variations in rotation and strain between different graphene layers.Reference Brown, Hovden, Huang, Wojcik, Muller and Park53
Because they are relatively easy and can characterize a wide range of length scales, diffraction-sensitive imaging techniques are well-suited for connecting structure to physical properties, such as the electricalReference Huang, Ruiz-Vargas, van der Zande, Whitney, Levendorf, Kevek, Garg, Alden, Hustedt, Zhu, Park, McEuen and Muller10, Reference Yu, Jauregui, Wu, Colby, Tian, Su, Cao, Liu, Pandey, Wei, Chung, Peng, Guisinger, Stach, Bao, Pei and Chen56, Reference Tsen, Brown, Levendorf, Ghahari, Huang, Havener, Ruiz-Vargas, Muller, Kim and Park57 and mechanicalReference Huang, Ruiz-Vargas, van der Zande, Whitney, Levendorf, Kevek, Garg, Alden, Hustedt, Zhu, Park, McEuen and Muller10, Reference Ruiz-Vargas, Zhuang, Garg, Huang, van der Zande, McEuen, Muller, Hennig and Park58 properties of graphene grain boundaries. This approach has been integral to understanding electrical transport in polycrystalline CVD graphene, for which studies of the effects of grain boundaries on electrical transport and mobility had produced apparently conflicting results.Reference Huang, Ruiz-Vargas, van der Zande, Whitney, Levendorf, Kevek, Garg, Alden, Hustedt, Zhu, Park, McEuen and Muller10, Reference Norimatsu and Kusunoki44, Reference Jauregui, Cao, Wu, Yu and Chen59, Reference Li, Magnuson, Venugopal, An, Suk, Han, Borysiak, Cai, Velamakanni, Zhu, Fu, Vogel, Voelkl, Colombo and Ruoff60 Recent TEM studies shed light on this disparity by identifying regions where, rather than being atomically stitched to form a single continuous sheet, adjacent graphene domains overlapped or were separated by nanometer-scale non-graphitic regions at their intersections.Reference Tsen, Brown, Levendorf, Ghahari, Huang, Havener, Ruiz-Vargas, Muller, Kim and Park57, Reference Robertson, Bachmatiuk, Wu, Schaffel, Rellinghaus, Buchner, Rummeli and Warner61
Further, dark-field TEM has been used to locate graphene grain boundaries, identify the type of boundary structure, and then aid in placing electrical leads to address individual grain boundaries and measuring electrical transport across each different boundary structure. These direct correlations demonstrate that the type and structure of a grain boundary can change its electronic resistance by over an order of magnitude.Reference Tsen, Brown, Levendorf, Ghahari, Huang, Havener, Ruiz-Vargas, Muller, Kim and Park57 Importantly, atomically stitched boundaries such as that in Figure 5g are such weak scatterers that a small-grained material with well-stitched boundaries can be less resistive than a large-grained material with a single disordered boundary.Reference Tsen, Brown, Levendorf, Ghahari, Huang, Havener, Ruiz-Vargas, Muller, Kim and Park57
Investigating the electronic properties of graphene by (S)TEM
The electronic structure of graphene can be analyzed directly using (S)TEM and related techniques, with which spatially resolved information about the electronic configuration can be obtained at atomic or near-atomic resolution. Combining electron energy-loss spectroscopy (EELS) with (S)TEM provides local and spatially varying measurements of the atomic and electronic configurations of a sample.Reference Muller15, Reference Meyer, Kurasch, Park, Skakalova, Künzel, Groß, Chuvilin, Algara-Siller, Roth, Iwasaki, Starke, Smet and Kaiser33, Reference Hillier and Baker62–Reference Muller, Kourkoutis, Murfitt, Song, Hwang, Silcox, Dellby and Krivanek65 Core-loss EEL spectra can provide elemental identification of atoms in a sample, and the fine structure of the core edges provides information on the type of bond or degree of ionization. More formally, EELS probes the unoccupied local density of states modified by the presence of the core hole.Reference Rez and Muller63 Low-loss spectra can directly measure the local optical and plasmonic response of a material and indirectly probe the band structure. Whereas graphite has been studied extensively by EELS,Reference Batson64, Reference Chen and Silcox66–Reference Egerton and Whelan69 corresponding investigations of single-layer graphene are rarer. The core-loss spectra are very similar for the two materials, but there are clear differences between single-layer graphene and graphite that reflect the particular electronic structure of graphene.Reference Eberlein, Bangert, Nair, Jones, Gass, Bleloch, Novoselov, Geim and Briddon70 These trends are similar to those between single- and multiwalled nanotubes.Reference Stephan, Ajayan, Colliex, Cyrot-Lackmann and Sandre71
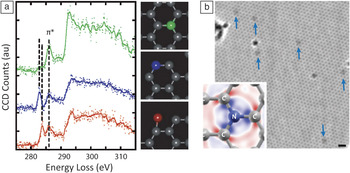
The key advantage of a spectroscopic tool with high spatial resolution is the ability to study nonperiodic, irregular configurations, including point defects, dopants, adsorbates, grain boundaries, edges, and other interfaces. Most notably, the electronic structure at the graphene edge has been explored by EELS, demonstrating that atoms at edges show distinct, and previously unobserved, features in the fine structure of the core edges (Figure 6a).Reference Suenaga and Koshino72
The electronic structures of graphene edges and dopants. (a) STEM–electron energy-loss (EEL) spectra of graphene edge atoms (blue, red), compared to spectra of bulk atoms (green). The insets show atoms in the corresponding colors. Adapted from Reference Reference Suenaga and Koshino72. (b) HRTEM image of nitrogen dopants in single-layer graphene (arrows). The inset shows the electronic configuration. The scale bar is 5 Å. Adapted from Reference Reference Meyer, Kurasch, Park, Skakalova, Künzel, Groß, Chuvilin, Algara-Siller, Roth, Iwasaki, Starke, Smet and Kaiser33.

In two-dimensional materials, insights into the electronic configurations can also be obtained from HRTEM images.Reference Meyer, Kurasch, Park, Skakalova, Künzel, Groß, Chuvilin, Algara-Siller, Roth, Iwasaki, Starke, Smet and Kaiser33 HRTEM image contrast depends not only on the nuclear potential but also on the charge distribution of the electrons.Reference Gemming, Mobus, Exner, Ernst and Ruhle73, Reference Deng and Marks74 This means that the effect of charge redistribution in chemical bonds must be taken into account when interpreting HRTEM images for small differences in contrast and that, conversely, information on the charge redistribution can also be obtained. Figure 6b shows the first direct visualization of nitrogen dopants in graphene,Reference Meyer, Kurasch, Park, Skakalova, Künzel, Groß, Chuvilin, Algara-Siller, Roth, Iwasaki, Starke, Smet and Kaiser33 an HRTEM image in which the dark contrast around N dopants is predominantly due to changes in the electronic structure of neighboring carbon atoms (Figure 6b, inset). These electronic effects were later confirmed by scanning tunneling microscopy.Reference Zhao, He, Rim, Schiros, Kim, Zhou, Gutiérrez, Chockalingam, Arguello, Pálová, Nordlund, Hybertsen, Reichman, Heinz, Kim, Pinczuk, Flynn and Pasupathy75
In situ experiments: Irradiating, sculpting, and heating graphene
In situ electron microscopy experiments on graphene range widely—from studies of electron-beam irradiation to studies of graphene using specially designed heating or electrical holders. An electron beam whose energy lies above the damage threshold of graphene can create defects, first by removing atoms from the lattice and then by triggering a variety of other modifications in the structure, especially transitions between different defect geometries.Reference Kotakoski, Meyer, Kurasch, Santos-Cottin, Kaiser and Krasheninnikov24 This makes it possible to study defects that might otherwise be rare and difficult to locate. Defects in graphene were imaged in this manner by (S)TEM first in 2004Reference Hashimoto, Suenaga, Gloter, Urita and Iijima76 and then later at atomic resolution.Reference Meyer, Kisielowski, Erni, Rossell, Crommie and Zettl13, Reference Gass, Bangert, Bleloch, Wang, Nair and Geim45Figure 2b–c show examples of beam-induced defects. At electron energies around 80–100 kV, damage occurs slowly enough that resulting defect configurations can be imaged before subsequent changes occur in the structure. This makes it possible to catalog the likely defect configurations in graphene and to investigate the energetics of transformations among them.Reference Kotakoski, Meyer, Kurasch, Santos-Cottin, Kaiser and Krasheninnikov24, Reference Kotakoski, Krasheninnikov, Kaiser and Meyer77 Phenomena such as the formation of isolated one-atom-wide carbon chainsReference Chuvilin, Meyer, Algara-Siller and Kaiser31, Reference Jin, Lan, Peng, Suenaga and Iijima78 and the reconstruction of extended edge segments under the beamReference Chuvilin, Meyer, Algara-Siller and Kaiser31 (Figure 3) indicate that a plethora of secondary mechanisms can occur in the material after the impact of high-energy electrons.
Such radiation damage studies provide the basis for more controlled in situ beam-induced modifications of the material, including hole drilling with an electron beam,Reference Fischbein and Drndić79, Reference Warner, Rümmeli, Ge, Gemming, Montanari, Harrison, Büchner and Briggs80 beam-induced deposition of nanoscale carbon structures onto graphene,Reference Meyer, Girit, Crommie and Zettl9 and substitution of metals into irradiation-induced vacancies.Reference Rodriguez-Manzo, Cretu and Banhart81 Additionally, the electron beam can convert one carbon allotrope to another. For example, graphene can be transformed into amorphous regions that are predicted to be semiconducting.Reference Kotakoski, Krasheninnikov, Kaiser and Meyer77 Simultaneous application of heat (200–700°C) and focused electron irradiation has been used to create single-walled carbon nanotubes from graphene and to make graphene ribbons with atomically smooth edges.Reference Song, Schneider, Xu, Pandraud, Dekker and Zandbergen82 Finally, graphene can be turned into fullerenes and vice versa.Reference Chuvilin, Kaiser, Bichoutskaia, Besley and Khlobystov83, Reference Chuvilin, Bichoutskaia, Gimenez-Lopez, Chamberlain, Rance, Kuganathan, Biskupek, Kaiser and Khlobystov84 This arsenal of tools should, in principle, allow versatile fabrication of small, complex nanocarbon devices.Reference Krasheninnikov and Banhart85
Using appropriately designed sample holders, thermal, optical, and electrical transport studies can be conducted on samples while they are under observation in the microscope, enabling in situ investigations of structure–property relationships. For example, graphene can be electrically contacted through the TEM sample holder, making it possible to pass high currents through graphene samples and heat them to extreme temperatures.Reference Jia, Hofmann, Meunier, Sumpter, Campos-Delgado, Romo-Herrera, Son, Hsieh, Reina, Kong, Terrones and Dresselhaus29, Reference Kim, Regan, Geng, Alemán, Kessler, Wang, Crommie and Zettl86–Reference Westenfelder, Meyer, Biskupek, Kurasch, Scholz, Krill and Kaiser89 These studies have achieved temperatures exceeding 2000 K in conjunction with HRTEM imaging, enabling in situ observations of the sublimation and reconstruction of graphene edgesReference Jia, Hofmann, Meunier, Sumpter, Campos-Delgado, Romo-Herrera, Son, Hsieh, Reina, Kong, Terrones and Dresselhaus29, Reference Huang, Qi and Li30 and the formation of nanocrystalline graphene from amorphous adsorbates.Reference Westenfelder, Meyer, Biskupek, Kurasch, Scholz, Krill and Kaiser89
Graphene as a substrate
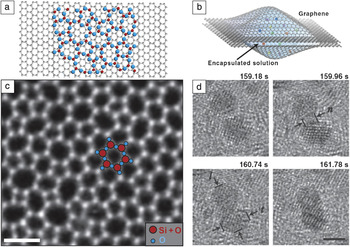
Graphene has been touted as the ultimate (S)TEM support membrane. Because (S)TEM produces projection images, any substrate produces a background and associated statistical noise, above which signals of interest must be detected. Standard (S)TEM substrates produced from amorphous carbon or silicon nitride have typical thicknesses ranging from 2 to 40 nm. A single-atom-thick substrate such as graphene thus provides a theoretical factor of 10 or more decrease in background from nanometer-thick substrates. Because graphene is a good electrical and thermal conductor, it also prevents the sample from charging and reduces heat-induced damage. Finally, for STEM, single-layer graphene substrates provide a built-in reference for mass-thickness determination, enabling quantitative atomic imaging and spectroscopy of nanomaterials with atomic-layer sensitivity,Reference Huang, Kurasch, Srivastava, Skakalova, Kotakoski, Krasheninnikov, Hovden, Mao, Meyer, Smet, Muller and Kaiser90 which is typically a major challenge.Reference Lebeau, Findlay, Allen and Stemmer91, Reference Lebeau, Findlay, Allen and Stemmer92 These features have encouraged the pursuit of graphene TEM substrates starting from the early 1960s (although it was called monolayer graphite at that time).Reference Moran1, Reference Johansen2, Reference Dobelle and Beer93, Reference Iijima94 Introductions to current work are contained in References Reference Pantelic, Suk, Magnuson, Meyer, Wachsmuth, Kaiser, Ruoff and Stahlberg11, Reference Mohanty, Fahrenholtz, Nagaraja, Boyle and Berry95, and Reference Pantelic, Meyer, Kaiser and Stahlberg96. Two example geometries for TEM supports are shown in Figure 7a–b, namely, graphene supporting the material of interest (here, a two-dimensional layer of silica glass) and graphene forming the walls of a nano-aquarium that contains nanoparticles in solution, respectively.
Graphene-based imaging platforms: (a–b) Schematics for using graphene as (a) a substrate for high-resolution imaging and (b) a container for small liquid cells. (c) Imaging a new two-dimensional SiO2 material on a graphene substrate (not visible because of its lower contrast) makes it possible to directly image the atomic structure of a glass by STEM. Bright spots represent the location of Si atoms (overlaid in red). The oxygen atoms (overlaid in blue) are not visible. The scale bar is 5 Å. (d) Imaging of nanoparticle coalescence in a graphene liquid cell. The scale bar is 2 nm. Parts (a) and (c) adapted from Reference Reference Huang, Kurasch, Srivastava, Skakalova, Kotakoski, Krasheninnikov, Hovden, Mao, Meyer, Smet, Muller and Kaiser90; parts (b) and (d) adapted from Reference Reference Yuk, Park, Ercius, Kim, Hellebusch, Crommie, Lee, Zettl and Alivisatos97.

Significant challenges for graphene substrates remain. Compared to conventional substrates, graphene is extremely difficult to handle. Suspended graphene is fragile and can be torn when handled or when samples are applied to it; standard cleaning methods for TEM samples such as plasma cleaning can destroy graphene membranes; and graphene is hydrophobic, making it difficult to interface with biological materials without prior functionalization.Reference Pantelic, Suk, Hao, Ruoff and Stahlberg98 Furthermore, graphene can sometimes be a poorer TEM substrate than ultrathin amorphous carbon, particularly if it is multilayered and turbostratic, nonuniform in thickness, or dirty. These attributes create a varying background signal that complicates image interpretation. As a result, preparing reliably clean, large-area suspended graphene remains the greatest challenge for widespread adoption of graphene substrates.
Despite these challenges, the current state of graphene substrates is promising, with significant recent progress in imaging both biological and materials systems. In biological TEM, one major challenge has been imaging low-contrast biological molecules without inducing electron-beam damage. Here, the low background from graphene facilitates low-dose, high-resolution imaging and has been applied to imaging DNA,Reference Pantelic, Suk, Magnuson, Meyer, Wachsmuth, Kaiser, Ruoff and Stahlberg11, Reference Cerf, Alava, Barton and Craighead99, Reference Nair, Blake, Blake, Zan, Anissimova, Bangert, Golovanov, Morozov, Geim, Novoselov and Latychevskaia100 bacteria and viruses,Reference Mohanty, Fahrenholtz, Nagaraja, Boyle and Berry95, Reference Pantelic, Suk, Hao, Ruoff and Stahlberg98 and organic–inorganic interfaces.Reference Lee, Jeon, Dato, Erni, Richardson, Frenklach and Radmilovic101 Materials studies using graphene substrates have been equally wide-ranging. Several studies have focused on the motion of adatoms or molecules on graphene,Reference Rodriguez-Manzo, Cretu and Banhart81, Reference Meyer, Girit, Crommie and Zettl102–Reference Zan, Bangert, Ramasse and Novoselov107 whereas others have investigated nanomaterials at high resolution, from metal nanoparticles to a two-dimensional silica glassReference Huang, Kurasch, Srivastava, Skakalova, Kotakoski, Krasheninnikov, Hovden, Mao, Meyer, Smet, Muller and Kaiser90 (Figure 7c). Finally, because graphene is an impermeable membrane,Reference Bunch, Verbridge, Alden, van der Zande, Parpia, Craighead and McEuen108 small volumes of liquid or gas can be trapped between graphene sheets, forming in situ environmental cells (Figure 7b and 7d). In two examples, graphene has been used to create microcells that limit the exposure of E. coli cells to vacuumReference Mohanty, Fahrenholtz, Nagaraja, Boyle and Berry95 and to image nanoparticle growth and coalescence in graphene-based liquid cellsReference Yuk, Park, Ercius, Kim, Hellebusch, Crommie, Lee, Zettl and Alivisatos97 (Figure 7d). The best of these studies using graphene substrates uncover new phenomena that are otherwise inaccessible.
Conclusions
(S)TEM has emerged as a powerful and versatile tool for characterizing and modifying graphene. It provides direct insights into the layer thickness and stacking, grain sizes and orientations, static deformations, topological defects, vacancy atomic configurations, grain-boundary structures, dislocations, and many more structural details, as well as microscopic access to electronic configurations. Many of the imaging tools developed for graphene can be applied to other two-dimensional materials,Reference Novoselov, Jiang, Schedin, Booth, Khotkevich, Morozov and Geim109 such as monolayer hexagonal boron nitride and molybdenum disulfide. Moreover, graphene is an ideal test sample for benchmarking electron microscopic techniques, and it can serve as a substrate for (S)TEM. Rapid developments in the fields of both electron microscopy and graphene can be expected to continue to provide a rich ground for new insights—from correlating microscopic structure with physical properties, to achieving precise material modifications, to enabling new in situ experiments.
Acknowledgments
P.Y.H. acknowledges support from a National Science Foundation (NSF) Graduate Research Fellowship under Grant DGE-0707428. Electron microscope facilities at the Cornell Center for Materials Research, an NSF MRSEC facility, are supported by NSF Grant DMR-1120296. We thank Melina Blees, Robert Hovden, and Arend van der Zande for their comments on the manuscript.