Introduction
Binocular vision, especially stereopsis, has been a major focus of attention in psychophysics and visual physiology for many years, but relatively little is known about its importance in the everyday tasks controlled by vision. We explore here the role of binocular vision in locomotion and obstacle avoidance, using monitored eye fixations as an index of the difference between monocular and binocular strategies.
It is generally acknowledged that binocular vision facilitates prehension tasks such as reaching and grasping performed with close targets (Servos et al., Reference Servos, Goodale and Jakobson1992; Marotta & Goodale, Reference Marotta and Goodale1998; Watt & Bradshaw, Reference Watt and Bradshaw2003; Loftus et al., Reference Loftus, Servos, Goodale, Mendarozqueta and Mon-Williams2004). The main effect of binocular viewing is to reduce the time taken for the task. Servos et al. (Reference Servos, Goodale and Jakobson1992) found binocular vision to be faster in both the initial stage of reaching and also during the later deceleration stage of the movement. They conclude that binocular vision is important for both planning reaching movements (feed-forward) and controlling them during the reach (feedback). Loftus et al. (Reference Loftus, Servos, Goodale, Mendarozqueta and Mon-Williams2004), however, argue, from both their own and previous data, that binocular vision is particularly advantageous when the hand is visible, indicating the importance of feedback from relative disparity between hand and target. For tasks carried out in the dark, where only a self-luminous target is visible but not the hand, they found that although monocular performance was worse than in full-cue conditions, it was not improved by adding binocular vision. They conclude that the absolute distance cues of vergence and vertical disparity are not weighted strongly in prehension and that binocular vision has little advantage in aiding the feed-forward component of reaching. However, it should be noted that their self-luminous targets were only 2 cm in diameter so that vertical disparity, the effectiveness of which depends on stimulus size (Bradshaw et al., Reference Bradshaw, Glennerster and Rogers1996), would be very weak. It may well be that with stronger vertical disparity cues (and better absolute distance perception), binocular vision may make a greater contribution to feed-forward processes in prehension.
There is less information concerning the role of binocular vision in locomotion and obstacle avoidance. Indeed, McKee et al. (Reference McKee, Levi and Bowne1990) claim that stereopsis would be too crude to be useful in a typical locomotion task requiring judgment of whether an aperture between two pieces of furniture is large enough to pass through. Although suprathreshold disparities abound even at far distances in natural scenes (Lui et al., Reference Liu, Bovik and Cormack2008), McKee et al.'s claim is based on measurements of the threshold precision for discriminating between different magnitudes of depth difference from a fixated target. For example, they estimated that when navigating between a table and a wall, the disparity increment threshold is such that, at distance of 2 m, a 24-cm aperture is confusable with 40-cm gap, even though a depth difference between table and wall is easily discernable. This could mean the difference between being able to fit through the aperture or not. The authors ask, “What use is stereopsis?” They conjecture that its primary use is to “guide fine movements of the hand.” They later add the second function of “breaking camouflage.” We will discuss McKee et al.'s threshold values later in relation to our own results.
The control of foot placement on a precise location in a terrain in some respects resembles the control of prehension with the hand. The same issues arise as to the relative importance of feedback (based on online monitoring of the relationship between the foot position and the desired stepping location) or feed-forward (preplanned movements of the foot based on looking at the desired location and then moving the foot to that location). One can ask what the contribution of binocular vision is to either of these processes or to their relative importance in the task. In one study, Loomis et al. (Reference Loomis, McBeall, Macuga, Kelly and Smith2006) showed that subjects were able to avoid virtual obstacles and intercept virtual objects equally well in cyclopean as in normal vision (in a virtual environment). This shows that purely stereoscopic information can be used for such tasks. However, they found no difference between monocular and binocular luminance-based vision in the virtual environment, so it is unclear from this experiment whether natural performance uses stereo cues. Locomotion has also been studied in association with eye fixations, which give a good indication of the observers’ strategies in picking up information to do the task. Hollands and Marple-Horvat (Reference Hollands and Marple-Horvat2001) in a task requiring stepping on irregularly placed stones and Patla and Vickers (Reference Patla and Vickers1997) in a task requiring stepping over obstacles both showed clear evidence for feed-forward processes in that observers fixated the obstacles or targets before but not during the stepping. These experiments were (presumably) done with binocular vision but did not compare performance between monocular and binocular vision. This comparison was first made by Patla et al. (Reference Patla, Niechwiej, Racco and Goodale2002). They conducted three experiments in which it was found that foot clearance in stepping over an obstacle was significantly higher in monocular vision than in binocular vision. There was no significant difference between monocular and binocular vision for other gait variables (measured with kinematic measures) or head-restrained and -unrestrained conditions. They found that the binocular advantage in foot clearance depended on binocular exposure during the beginning of the trial rather than during the step-over period. A switch to monocular viewing during the latter period had little effect. They conclude that binocular vision is essential for efficient feed-forward processes in locomotion. Feed-forward control of the step requires that the distance and direction of the desired location be available.
Patla et al.'s (Reference Patla, Niechwiej, Racco and Goodale2002) experiment addressed the role of binocular vision in estimating the height of obstacles for guiding the foot. However, it did not examine the situation described by McKee et al. (Reference McKee, Levi and Bowne1990), where subjects must guide the entire body through a gap and where those authors predict that stereo vision is unlikely to be useful. We therefore compared monocular and binocular performances in naïve subjects in a simple walking task, where subjects stepped over obstacles as well as walked through an aperture. Unlike previous studies, we examined gaze patterns during the task as an indicator of the strategies that subjects use while performing the task.
Materials and methods
Walking task
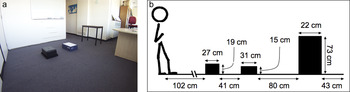
Subjects were required to walk along a short path, stepping over two obstacles of different height, and then walking around a small table that was close to a wall. After walking around the table, they returned to the starting point, stepping over the two boxes again on the way back. The total length of the path was about 7 m. The layout is illustrated in Fig. 1. The first box was about 1 m from the starting location, and the separation between the first and second boxes was 41 cm. The separation between the table and the wall was 43 cm. The back edge of the table was at a distance of about 3 m from the starting point. At this distance, the disparity between the table and the wall was approximately 9 min arc. If we estimate the increment threshold for disparity at 1 min arc on the basis of McKee et al.'s measurements, the 43-cm gap might be confused with either a 37- or a 48-cm gap, a level of uncertainty that might influence the decision to walk through the aperture. As the observer moves closer to the table, the uncertainty will of course decrease.
(Color online) The walking path. (a) Subjects started at the left near the wall, stepped over the two boxes, walked on the right side of the table, then between table and wall, and stepped over the boxes again on the return path to the starting point. (b) The height of the obstacles and table.

Eye tracking
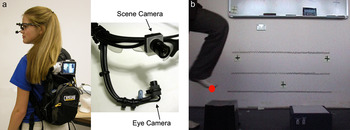
Eye movements were recorded using an RIT wearable tracker shown in Fig. 2a (Babcock & Pelz, Reference Babcock and Pelz2000). This is a light, fully portable, infrared (IR), video-based tracker that measures pupil and corneal reflection. This system uses a very lightweight glasses frame with an off-axis IR illuminator and a miniature, IR-sensitive CMOS camera to capture a dark-pupil image of the eye. A second miniature camera is located just above the right eye and is used to capture the scene from the subject's perspective. The field of view of the scene camera is 65 deg horizontally and 47 deg vertically. The glasses frame is very stable during observer movement and has been successfully used during activities such as squash (Chajka et al., Reference Chajka, Hayhoe, Sullivan, Pelz, Mennie and Droll2006). The tracker is designed for off-line analysis; raw video of the eye and scene are captured using the backpack or portable collection systems, while calibration and analysis are carried out after data collection. Following calibration, the data were analyzed frame-by-frame from the video record (recorded at 30 Hz) to identify location and duration of the fixations.
(a) (Color online) RIT wearable tracker. (b) Illustration of the point at which toe clearance was measured (see text).

A fixed video camera was used to record the trajectory of the feet as the subject stepped over the boxes in the path. The camera was located so as to give a lateral view of the foot stepping over the obstacles as shown in Fig. 2b. The red dot on the image shows the measurement of foot clearance measured from the top of the obstacle. This foot clearance value was measured, off-line, 16 times per trial (2 boxes × 2 edges-of-each-box × 2 feet × 2 directions) by analyzing still frames, at pixel level, in Adobe Photoshop, and averaged. Toe clearance values were measured in pixel units and then converted to centimeter units using a calibrated scaling procedure. A ruler was placed vertically at each corner of the two boxes and photographed from the identical lateral view. In this way, heights measured in pixel units could be translated into centimeters. This method of transformation also accounted for parallax error caused by differences in camera-to-target distances between the near foot and the far foot. Mean toe clearance values were calculated for each trial from the 16 measured values. Some trials, due to 30 Hz video footage, had missing data points for some clearance values. In these cases, means were calculated from the remaining data points.
Twenty-six subjects performed two monocular and two binocular trials in either a BMMB or an MBBM sequence. This order was counterbalanced across subjects. Some participants performed more than four trials—a trial was repeated if there was a problem, such as the eye tracking camera being bumped—so that there were four usable trials of eye tracking data. In cases where the problem was not seen to have an effect on foot height data, these extra foot height data were included in the calculation of means. A small square of black cloth was fixed to the subject's forehead with tape and could be raised and lowered to switch between monocular and binocular viewing without disturbing the position of the eye tracker on the subject's head. Data used for subsequent calibration were recorded at the beginning of the session by having subjects fixate nine marked locations in the scene. At the end of the trial, subjects refixated the set of nine calibration points in order to verify the validity of the calibration throughout the trial. The actual calibration was performed off-line subsequent to data collection and a new video record generated with gaze position superimposed. These calibrated videos were used for the analysis. (Since the calibration is performed subsequent to data collection, it is not possible to monitor how well a subject is being tracked during the experiment. Consequently, for eye movement analysis, we chose those eight subjects for whom the calibration was excellent.) Subjects initially stood facing the wall away from the path. When instructed, they turned and walked at a normal speed over the boxes, between the table and the wall, and then back over the boxes to the starting point. They were given no specific instructions except to walk at a normal speed. Subjects’ stereo acuity was measured using the Titmus test, and ocular dominance was also measured by having subjects sight down a tube.
Results
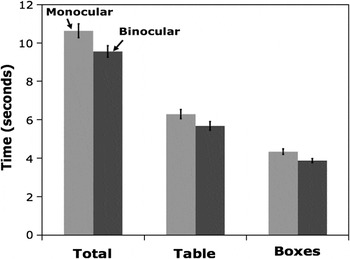
We first measured the time it took for subjects to complete the path. We measured the time when the lead foot passed over the front edge of box 1 until the rear foot passed over that edge on the return path. The total time was broken down into two components: the time to walk over the boxes and the time to walk around the table. The time to walk around the table was measured from the time the rear foot passed the back edge of box 2 until the lead foot passed the same edge on the return path. The time to walk over the boxes was the difference between the total time and the time to negotiate the table. (For each subject, the two monocular and the two binocular trials were averaged.) These times are shown in Fig. 3, averaged over the 26 subjects. There was roughly a 10% increase in time to complete the path in the monocular condition. Two-tailed, matched-pairs t-tests showed that both the total time and the component times were significantly different for the monocular and binocular conditions. For the total circuit time, the monocular condition took longer (10.6 s) than the binocular condition [9.6 s; t(25) = 4.35, P < 0.001]. Subjects in the monocular condition were slower (6.3 s) to walk around the table than in the binocular condition [5.7 s; t(25) = 3.50, P < 0.002]. They were also slower (4.3 s) to step over the boxes in the monocular than in the binocular condition [3.9 s; t(25) = 4.56, P < 0.001].
Time to walk over the boxes and around the table for the monocular (left) and binocular (right) conditions. The total time is the sum of the two components. Error bars are s.e.m. between subjects. N = 26.

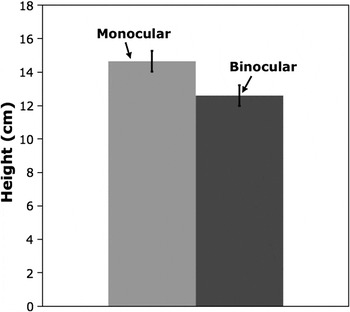
Another measure of performance is the height at which the subject's foot (the lead foot) clears the obstacles. This was measured as the height of the foot at the point when it crosses over the front edge of the box. Again, the values for the two monocular and the two binocular trials were averaged for each subject, and the average over subjects was then computed for monocular and binocular conditions. The data are shown in Fig. 4 and reveal that subjects raise their foot significantly higher in the monocular condition (14.65 cm box clearance) compared to the binocular condition [12.59 cm box clearance; t(25) = 4.22, P < 0.001].
Mean height clearance for the foot above the top of the box as it passes over the box for monocular (left) and binocular (right) conditions. Data are averaged for the two boxes, for front and back edges, and for both directions of walking. Error bars are ±1 s.e.m. between subjects. N = 26.

Eye movements
Fixation patterns of eight subjects were analyzed. These subjects had the most complete eye movement data with excellent calibration throughout the trial. (These subjects did not appear in any way atypical and were evenly divided between the two different orders: MBBM and BMMB.) Fixations were grouped into fixations on the obstacles (box 1, box 2, and the table), the floor in the vicinity of the obstacles, and “other,” which was usually a more distant part of the surrounding scene, in a region outside the subject's path. We differentiated between fixations on the forward and return paths. All fixations on a given obstacle were grouped and added to give total gaze duration on the obstacle.
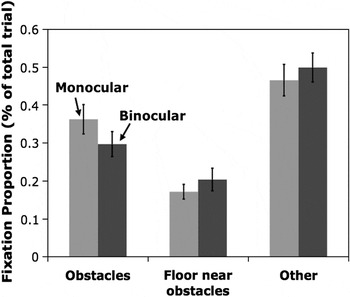
Typically, subjects begin the trial looking at the boxes. They then fixate the floor between the boxes and the table, then the table as they walk around it, then the floor, before refixating the boxes on the return path. Fig. 5 shows the proportion of the trial that was spent fixating the obstacles, the floor near the obstacles, and other regions in the scene. Subjects spend about a third of the time fixating the obstacles, about 20% of the time fixating the floor near where they are stepping, and the remainder of the time looking at other locations in the room, remote from the path. Subjects spent proportionately more time fixating the obstacles in the monocular condition. This difference is significant for the obstacles (P < 0.05) but not for the floor or other fixations. Note that the trial durations are longer in the monocular condition, but even when trial length is normalized, subjects spend longer on the obstacles. This suggests that longer fixations on the obstacles are used to compensate in some way for the reduction of information when only monocular vision is available.
Proportion of time fixating the obstacles and the path for monocular (left) and binocular (right) conditions. Error bars are ±1 s.e.m. between subjects. N = 8.

Fixation durations
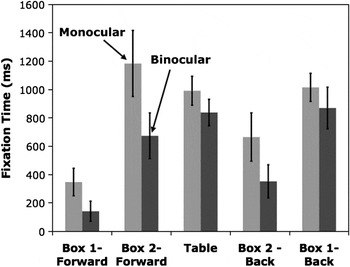
The increased time fixating obstacles in the monocular condition is reflected in the gaze durations on the individual objects. This is shown in Fig. 6, which shows total time spent fixating the boxes and the table. (Note that we scored the fixations on the outward and the return path separately.) In all cases, gaze dwells on the obstacles longer in the monocular condition. In the case of box 2, and also box 1 on the forward path, fixation times are nearly doubled. These differences were all significant (P = 0.016, 0.011, and 0.011, respectively). The differences were not significant for the table or box 1 on the return path.
Total time fixating the boxes and the table for monocular (left) and binocular (right) conditions. Error bars are ±1 s.e.m. between subjects. N = 8.

Fixation locations
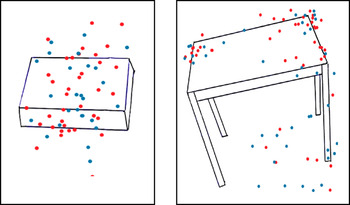
We also examined the distribution of gaze on the objects and found no obvious differences in the location of the object where gaze was directed. When approaching the boxes, subjects typically fixate the front edge of the box, the top of the box, and then the back edge. When negotiating the table, subjects fixated corners and edges almost exclusively. Typically, they looked at the front edge, near the side where they were about to walk, then moved to the corner on that side, or the side edge of the table, as they walked around the table. Gaze often moved to the back edge while they walked between the table and the wall. This suggests that subjects look at the parts of the obstacle that they would like to avoid. Fig. 7 shows a plot of fixation locations on box 2 and the table for the eight subjects. There is no obvious segregation of the fixation locations for the monocular and binocular conditions, and there is considerable variability in the exact location of the fixation.
Scatter plots of fixations on box 2 and on the table. Monocular condition is blue, and binocular is red. Fixations for eight subjects are shown.

Guiding foot placement
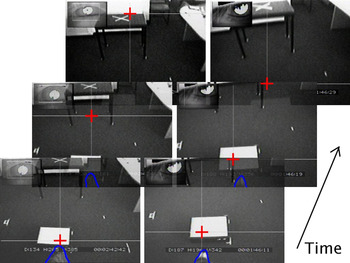
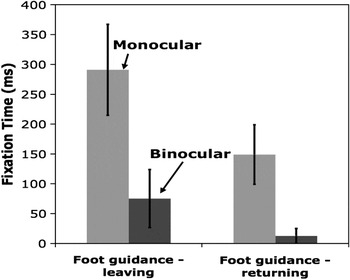
We observed one important difference in the fixation patterns on the obstacles. This difference was not in location per se but in the timing of the fixation relative to the body action. In binocular vision, when approaching the second box on the forward path, subjects fixate the front (vertical) surface of the box while still at a distance, before they step onto the floor in front of the box. Gaze then moves to the top of the box and subsequently to the floor beyond the box at the time when the foot is being lowered. This pattern, where gaze moves ahead of the current action, is typical of fixations while stepping over obstacles (Patla & Vickers, Reference Patla and Vickers1997). In the monocular condition, however, subjects kept gaze on the front surface of the box for an extended period, as the foot was lowered to the floor in front of the box. As the foot neared the floor, gaze then moved on to the top and then beyond the box. We called these fixations “Foot Guidance” fixations. They are illustrated in Fig. 8. In both cases, the subject initially fixates the front surface of the box as the foot begins to be lowered toward the floor. However, in the monocular case, on the right, gaze remains on the front surface 240 ms later, as shown in the middle panel. In the binocular condition, at this point, gaze has already moved on toward the table, as shown in the left panel. By 233 ms, gaze has moved to the back of the table in the binocular case, but in the monocular case, gaze does not move beyond the box until 300 ms. Thus, the eye lags behind in the monocular case, as more time is spent guiding the foot placement in front of the box.
(Color online) Illustration of the difference in foot guidance while stepping over the box, for binocular (left) and monocular (right) conditions. Fixation position is indicated by a red cross for three successive times. The blue outline indicates the foot/leg within some frames. Binocular condition images cover 233 ms, and monocular condition images cover 300-ms time period.

We classified trials where Foot Guidance occurred by identifying those trials where gaze remained on the front surface of the box while the foot was being lowered. (This was clearly visible in the video records.) Six out of the eight subjects examined exhibited Foot Guidance fixations. In monocular trials, Foot Guidance was observed in 60% of trials, whereas it was observed in only 15% of binocular trials. We also measured the duration of the fixations on the front surface in the period while the foot was being lowered. If gaze had already moved on, this time was recorded as zero. The average fixation times during foot guidance is plotted in Fig. 9. The small average values for the binocular trials reflect the preponderance of zeros, where foot guidance did not occur. The different gaze patterns suggest that in monocular vision, subjects are relying on feedback control of the step, whereas in binocular vision, the placement of the foot can be programmed on the basis of information from the initial fixation and executed under feed-forward control. The switch to feedback control in the monocular condition suggests that there is increased uncertainty about the location of the box with respect to the body, not just about its height.
Average foot guidance times for monocular, for binocular and monocular conditions. Error bars are ±1 s.e.m. between subjects, N = 8.

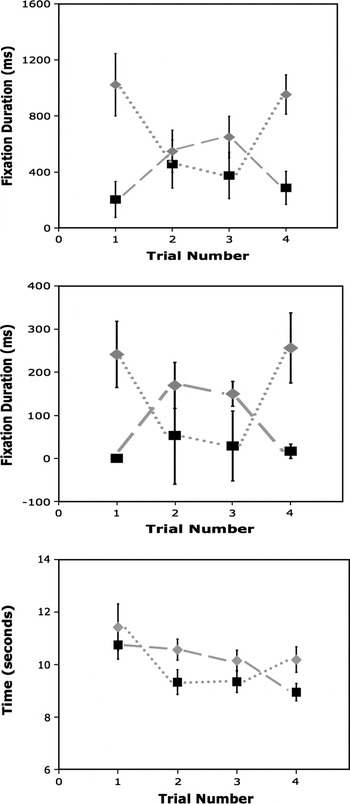
The effects of practice are of some concern in this experiment. Once a subject has walked the route in this experiment, there is an opportunity to use information acquired in the first trial to guide movements in subsequent trials. Ideally, subjects would have done only one trial, but this would have had the disadvantage of requiring a between-subjects comparison for the effects of monocular vision. Consequently, we chose to do a within-subjects comparison and to do four trials to counterbalance the order of conditions within subjects as well as between subjects. To investigate whether there were indeed any systematic carryover effects or diminution of the difference between conditions across trials, we plotted several of the measures as a function of trial number. This is shown in Fig. 10 for fixations on box 2, Foot Guidance fixations, and total trial duration. There is some tendency for the trial duration to decrease as a function of trial number, but the magnitude of the difference between monocular and binocular conditions does not decrease. Similarly, although there is some variability in the magnitude of the difference in the fixation time measures, there does not appear to be any trend for the difference to decrease over trials. Thus, we conclude that performance is largely based on the current trial and carryover effects from the previous trials are modest.
(A) Average fixation durations on box 2 as a function of trial number, for binocular and monocular conditions. Monocular is shown in light gray and binocular in dark gray. Dashed lines connect trials performed by the same group (MBBM for one group and BMMB for the other). (B) Average fixation durations during foot guidance, as a function of trial number. (C) Total trial duration as a function of trial number. Error bars are ±1 s.e.m. between subjects.

Discussion
To summarize, in a simple task where subjects walked along a short path over and around obstacles, performance in monocular vision was affected in a number of ways relative to normal binocular viewing. First, subjects took longer to perform the task, by about 10%. Subjects walked at about 1 m/s, a speed that is perhaps a little slower than normal unimpeded walking, presumably because of the need to negotiate the obstacles. The reduction in walking speed in monocular vision was observed for both aspects of the task, stepping over the obstacles and walking around the table and through the aperture. In this respect, the effect of monocular viewing is similar to the effect on reaching movements, where the reach is slowed (Servos et al., Reference Servos, Goodale and Jakobson1992; Loftus et al., Reference Loftus, Servos, Goodale, Mendarozqueta and Mon-Williams2004).
We also observed that subjects raised their foot higher by about 2 cm when stepping over the obstacles. This effect of elevating the foot higher was also observed by Patla et al. (2002), and the magnitude of the elevation we observed is very similar to theirs. Patla et al. argue that this increased foot elevation indicates a greater safety margin as a consequence of increased uncertainty, as opposed to a misperception of object height. We do not have a measure of variable error, since subjects performed only two trials of each type, so we cannot argue strongly on this issue. However, this seems like a reasonable interpretation, especially since the same argument has been made for the effect of monocular vision on prehension movements.
The location and sequence of the fixations made by subjects did not appear to differ in monocular and binocular vision. Subjects spend about a third of the time fixating the obstacles, about 20% of the time fixating the floor near where they are stepping, and the remainder of the time looking at other locations in the room, remote from the path. When fixating the boxes, subjects first fixated the front surface of the box, then the top surface, and then the back edge of the boxes in both conditions. It is possible that subjects are getting information about the location of the front of the box relative to the body from the front surface fixation, about box height from the top surface fixation, and about location of the back edge with respect to the body from the back edge. When moving around the table, subjects first fixate the front edge, near the side they are approaching, then the corner or side, and then the back edge as they walk between the table and the wall. Fixating obstacles while avoiding them appears to be a natural strategy. For example, Rothkopf et al. (Reference Rothkopf, Ballard and Hayhoe2007) observed that subjects fixate the edge of an obstacle they must avoid while walking down a path in a virtual environment. When subjects were required to walk through objects in the path, they fixated the center. In a different task where subjects picked up a wooden block and moved it up and around an obstacle, subjects also fixated the point on the obstacle that the block must be moved around (Johansson et al., Reference Johansson, Westling, Bäckstrom and Flanagan2001).
Although the location of the fixations did not change in monocular vision, the timing of the fixations relative to the actions was different. First, we found that subjects spent proportionately more time fixating the obstacles (47% as opposed to 39%) as opposed to other regions in the path (such as the floor or the surroundings). Thus, subjects looked at the obstacles longer, even after accounting for reduced walking speed. We cannot tell from this observation exactly why subjects need to look at the obstacles for longer. Presumably, as has been argued both by Loftus et al. (Reference Loftus, Servos, Goodale, Mendarozqueta and Mon-Williams2004) and by Patla et al. (Reference Patla, Niechwiej, Racco and Goodale2002), it reflects increased uncertainty in monocular vision. A stronger statement can be made about the foot guidance fixations, where the fixations appear to indicate increased reliance on feedback control of the movements. When stepping over the second box, subjects maintained gaze on the front edge of the box for an extended period, while the foot was being lowered, when only monocular vision was available. Note that on the return path, the same behavior was observed for the step in between box 2 and box 1, but now the prolonged fixation is on box 1. Presumably, the limited space between the two boxes required subjects to exercise more control over the exact placement of the foot, so that it did not touch either box. Since this step occurs before the step over the box, it may indicate difficulty in estimating the exact location of the box with respect to the body. This result differs from that of Patla et al. (Reference Patla, Niechwiej, Racco and Goodale2002), who found no differences in a variety of kinematic parameters of the step over an obstacle with monocular vision. On the basis of his data, they concluded that the effect of monocular vision was primarily on the estimation of the box height and that this was used in a feed-forward manner to control height of the step over the obstacle. However, they did not examine the placement of the foot prior to the step.
Although loss of stereoscopic information, including horizontal and vertical disparity, and vergence information is the most likely source of the differences between monocular and binocular vision that we observed, there are other possible factors that may be involved. One factor is the reduced field of view occasioned by occlusion of one eye. Patla et al. (Reference Patla, Niechwiej, Racco and Goodale2002) ascribe some of the effects they observed in stepping over an obstacle to this factor. It seems unlikely to be a significant factor in our experiment, however. We mapped out the visible field of view when the left eye was occluded and the head was in the normal posture for stepping over the first obstacle. The region where the subject walked was entirely visible, including the obstacles and the legs and feet, and the visible field extended more than 20 deg to the left of the obstacles. Small parts of the field were occluded by the eye camera and scene camera, but these, too, were outside the region occupied by the boxes and table. It is possible that Patla observed an effect of monocular occlusion on head tilt as the field of view was made smaller overall by the shutter goggles worn by the subject.
Another possible cause for the effect of monocular vision may be the loss of binocular summation of some kind. Loss of either probability summation or brightness summation does not seem a likely explanation either, since targets were easy to detect and of high luminance and contrast. Jones and Lee (Reference Jones and Lee1981) have claimed an advantage for binocular vision in a variety of tasks even when stereopsis is not available, which they attribute to binocular concordance or “the matching of information in the monocular arrays.” It is not clear how this advantage would work. As McKee et al. (Reference McKee, Levi and Bowne1990) point out, their conclusion depends on the unwarranted assumption that stereopsis is not functional at low luminance levels and thus cannot account for the superior binocular performance at these levels. More relevant to the present study is a comparison of prehension performance under three viewing conditions: monocular, binocular, and biocular (identical images to the two eyes) by Bradshaw et al. (Reference Bradshaw, Elliott, Watt, Hibbard, Davies and Simpson2004) using a range of prehension measures. They found that biocular performance closely resembled monocular performance, with binocular (presumably stereoscopic) performance considerably better. It has to be kept in mind, though, that biocular vision may misleadingly indicate no stereoscopic depth differences. Nevertheless, given these findings, it does not seem probable that the superiority of binocular performance we found is the result of both eyes having concordant monocular information. It is also possible that there is a criterion shift of some kind associated with the monocular condition. If subjects become more cautious, such an effect might mimic effects of increased sensory uncertainty. We cannot discount such effects, but the modest variability between subjects argues (weakly) against it, and an increase in caution following occlusion of one eye might also attest to some implicit knowledge that binocular vision is advantageous. It thus appears that stereo vision is likely to be important for various aspects of locomotion, both stepping over obstacles and walking around objects and through apertures. Although the discrimination thresholds measured by McKee et al. (Reference McKee, Levi and Bowne1990) may make it difficult to judge the size of the aperture when subjects are at a distance, the movement plan may not be initiated at that point but rather be deferred until the subject is closer to the table. Although the table is approximately 2.8 m distant at the beginning of the path, it is less than a meter distant after the subject has stepped over the second box. At a distance of 1 m, for example, stereo discrimination will be much improved and leave a residual uncertainty of ±0.5 cm for a 43-cm gap, which should be adequate for planning the movement through the aperture. In addition, the fixations on the table during this part of the movement indicate that the movement is monitored by feedback until the subject is roughly halfway through the gap. Similarly, when subjects are close to the boxes, a difference of height of 0.5 cm translates into a 1- to 4-min arc disparity change at a distance of between 1.0 and 0.5 m. These disparities are well above threshold. When stepping over obstacles, subjects typically fixate about a step ahead, as described also by Patla et al. (Reference Patla, Niechwiej, Racco and Goodale2002), and are presumably using a feed-forward strategy in the binocular case.
In conclusion, binocular, and by inference, stereoscopic vision facilitates walking over and around obstacles. The data are consistent with greater uncertainty in monocular vision, leading to a greater reliance on feedback control of the movements and a 10% reduction in walking speed. The effects on performance are relatively subtle, so that observers may not be aware of the visuomotor compensations that they make.
Acknowledgments
This work was supported by National Institutes of Health grant EY05729.