Implications
Genomic selection has become an useful tool for animal and plant breeding. Accuracy of genomic prediction is influenced by several factors. Among of them, the response variable plays an important role. Currently, the de-regressed proof (DRP) of the traditional estimated breeding value (EBV) is commonly used as response variable. However, our results show that the accuracy and bias are influenced by computing methods, parental information, progeny information, etc. This study will be helpful for the choice of response variables in practical genomic selection.
Introduction
Ever since Meuwissen et al. (Reference Meuwissen, Hayes and Goddard2001) proposed genomic selection, its merit in animal and plant breeding has gradually gained recognition and it has played an important role in practical breeding. The general process of genomic selection involves first establishing a reference population using animals with single or multiple phenotype records and genotyped with single nucleotide polymorphism (SNP) chip, then estimating the marker effect of each SNP based on the information of reference population. The genomic estimated breeding values (GEBV) of the candidate individuals (usually only the genotypes of SNP chip available) are thereafter predicted as the summation of corresponding SNP effects, the candidate individuals could be selected according to their GEBVs. Target phenotypic values of reference population are usually called response variable, and studies have indicated that selection and calculation of different types of response variable can affect the accuracies of genomic prediction (Goddard and Hayes, Reference Goddard and Hayes2007; Meuwissen, Reference Meuwissen2009). In real situation, different response variable for genomic selection are used. The four most commonly used are direct observed value, EBV, DRP, and daughter yield deviation (DYD) (Loberg and Dürr, Reference Loberg and Dürr2009). Of these, the direct observed value has difficulties to be implemented in genomic selection even if it is preferable to any other values, because the abundant and complex information it contains requires large amounts of calculation and adjustment. However, the single-step approach (Misztal et al., Reference Misztal, Legarra and Aguilar2009; Christensen and Lund, Reference Christensen and Lund2010) make the direct observed value easier to be implemented and more attractive in genomic prediction. The drawback of using EBV as response variable is that the repeated use of pedigree information may cause bias (Israel and Weller, Reference Israel and Weller1998). To avoid the problem of double counting of parental information in EBV, DYD and DRP derived from the traditional EBV as response variables were proposed. The DYD of a bull is the average of the daughters’ actual performance adjusted for fixed effects, non-genetic random effects, and the effects of daughter’s dams. Theoretically, the use of DYD has resolved the issues of double counting because it counteracts repeated use of pedigree information (Israel and Weller, Reference Israel and Weller1998; Ma et al., Reference Ma, Lund, Ding, Zhang and Su2014). Currently, DRP is the most widely used as response variable (Loberg and Dürr, Reference Loberg and Dürr2009). The DRP is similar to DYD, the method was first proposed by Jairath et al. (Reference Jairath, Dekkers, Schaeffer, Liu, Burnside and Kolstad1998), is mainly used in dairy cattle. Its calculation is a little complicated because it requires not only EBV information from both parents but also the information regarding the bull’s effective daughter contribution (EDC). This calculation is complicated when EDC becomes burdensome when large numbers of cows are included in the reference population, that is the reference population of Chinese Holstein mainly comprised cows (Ding et al., Reference Ding, Zhang, Li, Wang, Wu, Sun, Yu, Liu, Wang, Zhang, Zhang, Zhang and Zhang2013). This is also true for other livestock, such as in pig. Garrick et al. (Reference Garrick, Taylor and Fernando2009) proposed a relative simplified method, which only requires complete information regarding breeding values from parents and EDC is not needed. However, it is not clear which of the two methods is superior. In this study, the accuracy and bias of these two methods for calculation of DRP was compared.
Material and methods
Data
Simulated data
The simulated data used in this study was from the 16th QTL-MAS workshop (http://qtl-mas-2012.kassiopeagroup.com/en/dataset.php), which included 4100 individuals with genotype data of 10 000 SNP in five chromosomes. Simulated data had three traits with the heritabilities of 0.3, 0.25 and 0.23, respectively. Only 3000 individuals in the first three generations had phenotypic values corresponding to the three traits, and the true breeding values (TBV) of all 4100 individuals were available.
Chinese Holstein cattle data
The genomic selection in Chinese Holstein cattle has being carried out since 2009. In this study, four milk production traits, including milk yield (MY), fat percentage (FP), protein percentage (PP) and somatic cell score (SCS) were selected. The official estimated breeding values of the four milk production traits were provided by the Dairy Association of China. Genotyping was performed using the BovineSNP50 chip containing 54 609 SNP from Illumina (Illumina, San Diego, CA, USA). Missing genotypes of SNPs with known chromosomal positions were imputed by BEAGLE (Browning and Browning, Reference Browning and Browning2009), and those with unknown position were discarded. Based on the imputed data set, SNPs were excluded from the analysis if the minor allele frequency was <0.01, the call frequency score was <0.90, or the genotype frequencies deviated from Hardy–Weinberg equilibrium with a P-value lower than 10−7. The animals with call rate <0.90 were also excluded, in addition, the individuals with reliability of EBV <0.3 were removed as well. After quality control, all genotyped individuals remained and 52 869 SNPs were finally used.
Methods
Estimation of breeding values
In simulated data, the pedigree-base breeding values for each trait were estimated using single-trait animal model, as follows:
 $${\bf{y}} \,{\equals}\,{\bf{Xb}} {\plus}{\bf{Za}} {\plus}{\bf{e}} $$
where y is the vector of phenotypic values; b the vector of fixed effects including year and season; a represents the vector of additive genetic effect, following a normal distribution N(0, A
 $\sigma _{a} ^{2} $
) with
 $\sigma _{a} ^{2} $
being the additive genetic variance and A is the pedigree-based relationship matrix of individuals. X and Z are the corresponding incidence matrix associating b and a with y, respectively. e is the vector of random residual effect which follows a normal distribution
 ${\rm N}(0,{\rm }{\bf I}\sigma _{e} ^{2} )$
with
 $\sigma _{e} ^{2} $
being residual variance and I an identity matrix.
Calculation of de-regressed proof
Two methods proposed respectively by Jairath et al. (Reference Jairath, Dekkers, Schaeffer, Liu, Burnside and Kolstad1998) and Garrick et al. (Reference Garrick, Taylor and Fernando2009) were implemented to calculate DRP, and they were abbreviated as DRP_J and DRP_G throughout the study. The EBV and pedigree information are needed for both DRP_J and DRP_G, in addition, the EDC is also required by DPR_J. The EDC was calculated as k×r 2/(1−r 2), where r 2 is the reliability of DRP of each individual, and k is (4−2h 2)/h 2, where h 2 is the heritability of trait.
Estimation of genomic breeding values
Genomic BLUP (GBLUP) was implemented to predict GEBV for each genotyped individual. For GBLUP, the GEBV of all genotyped individuals were predicted by solving the mixed model equations based on the following model:
 $${\bf y}\,{\equals}\,1{\bf \mu }{\plus}{\bf Zg}{\plus}{\bf e},$$
where y is the vector of response variable of genotyped reference cows, that is, EBV or DRP (DRP_J or DRP_G), μ the overall mean,1 the vector with all elements of 1, and Z the incidence matrix associating g with y; g the vector of additive genetic effects of all genotyped animals which follows a normal distribution of
 ${\rm N}(0,{\rm }{\bf{G}} \sigma _{g} ^{2} )$
with
 $\sigma _{g} ^{2} $
being the additive genetic variance and G the genomic relationship matrix. Following VanRaden (Reference VanRaden2008), the G matrix was constructed using all markers as
 $${\bf{G}} {\equals}{\bf MM}^{'} /\sum 2p_{i} (1{\minus}p_{i} )$$
, where p
i
is the second allele frequency at locus i, and M is a n×m matrix (n=number of animals, m=number of marker ) with values in the ith column equal to 0−2p
i
for genotype 11, 1−2p
i
for genotype 12, and 2−2p
i
for genotype 22;
e
the vector of random residuals following a normal distribution
 ${\rm N}(0,{\rm }{\bf{D}} \sigma _{e} ^{2} )$
with
 $\sigma _{e} ^{2} $
being residual variance and D a diagonal matrix with d
ii
=1/w
i
, where
 $w_{i} {\equals}r_{i}^{2} \,/\,(1{\minus}r_{i}^{2} ){\rm }$
(
 $r_{i}^{2} $
is the reliability of DRP_J or DRP_G of individual i). Garrick et al. (Reference Garrick, Taylor and Fernando2009) further proposed w
i
=(1−h
2)/[(c+(1−r
2)/(r
2))×h
2], where c represents the proportion of genetic variance unexplained by markers. For convenience, weights with c (Garrick et al., Reference Garrick, Taylor and Fernando2009) and only with reliability of DRP (Jairath et al., Reference Jairath, Dekkers, Schaeffer, Liu, Burnside and Kolstad1998; VanRaden, Reference VanRaden2008) were termed as w
rch
and w
r
for the weighing of diagonal elements of D matrix. For EBV being response variable, the weighing of diagonal elements of D matrix was
 $w_{i} {\equals}1\,/\,(1{\minus}r_{i}^{2} )$
as suggested by Su et al. (Reference Su, Guldbrandtsen, Gregersen and Lund2010), where
 $r_{i}^{2} $
is the reliability of EBV.
In this study, the pedigree-base breeding values and genomic-base breeding values were calculated using DMU software (Madsen et al., Reference Madsen, Jensen, Labouriau, Christensen and Sahana2014). And in the calculation of GEBV, two kinds of weights for d ii as described above were used for constructing D matrix in both simulated data and Chinese Holstein data. In the meantime, 10 values of c between 0.01 and 0.9 were used to evaluate the impact of the proportion of genetic variance unexplained by markers on the genomic prediction in the simulated data.
Reference and validation population
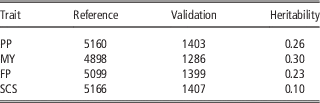
In this study, the animals from Chinese Holstein, which were born before 2008 were chosen as the reference population, those born in and after 2008 served as the validation population. The reference and validation population size in four milk production traits is shown in Table 1.
The reference and validation population size and heritability of four milk production traits in Chinese Holstein for genomic prediction

MY=milk yield; FP=fat percentage; PP=protein percentage; SCS=somatic cell score.
As to the simulated data, 1800 individuals from the first three generations as the reference population and 220 individuals from the 4th generation were chosen as the validation population.
The de-regression of EBV to DRP requires the information of EBV and its reliability for both animals and their parents. However, in livestock such as cattle and pigs, the parent information, especially the dam information, is often missing, for example the dam information is absent about 10% to 20% in Chinese Holstein. For this reason, in this study, the 2020 animals in the simulated data were assigned five levels of dam missing: 5%, 10%, 15%, 20% and 25%, in order that the effect of dam missing information on the calculation of DRP and on the accuracy of GEBV could be explored. Reference and validation groups were defined and divided as described above.
Evaluation of accuracy of genomic estimated breeding value
In this study, for real data of Chinese Holstein, the accuracy of genomic prediction was evaluated as the correlation between GEBV and DRP r(DRP, GEBV) in the validation population, corrected with respect to the accuracy (square root of reliability) of average DRP, that is, r v =(r GEBV, DRP)/(r DRP) (Aguilar et al., Reference Aguilar, Misztal, Johnson, Legarra, Tsuruta and Lawlor2010). In addition, bias of genomic prediction was quantified using the deviation of the coefficient of regression of DRP on GEBV, b(DRP,GEBV) from 1. For the simulated data, r(TBV, GEBV) and b(TBV, GEBV) in the validation population were used to assess the accuracy and bias of genomic prediction. In the same scenarios, the Hotelling–Williams Test (Steiger, Reference Steiger1980) was carried out to compare the difference of the accuracy of genomic prediction from different response variable.
Results
Descriptive statistics of estimated breeding value and de-regressed proof
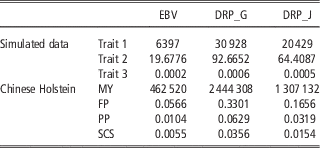
Table 2 reports the variance of EBV and two DRP (DRP_J and DRP_G). In both simulated and Chinese Holstein data, the variances of EBV for all traits were smaller than the variances of DRP. The variances of DRP derived from Garrick’s method (DRP_G) were the largest.
Variances of estimated breeding value (EBV) and de-regressed proof calculated using Garrick’s (DRP_G) and Jairath’s (DRP_J) methods, respectively

MY=milk yield; FP=fat percentage; PP=protein percentage; SCS=somatic cell score.
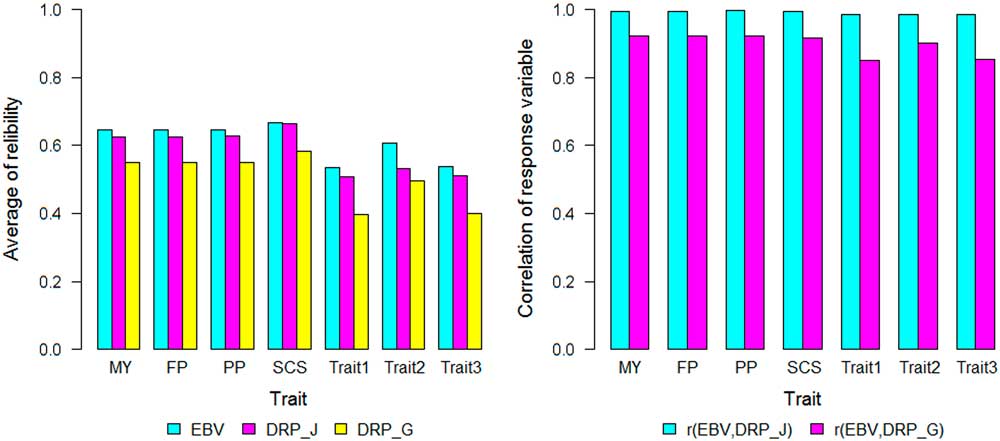
The reliability of EBV and DRP and the correlation between DRP and EBV in simulated and Chinese Holstein are shown in Figure 1. Regardless of whether simulated or real data, the average reliability of EBV was the highest. The reliability of DRP_J was very close to that of EBV and the reliability of DRP_G was the lowest. For EBV and DRP_J, the average reliabilities for four milk production traits of Chinese Holstein were about 0.65 and 0.64, for simulated traits were 0.56 and 0.52, respectively, while those achieved by DRP_G were 0.10 to 0.20 lower. Compared with DRP, EBV had smaller variance but higher reliability. Figure 1 also shows that after EBV was de-regressed, two DRP values (DRP_J and DRP_G) were closely correlated with EBV, the correlations ranged from 0.851 to 0.995. Under the same condition, DRP_J showed higher correlation with EBV than DRP_G did, indicating that DRP_J was closer to EBV.
(colour online) Averaged reliability of estimated breeding value (EBV), de-regressed proof respectively calculated from Garrick’s (DRP_G) and Jairath’s (DRP_J) method and their correlation between each other.

The impact of c on the genomic prediction
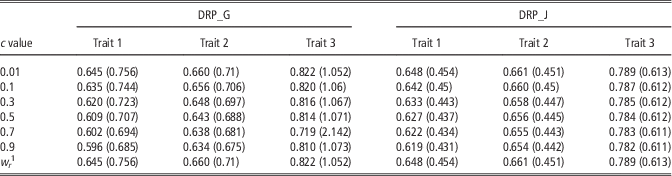
Table 3 shows the impact of c, the proportion of genetic variance unexplained by markers, on the genomic prediction, c was used in the weights diagonal elements of D matrix as suggested by Garrick et al. (Reference Garrick, Taylor and Fernando2009). When c increased from 0.01 to 0.9, for both DRP_G and DRP_J, the r(TBV, GEBV) decreased and b(TBV, GEBV) gradually deviated further from 1.0 indicating accuracy and unbiasedness of genomic prediction worsened with increasing the proportion of genetic variance unexplained by markers. Meanwhile, in the same scenario, DRP_J yielded a little higher accuracy than DRP_G on the trait 1 and trait 2, but lower accuracy on the trait 3. However, the bias obtained by DRP_J was larger on all the three simulated traits, particularly on the trait 3, DRP_G produced higher accuracy and the coefficient of regression was very close to 1.0. One exception is that DRP_G produced lower accuracy of (0.719) and much larger bias (2.142) on trait 3 in the scenario of c being 0.7.
Correlations of genomic breeding value (GEBV) with true breeding value (TBV) and regression of TBV on GEBV (parentheses) with different proportion of genetic variance unexplained by markers (c) in simulated data

1 w r represents weighting diagonal elements of incidence matrix of residual error using reliability of DRP only in estimation of genomic breeding values.
Compared to the weights w rch , which took c into account for diagonal elements of D matrix, the weights w r, where only reliability of DRP was used, yielded the highest accuracy and the least bias in genomic prediction, it was equal to the performance of w rch at c close to 0 (0.01), while the estimated c was 0.207, 0.212 and 0.333 in simulated data according to the method in Haile-Mariam et al. (Reference Haile-Mariam, Nieuwhof, Beard, Konstatinov and Hayes2013), and the accuracy was lower and bias was larger in that case, indicating w r performed better in the calculation of diagonal elements in the D matrix for estimating genomic breeding values.
Comparison of estimated breeding value, DRP_J and DRP_G with simulated data
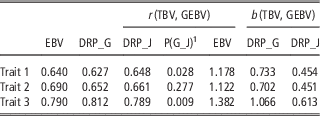
Table 4 further demonstrates the accuracy and unbiasedness of genomic prediction when EBV, DRP_J and DRP_G served as response variables in the simulated data set. Estimated c of 0.207, 0.212 and 0.333 were used. DRP_J, EBV and DRP_G produced the highest accuracy on trait 1, trait 2 and trait 3, respectively. Both DRP performed comparably on trait 2.
Correlations of genomic estimated breeding value (GEBV) with true breeding value (TBV) and regression of TBV on GEBV using estimated proportion of genetic variance explained by markers in simulated data

1 P(G_J) represents the P values for r(TBV, GEBV) achieved when DRP_J and DRP_G were used as response variable by Hotelling-Williams Test.
Table 4 also shows that EBV yielded large bias as DRP_G and DRP_J. When EBV was used as the response variable, the b(TBV, GEBV) was >1.0 in all situations, ranging from 1.178 to 1.382 with 0.227 on average deviated from 1.0. In contrast, when DRP_G and DRP_J served as a response variable, the b(TBV,GEBV) ranged 0.702~1.066 with 0.210 on average deviated from 1.0 for DRP_G, and 0.451~0.613 with 0.494 on average deviated from 1.0 for DRP_J. The bias obtained by DRP_J was worse.
Comparison of estimated breeding value, DRP_G and DRP_J with Chinese Holstein data
We also compared the performance of EBV, DRP_J and DRP_G in the genomic prediction using Chinese Holstein data. Table 5 lists the accuracy and unbiasedness of genomic prediction in the validation population. DRP_J performed the best in accuracy, DRP_J produced 0.11 and 0.04 higher accuracy than DRP_G and EBV on average for all four milk production traits. The largest superiority of DRP_J was 0.131 and 0.039 on FP and SCS compared DRP_G and EBV, and lowest was 0.064 and 0.005 on SCS and MY. For the weights of diagonal elements of D matrix, when w rch was used, the estimated c was 0.189, 0.171, 0.165 and 0.154 for MY, FP, fat protein and SCS, respectively. However, either for DRP_J or for DRP_G, no difference was found between two weights methods in the view of accuracy.
Accuracy and unbiasedness (parentheses) of genomic prediction for milk production traits in Chinese Holstein cattle using different response variable

EBV=estimated breeding value; MY=milk yield; FP=fat percentage; PP=protein percentage; SCS=somatic cell score.
w
rch
and w
r
represent two methods for weighting diagonal elements of incidence matrix of residual error in estimation of genomic breeding values; w_EBV, the weighing of diagonal elements was
 $w_{i} {\equals}1\,/\,(1{\minus}r_{i}^{2} )$
, where
 $r_{i}^{2} $
is the reliability of EBV.
The accuracy within same row with different superscript a, b indicates significant difference by Hotelling-Williams test.
As to the bias of genomic prediction, DRP_J yielded lower bias compared EBV and DRP_G on MY, PP and FP, the average deviation of regression from 1.0 on these three traits was 0.119, 0.146 and 0.20 for DRP_J, EBV and DRP_G, respectively. However, the bias on SCS obtained by EBV was much larger than DRP_G and DRP_J.
For the two weighing methods of D matrix, bias from w rch were equal to or slightly larger than those from w r for DRP_G, and w r performed better for DRP_J as well, that is w r yielded the regression coefficient 1.039 and 0.594 on trait PP and SCS, while 0.848 and 3.154 were obtained by w rch , respectively. Obviously, bias from w rch was higher and unstable.
Effect of missing dam information on de-regressed proof and genomic prediction
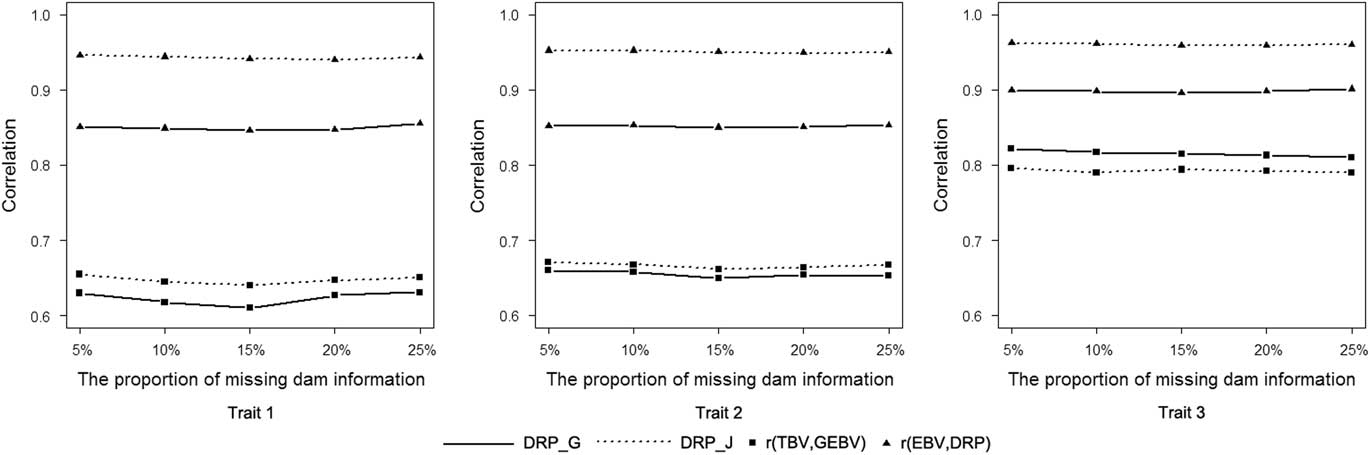
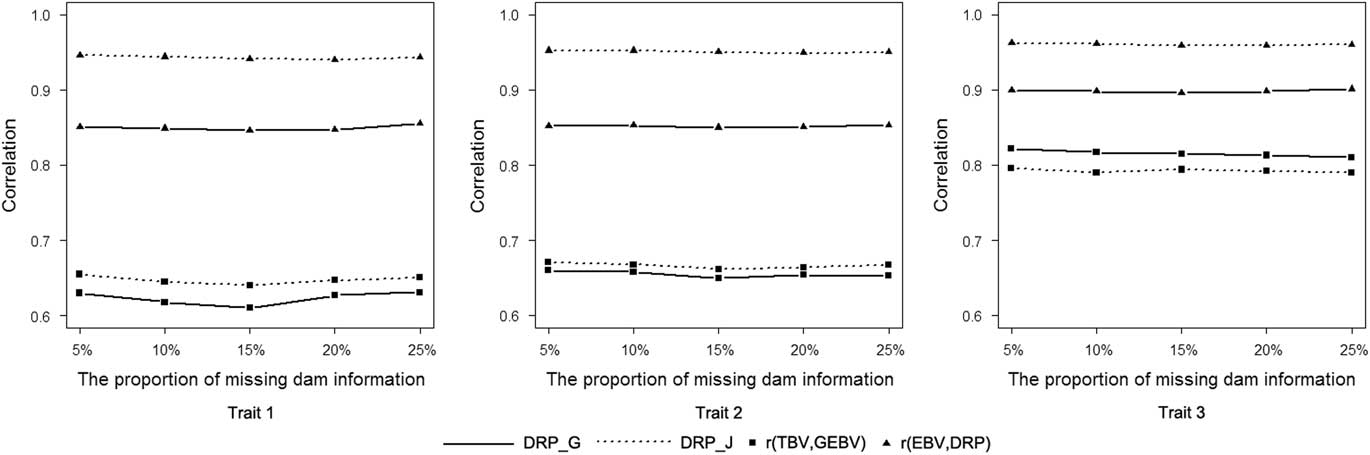
As shown in Figure 2, the correlations of EBV with DRP_J were higher than with DRP_G. The correlations between EBV and DRP_J/DRP_G were not affected by the missing proportion of dam information. Consequently, Figure 2 further shows the correlation of GEBV with TBV in different missing levels of dam information when DRP_J and DRP_G were used as response variables. In the case of DRP_G, when the proportion of missing dam information was increased from 5% to 25%, there was a trend toward decreased accuracy for all three traits, but no significant difference was found overall. The influence of missing dam information on DRP_J was as same as DRP_G. As demonstrated in Figure 2, there was no significant difference in the accuracy of genomic prediction between DRP_J and DRP_G, and DRP_G produced slightly higher accuracy for trait 3.
Correlations of genomic estimated breeding value (GEBV) with true breeding value (TBV), and estimated breeding value (EBV) with de-regressed proof (DRP) at different proportions of missing dam information in simulated data by using DRP_G and DRP_J as response variables.
Discussion
In this study, two methods of de-regressed proof of EBV, DRP_J (Jairath et al., Reference Jairath, Dekkers, Schaeffer, Liu, Burnside and Kolstad1998) and DRP_G (Garrick et al., Reference Garrick, Taylor and Fernando2009) were compared on the efficiency of genomic prediction. Our results showed that removing shrinkage and parent average, higher variance and smaller reliability of DRP was yielded as expected, which is also consistent with the study by Guo et al. (Reference Guo, Lund, Zhang and Su2010). Although close correlations between DRP by using both DRP methods and EBV could be achieved, the DRP_J showed a closer correlation with EBV than DRP_G did, suggesting that DRP_J is more similar to EBV.
When EBV is used as response variable to predict GEBV, the double counting of pedigree information can cause bias of GEBV. Theoretically speaking, since DRP can overcome the issue of double counting, it is supposed to have lower bias of genomic prediction, while our results reported no significant advantage as such (Tables 4 and 5), which is consistent with the study by Gao et al. (Reference Gao, Lund, Zhang and Su2013). However, using EBV as response variable would result in problems with the scale of the resulting GEBV as pointed out by Gao et al. (Reference Gao, Lund, Zhang and Su2013). Usually, the accuracy of genomic prediction achieved by using DRP as response variable is lower than EBV due to the decreased use of information (Guo et al., Reference Guo, Lund, Zhang and Su2010; Gao et al., Reference Gao, Lund, Zhang and Su2013). While in this study, use of EBV as a response variable generated highest correlation of GEBV with TBV only on simulated trait 3 and lower accuracy on the other two traits. One explanation is the final genomic evaluation includes information from relatives through the shared genotypes, so information is not really lost by using DRP as the response variable. In addition, in some implementations, the final GEBV includes a contribution from relatives that are not genotyped, a single-step genomic BLUP (ssGBLUP) has been developed by construction H matrix using marker genotypes and pedigree jointly instead of G matrix or pedigree–base relationship alone (Legarra et al., Reference Legarra, Aguilar and Misztal2009; Aguilar et al., Reference Aguilar, Misztal, Johnson, Legarra, Tsuruta and Lawlor2010; Christensen and Lund, Reference Christensen and Lund2010).
In the genomic prediction of Chinese Holstein cattle, DRP_J outperformed DRP_G in view of accuracy and unbiasedness. It was different from the findings using the simulated data, in which DRP_J had larger bias in all situations and significant higher accuracy on trait 1 only. Our results indicated that although the general idea of DRP_G and DRP_J is similar, the difference in their calculation leads their performance depends on traits, heritability and data structure, etc.
In the estimation of GEBV, the vector of residual error followed a normal distribution
 ${\rm N}(0,{\rm }{\bf{D}} \sigma _{e} ^{2} )$
, where D was originally an identity matrix, which did not account for heterogeneous residual variances due to different reliabilities of DRP, inferior animals tend to be overestimated, while superior animals tend to be underestimated (VanRaden, Reference VanRaden2008; Garrick et al., Reference Garrick, Taylor and Fernando2009). VanRaden (Reference VanRaden2008) and Garrick et al. (Reference Garrick, Taylor and Fernando2009) separately proposed the weighting diagonal elements of D matrix, both which weighted the identity using the reliability of response variable of individuals. In addition, the heritability of trait and the proportion of genetic variance unexplained by markers were also taken into account by Garrick et al. (Reference Garrick, Taylor and Fernando2009). Given the fixed heritability, our results showed the proportion c had significant effect on the accuracy of genomic prediction using simulated data. With increasing the proportion c, the accuracy of genomic prediction was decreased and the bias was increased. When c was very close 0, indicating all the genetic variance was captured by markers, the accuracy of genomic prediction was highest and the bias was smallest. Actually the estimated c was about 0.20~0.30 for three traits, which did not yield the highest performance. Interestingly, diagonal elements of D matrix weighted using the reliability of response variable only was comparable with using c being 0.01. Moreover, considering proportion c in the weights of diagonal elements of D matrix could sometimes lead to larger bias for both DRP_G and DRP_J (Tables 3 and 5). Generally, weighting by the reliability of response variable is more stable.
Considering the de-regression of EBV to DRP requires the parental information, we investigated the influence of missing dam information on the calculation of DRP and the corresponding accuracy of genomic prediction. Results indicated to that no significant effect of missing dam information on the accuracy of genomic prediction. This might be because missing dam information is not used to estimate EBV and hence does not need to be accounted for in de-regression.
Acknowledgments
This work was supported by grants from the earmarked fund for China Agriculture Research System (CARS-35), the National Natural Science Foundation of China (31272418, 31671327), Beijing City Committee of Science and Technology Key Project (D151100004615004), the Program for Changjiang Scholar and Innovation Research Team in University (IRT_15R621), Major Project of Selection for New Livestock and Poultry Breeds of Zhejiang Province (2016C02054-5).