1. INTRODUCTION
Design practice today is a team activity, where the structure and organization of the design team is closely intertwined with the design task (Sosa et al., Reference Sosa, Eppinger and Rowles2004). Product architecture may determine the organizational structure of the team, whereas the conception of the product architecture is itself a result of teamwork and how the design activity is coordinated and performed as a team. The structure of the design team as well as the hierarchy of the design tasks can have unintended effects on information sharing and social learning among the team members, and potentially the coordination of the design activity. This paper presents a computational model developed to study the role of social learning in the coordination of design activity across teams with different organizational structures and requirements. The focus of this computational model is to simulate and understand social learning as an organizational activity in design teams, which affects the coordination and performance of the design task.
Various computational models of artificial organizations, communication networks, and teams have been developed to study the importance of individual and social learning as an organizational activity (Jin et al., Reference Jin, Levitt, Christiansen and Kunz1995; Carley & Svoboda, Reference Carley and Svoboda1996; Kunz et al., Reference Kunz, Levitt and Jin1998; Monge & Contractor, Reference Monge and Contractor2003; Rodan, Reference Rodan2008). In these models, the ability of an individual to learn about tasks to complete and to learn the knowledge to execute tasks is seen as integral to organizational performance. In all of these studies, the foundation of organizational performance is the ability of the agents to improve their performance through experience, often modeled as information acquisition. As succinctly put by Simon (Reference Simon1991, p. 125), the consensus is that “all learning takes place inside individual human heads; an organization learns in only two ways: (a) by the learning of its members, or (b) by ingesting new members who have knowledge the organization didn't previously have.”
In this research, rather than modeling how agents improve their own performance through experience, we model the types of social experiences that influence individual learning opportunities. We specifically deal with one aspect of the team that the agents need to learn, others' competence. The competence details of other team members include who can perform which design task and what is the potential solution that the task performer may provide for a given task. We model how agents learn about competence as they interact with each other and as they observe interactions between other agents or between some other agent and a task. Thus, we model and investigate how cumulative individual experience increases collective efficiency when agents have the ability to learn what others know through socialization (Reagans et al., Reference Reagans, Argote and Brooks2005). The primacy of knowing knowledge sources in a distributed system has been emphasized in the research on transactive memory (TM) systems (Wegner, Reference Wegner, Mullen and Goethals1987) and is regarded as the basis for the formation of sociocognitive factors such as trust in collaborative design (Wijngaards, Reference Wijngaards, Boonstra and Brazier2004).
This paper commences with a discussion on the theoretical basis of the model and then presents the model. We validate the model using docking (Axelrod, Reference Axelrod, Conte, Hegselmann and Terna1997). We then present some illustrative findings on the effects of forms of social learning on team performance (TP) based on factors that are difficult to control in empirical studies. We conclude with some discussions on the utility of models of social learning as a way to understand the effects of socialization opportunities in varied team environments.
2. THEORY
The computational model in this study is based on the hypothesis that social learning is the basis of group-specific behavior (McGrew, Reference McGrew1998). In the study of humans, we must consider the prominent forms of social learning that are not necessarily dependent on symbolic representation (Tomasello, Reference Tomasello1999). Such social learning occurs through social observations and interactions, where group members are viewed as actors and observers, who learn about each other through the assumptions of intentionality in each other's observable actions (Tomasello, Reference Tomasello1999; Knobe & Malle, Reference Knobe and Malle2002; Ravenscroft, Reference Ravenscroft2004; Malle, Reference Malle, Hassin, Uleman and Bargh2005).
These kinds of social learning are embedded in the environment and need not necessarily be goal directed. Such social learning skills are believed to be innate to all humans (Tomasello, Reference Tomasello1999) and, hence, need not be trained. For example, a child may observe that the adult goes to the refrigerator to retrieve an apple, and thus learns through observation that the refrigerator contains apples. Therefore, if organizations can maximize the benefits of social learning, they can significantly reduce the cost of training and development of team members toward effective task coordination in project teams (Marsick and Watkins, Reference Marsick, Watkins, Burgoyne and Reynolds1997; Conlon, Reference Conlon2004).
Various modes of social learning in teams have been reported in the literature (Grecu & Brown, Reference Grecu and Brown1998; Wu & Duffy, Reference Wu and Duffy2004). We consider three predominant modes of social learning: learning from personal interactions (PIs), learning from task observations (TOs), and learning from interaction observations (IOs). These modes of social learning are operationalized to model how an individual learns about the competencies of others so that the members can better coordinate their activity, which is a key factor that affects the rate at which teams benefit from their own experience (Argote, Reference Argote1999). Here, we invoke the concept of TM (Wegner, Reference Wegner, Mullen and Goethals1987) to hypothesize that social learning should enhance TM formation, wherein agents benefit from opportunities for social interactions and observations. That is, team members should be able to learn about each other's design knowledge and competence by observing the allocation of tasks and the design solutions proposed by other team members. This hypothesis has support because group training, where team members are collectively trained as a group, results in increased TM formation compared to individual training (Moreland, Reference Moreland, Thompson, Levine and Messick1999; Ren et al., Reference Ren, Carley and Argote2001). The type of team knowledge that team members gain in our model is at the level of detailed and concrete knowledge about who each team member is and the function of each team member, based on Rouse et al.'s (Reference Rouse, Cannon-Bowers and Salas1992) taxonomy. A well-developed TM should allow agents to allocate the task to the agent who is most competent in performing the given task without having to “ask around” to identify who is proficient at the task (Wegner, Reference Wegner, Mullen and Goethals1987; Rouse et al., Reference Rouse, Cannon-Bowers and Salas1992; Mathieu et al., Reference Mathieu, Heffner, Goodwin, Salas and Cannon-Bowers2000; Langan-Fox et al., Reference Langan-Fox, Anglim and Wilson2004). The challenge for a computational system is to model opportunities for social learning to understand their influence on the formation of TM.
3. CONCEPTUAL MODEL
The key objective of this research is to develop a model that provides the following:
1. The ability to set combinations of social learning modes as simulation parameters.
2. The ability to control what agents learn from socialization opportunities. In this model, agents learn only about what other agents know and not about the task, which ensures that the observed effects of social learning are limited to teamwork and not task work. In real-world empirical studies, this is difficult to control because agents simultaneously learn about the task and the team. Once the effects of social learning modes on teamwork are studied in isolation, in future research, both teamwork and task work can be the dependent variables such that their interaction effects can be studied.
3. The ability to control how agents learn from socialization. In real-world empirical studies, the ability to learn from socialization opportunities may vary from person to person. Factors such as the kinds of assumptions team members make and how those assumptions are influenced by other sociocognitive variables such as trust and reputation may differ from person to person. These factors may diminish or exaggerate the knowledge that agents take away from a social learning experience. The use of a computational model eliminates these factors because social learning is implemented as a set of rules. Though the researchers recognize that sociocognitive factors are likely to affect the veracity of the reported findings, additional parameters can be modeled to study their effects in future research.
4. The ability to simulate typical parameters of project-based teams that are related to the opportunities for socialization in teams. The parameters included in this model are
• business levels (BLs), which determine the availability of a team member to attend to socialization opportunities within the team;
• team structure (TS), which determines the socialization opportunities that are available or constrained by how the team is organized;
• member retention (MR), which determines how much can a team benefit from the social learning achieved in previous projects; and
• task complexity (TC), which determines the effectiveness of social learning in enhancing task coordination.
The effects of these parameters on teamwork are measured through
1. the amount of TM formation, which shows how much the team members have learned about each other through socialization; and
2. the amount of team communication needed for task work, which provides a measure of the efficiency of task coordination between the team members. Teams that require less communication to coordinate the same set of tasks are deemed as higher performing teams (Entin & Sarfaty, Reference Entin and Sarfaty1999).
The agent society in this simulation has three types of agents:
1. design agents, which form the team and complete the tasks;
2. client agents, which allocate the task to the team; and
3. a simulation controller agent, which initiates, manages, and controls the number of simulations, as specified by the researcher.
In the remainder of this paper, the design agent is referred to as the agent and the client agent is referred to as the client.
3.1. Social learning
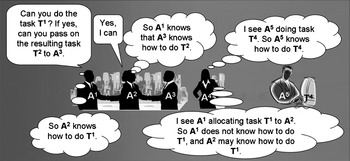
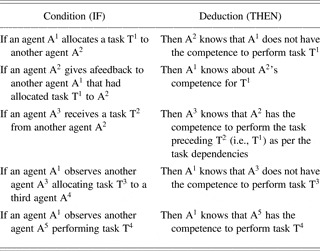
In this computational model, agents learn about the other agents in the team based on the actions of the others, which are observable (Irene Frieze, Reference Irene Frieze1971; Wallace & Hinsz, Reference Wallace and Hinsz2009). Interactions and observations allow team members to learn about each other's competence. The team members learn through PI with each other, by observing the other members perform a task, and by observing the interaction between the other agents. For example, in Figure 1, the team member A1 allocates a task T1 to the team member A2 and asks the team member A2 to pass on the resulting next task T2 to a third team member, A3. At the same time, another team member A4 gets an opportunity to observe A1 allocating the task T1 to A2. A2 responds, confirming that it can perform the task T1. In another instance, A4 observes team member A5 performing a task T4. During these interactions the following learning opportunities are created (Table 1):
1. Learning from PI: A2 may assume that A1 is asking it to do the task T1 because A1 does not have the competence to perform T1. Similarly, based on A1's statement about allocation of task T2, A2 may assume that A1 knows about A3's competence in T2. Further, when A1 gets a positive feedback from A2, A1 knows that A2 can perform T1.
2. Learning by observing the other member perform a task (TO): A4 knows that A5 can perform T4. A4 may be able to use this knowledge later, if at some other stage it is looking for someone to perform T4.
3. Learning by observing interaction between other agents (IO): A4 may assume that because A1 is allocating the task T1 to A2, A1 itself does not have the competence to perform T1. At the same time, A3 may also assume that it is likely that A2 knows how to perform T1 because it is being allocated that task by A1.
Social learning opportunities in a team environment.

Learning assumptions corresponding to learning opportunities shown in Figure 1

As team members interact and observe each other, they develop TM. The development of TM involves learning about the competence of each agent in the team in each of the different tasks the team needs to perform, that is, “who knows what.” The TM formed by each agent may be different from the TM of the other agents because all the agents will not have the same interactions and observations. Competence is defined in two ways: as a binary value (an agent does or does not have the competence to perform the task) and as a range of values (an agent has the competence to provide solutions to a task within a certain range of solutions). Competence range is a proxy for the level of skill in an area corresponding to the attributes of the solutions. For example, a team member with a higher competence mean value can be expected to provide solutions with higher values of the attributes (e.g., quality). This knowledge of others' competence range allows agents to propose solutions that will be acceptable to the agent evaluating the solution.
The model simulates four factors that attenuate opportunities for social learning. Attention plays a critical role during these interactions and observations because the learner is concerned with only a subset of all the things that can be perceived at the given moment (Tomasello, Reference Tomasello1999; Malle, Reference Malle, Hassin, Uleman and Bargh2005). Observation is subject to an agent's availability to attend to the observable data and, hence, mitigated by their level of busyness (Gilbert et al., Reference Gilbert, Pelham and Krull1988; Gilbert & Osborne, Reference Gilbert and Osborne1989). If an agent is busy when the observable data is available, then the observation is not made in that instance. A “busyness” factor is introduced for the agent's attention to the observable data. Busyness is implemented as the probability that an agent is not able to sense interactions among other agents and task performance by some other agent at that instance. When an agent performs a design task, the agent always learns from PI, but if the agent is not performing a design task during a simulation cycle, the “busyness” factor simulates an agent being preoccupied with other matters.
In addition, social learning opportunities may vary with the TS (i.e., how the team is organized). Three types of TSs are differentiated based on the opportunities and constraints for socialization: flat teams, distributed flat teams, and functional teams organized in task-based subteams.
Flat teams: These have no hierarchy and no subdivisions. Such teams are generally used for consultation, taskforce, and design exploration (Katzenbach, Reference Katzenbach1993; Perkins, Reference Perkins2005; OpenLearn, 2009). In flat teams all team members have the opportunity to interact with and observe all other members of the team.
Distributed flat teams: With the increased use of communication technology, project-based teams are often distributed across geographies (McDonough et al., Reference McDonough, Kahn and Barczak2001). In such teams, sometimes social cliques develop, where the project team is divided into two to three collocated clusters. Thus, even if the teams are flat for the purpose of task allocation, the opportunities for social learning are skewed owing to the physical boundaries (McDonough et al., Reference McDonough, Kahn and Barczak2001; Leinonen et al., Reference Leinonen, Jarvela and Hakkinen2005; Sutherland et al., Reference Sutherland, Viktorov, Blount and Puntikov2007). Examples of distributed flat teams can be found in global product development teams (McDonough et al., Reference McDonough, Kahn and Barczak2001) and the current practice of outsourcing (Seshasai et al., Reference Seshasai, Malter and Gupta2006; Sutherland et al., Reference Sutherland, Viktorov, Blount and Puntikov2007). Virtual teams can be considered as a kind of distributed team where it is possible that all the team members are distributed geographically such that there are no collocated clusters (Clancy, Reference Clancy1994; Desanctis & Monge, Reference Desanctis and Monge1999).
Functional teams: Many work teams are organized into functional subteams (Malone, Reference Malone1987; Hackman, Reference Hackman and Lorsch1987; Grant, Reference Grant1996; OpenLearn, 2009). In such teams, the task is passed to the members from the subteams with relevant domain knowledge. Even if the hierarchy is not predefined, hierarchy emerges as the hierarchical task is decomposed into subtasks and members are chosen to coordinate those tasks. A team member from each subgroup emerges as the task coordinator, who coordinates the activities of that group, at the higher level, with the coordinators from other groups.
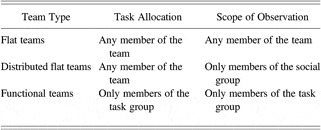
The three types of TSs implemented are summarized in Table 2. Flat teams allow members unrestricted access to all the agents in the team for task allocations as well observations. In functional teams, an agent's ability to observe the other agents is limited within the subteam, and even most of the task-allocation interactions are within the subteam. In distributed flat teams, agents can allocate tasks to any other agent in the team, but their ability to observe other agents is limited to the members within their social cliques.
Team types and corresponding scope for task allocation or social observation

Personnel turnover is known to hamper coordination through disruption of the current TM (Carley, Reference Carley1992; Rao & Argote, Reference Rao and Argote2006). This is a particular problem in design teams, which are often project based. As a consequence, team composition is likely to vary from one project to another. The composition of teams with members from an array of skill sets and specializations introduces new management and research challenges in harnessing the skills of those involved (Badke-Schaub et al., Reference Badke-Schaub, Neumann, Lauche and Mohammed2007; Townley et al., Reference Townley, Beech and Mckinlay2009). In order to achieve higher TP, the managers and project leaders strive to maximize the number of members in the team who have previously worked together on a similar project (Hinds et al., Reference Hinds, Carley, Krackhardt and Wholey2000). This strategy is based on the belief that the greater the number of members who have worked together previously, the higher is the team familiarity, which in turn should lead to increased TP. For example, higher team familiarity is expected to result in improved coordination among the team members (Hinds et al., Reference Hinds, Carley, Krackhardt and Wholey2000; Espinosa et al., Reference Espinosa, Kraut, Slaughter, Lerch, Herbsleb and Mockus2002; Harrison et al., Reference Harrison, Mohammed, McGrath, Florey and Vanderstoep2003; Huckman et al., Reference Huckman, Staats and Upton2008). Therefore, this research adopts MR as a parameter.
Finally, because teamwork relies on task coordination, the complexity of the task determines the extent of social learning required to obtain sufficient knowledge of the agents' competences to complete the tasks. As the TC increases, agents will need greater information sharing and knowledge transfer, suggesting a potentially greater need for social learning to improve task coordination. Gero (Reference Gero1990) classifies design tasks as routine and nonroutine depending on the exploration of the design space. Brown (Reference Brown, Waldron and Waldron1996) suggests another additional dimension for classification of design tasks, namely, parametric/conceptual designs, based on the explication of the attributes that specify the desired design solutions. In this research, two types of parametric design tasks are modeled, such that they are differentiated in terms of the potential values for the attributes that specify the design problem. The tasks modeled have sequential dependence.
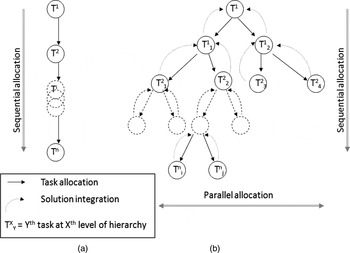
Simple tasks: Simple tasks are those parametric design tasks for which there are unique possible values for the attributes such that any two agents will provide the same solution. For simple tasks, the task handling is sequential (Figure 2a). Therefore, all that the agents need to learn is “who knows what.” Because the solutions to simple tasks are unique, the solutions are not subject to any coordination or compatibility check. Initially, the client allocates the first task on the basis of an expression of interest. Thereafter, the agents coordinate among themselves to pass on the resulting task to other agents. Once the last of the tasks is completed, the client is informed of the completion, closing the project simulation.
Complex tasks: Complex tasks are those parametric design tasks for which multiple values are possible for the same attributes, such that any two agents performing the same task may provide different solutions. Complex tasks require decomposition into simple tasks (Figure 2b). These are similar to the design of complex engineering products that require decomposition according to product function or (modular) subsystem (Eppinger & Salminen, Reference Eppinger and Salminen2001; Siddique & Rosen, Reference Siddique and Rosen2001). The teamwork involves more coordination and evaluation compared to simple tasks. For the complex tasks, one task may branch out into multiple subtasks, and their solutions need to be compatible. Hence, such tasks require solution integration and compatibility check. This may require reallocation of the same tasks to the same or some other agent. Hence, a higher degree of social learning is necessary to complete the tasks efficiently.
Model task complexity for (a) simple tasks and (b) complex tasks.

In general, the descriptions of the model and simulations assume complex tasks, unless otherwise stated. The main task T (first task) is divided into η subtasks, represented as T L1, T L2, … , T Lη, where L is lowest level of detail. For each subtask, there are µ acceptable solutions. The overall design space is defined by a µ × η matrix. A complete solution, C, is a combination of the subsolutions and can be represented as an η dimensional vector, C = [T L1 (x 1), T L2 (x2), … , T Lη (x η)], where x i is the solution chosen for the ith subtask (T Li) and where 1 ≤ (x 1, x 2, … , x η) ≤ µ, such that there is a solution for each of the η subtasks, which may be one of the µ possible solutions for that subtask, with the possibility that x 1 = x 2 = x η. The average quality of the overall solution (V C) can be calculated as
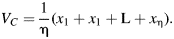 $$V_C={1 \over {\rm \eta}} \lpar x_1 + x_1 + \hbox{L} + x_{\rm \eta} \rpar .$$
4. MODEL IMPLEMENTATION
The computational model is implemented in the Java Agent Development Environment (Bellifemine et al., Reference Bellifemine, Caire and Greenwood2007). A comprehensive detail of model implementation, including the algorithms, is published in Singh (Reference Singh2010). The following section provides a brief description of the key implementation aspects.
4.1. Implementing agent interactions and observations
Each agent has a unique ID. All the agents must register with the simulation controller. At the time of registering with the simulation controller, each agent registers its task expertise (tasks that it can perform) and affiliations (task groups/social groups), which allows for the simulation of TS. A single agent may have expertise in multiple tasks so that multiple agents may have expertise in the same task.
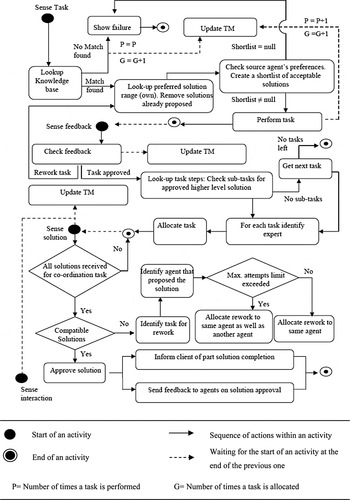
Figure 3 shows the activity diagram for agents. Agents can sense/receive four kinds of data: a task to perform, feedback/reply for the task performed earlier by this agent, a solution for the task allocated earlier by this agent to another agent, and observed interaction between two other agents or another agent and some task.
An activity diagram for a design agent.

All interactions and observations are implemented through message exchange. All messages sent from one agent to the other are wrapped in a message envelope based on the FIPA-ACL message protocol (FIPA, 2002). The parameters in the FIPA-ACL message envelope include sender, receiver, content, in-reply-to, and performative. Agents are able to assign values to the required parameters while sending the message. The observation of the interaction between two agents (or an agent and the client) by other agent(s) or the observation of the task performed by some other agent is also implemented using message transfer. When one agent sends a message to another agent or performs a task, a duplicate message is created and sent to all the agents that are not busy at that instance. The duplicate message serves as a mechanism to simulate observation opportunities in a computationally simple manner. The duplicate message contains the details of the interacting agents and the contents of the interaction. Upon parsing the message, the observer can identify the original sender and receivers of the message and what the message conveyed. Therefore, all the messages for observation have the same representation. TO and IO are differentiated in the way the agent parses the data.
4.2. Implementing knowledge of competence and TM
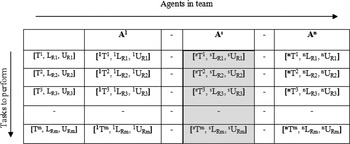
Each agent stores another agent's competence details as an m-dimensional vector showing the competence values, the lower range, and the upper range of the m possible tasks within the team, shown as the grayed column in Figure 4. The competence details for agents consists of a task identifier, counters for the number of times the agent has performed the task assigned P, the number of times a task has been allocated (given) to the agent G, the perceived lower range of solution for each task L R, and the perceived upper range of solution for each task, U R.
A matrix representing the transactive memory of an agent.

When an agent receives a positive feedback on another agent's competence, both P and G are incremented by one. If a negative feedback is received, only the G value is incremented by one. Updating just the competence values is not enough. Agents check the solutions provided or rejected by another agent to update the competence range of that agent in the given task. If an agent provides a solution or accepts a solution, it means that the solution lies within the specified range of solutions for that agent for the given task. If an agent rejects a solution provided by someone else, it can be assumed that the solution is outside the range of solutions acceptable to that agent for the given task.
As part of the common knowledge about the competence range of a typical agent in the team, agents assume that the difference between the upper range and lower range of any other agent's competence, for a given task, is similar. The solution span refers to the range of solutions that an agent may provide for a given task. The solutions that an agent can provide fall in a continuous range, within a limited span, corresponding to the competence range. The solution span is represented in terms of a MaxWindow and a MinWindow. MaxWindow refers to the maximum possible span (i.e., the maximum number of solutions known to an agent for a task that it can perform). MinWindow refers to the minimum possible span (i.e., the minimum number of solutions known to an agent for a task that it can perform). For example, let us assume that for any task, the upper and lower range of valid solutions has a value of 9 and 0, respectively. Let MaxWindow = 4 and MinWindow = 2. Now, if an agent provides a solution with value 9 and if the agent has the maximum competence span (i.e., span = MaxWindow) in this task, then this agent provides a solution between 9 and 6 (9 – 4 + 1). However, if the agent has a minimum competence span (i.e., span = MinWindow) in this task, then the agent only provides solutions between 9 and 8 (9 – 2 + 1). In the simulations, MaxWindow and MinWindow values are precoded into the agents as part of their common knowledge about the simulated team. When an agent observes another agent either performing or rejecting a task, the observer agent uses the known values of the typical MaxWindow and MinWindow to calculate and update the likely span (lower and upper competence range) of the observed agent for the observed task.
The TM is represented as an m × n matrix (Figure 4), where n is the total number of agents. Each element [sT r, sL Rr, sU Rr] is a vector that holds the values for the competence, the lower range, and the upper range of the sth agent for the rth task. Because at the start of the simulation (i.e., at time t = 0), agents have no details of other agents' competence in any of the tasks, they have equal belief that an agent can either perform the task or not. Hence, the default value of P/G is 1/2. At t = 0, the default values of L R and U R for each of the tasks is set to L Rmin and U Rmax, respectively, where L Rmin is the minimum possible lower range and U Rmax is maximum possible upper range for any solution. As agents learn about each other's competence details, these assumed default values are updated to converge toward the actual competence values.
4.2.1. Measuring TM formation
TM formation is measured as a ratio of the number of TM matrix elements for which the values are different from the initial values by the end of the simulation. The measure of TM formation adopted for these simulations is similar to existing measures, which calculate the density and accuracy of TM formation (Moreland et al., Reference Moreland, Agote, Krishnan, Tindale and Heanth1998; Ren et al., Reference Ren, Carley and Argote2006). Density measures “how much of the TM is learned” whereas accuracy measures “how much of what is learnt is correct.” In this paper, accuracy need not be measured because whatever the agents learn is accurate, and hence density (amount) is the only measurement required. Because each agent starts (at time t = 0) with a default value for each element in the matrix, the values in each element will change only if the agent has learned it through social interactions and observations. Each value in the TM matrix should proceed toward 0 or 1, that is, that another agent cannot or can complete a specified design task.
Only the changes in the competence values are considered for assessing the TM formation of the agents. For example, let there be 10 agents in the team and altogether 10 tasks to be performed by the team. In that case, the TM is represented as a 10 × 10 matrix such that there are 100 elements in the TM. When the simulation starts, all the elements have a default competence value (P/G) = 1/2 because there is an equal likelihood that a given agent may or may not be able to perform any of the given tasks. As agents interact with and observe each other and the task, they learn about each other's competence in the different tasks and update the values of the corresponding elements in their TM. By the end of the simulation, let us assume that 60 of the 100 values were updated, such that the value of each of these 60 elements is different from 1/2. Thus, the TM formed in this case is 60%.
Each agent maintains a separate TM, which it updates based on its own interactions and observations. Therefore, by the end of the simulation, it is expected that each agent's TM will be different. However, overlap and similarities across the TM of the agents is likely. The overall TM formation for the team is calculated as an average of the TM formation for each agent in the team. For example, in a team of 10 agents, if 4 agents have 60% TM formation, 4 agents have 40% TM formation, and 2 agents have 50% TM formation, then the overall TM formation for the team is 50%.
4.2.2. Using the TM for task allocation and handling
Agents allocate the task to the agent who has the highest competence value in the given task. When the simulation starts (at time t = 0), all the agents have the same default value for the competence in each task. In such a scenario, agents allocate the task to a random agent. Once the agents have gained experience working with each other, there will be differences in known competence of the agents in a given task. However, in that scenario, it is possible that more than one agent has the highest competence value. In that case, the agent creates a shortlist of all the agents with the highest competence value, and the task is allocated to any one of them.
Agents propose solutions based on their own competence range and the range of acceptable solutions for the agent who allocated the task, that is, the task allocator. The task performer looks up the competence range of the task allocator corresponding to the given task in its TM. For the selected solution to be accepted, the solution must also overlap with the solution range acceptable to the task allocator. Once the agent has identified a shortlist of solutions that it can provide and that are also acceptable to the task allocator, it can choose any of the solutions from the shortlist, provided the chosen solution has not already been proposed in the same project. If the agent does not find an overlap between its own competence range and the solution range acceptable to the task allocator (i.e., if the shortlist is null), it shows failure to provide a solution. Because the agent constantly updates the task allocator's acceptable solution range as soon as it gets feedback, the task performer is able to adapt the solution to suit the task allocator. Thus, teams with well-developed TM will perform faster.
4.3. Implementing MR
The level of MR is taken as the number of team members retained from the previous project, such that if all the team agents are the same in the training round and test round, the level of MR is 100%. If the MR is 100%, all the team agents retain their TM. If the MR is less than 100%, new team agents are introduced into the team, such that each new team agent acquired in the team replaces a team agent that was part of the training round. For example, let there be 10 team agents, A1 to A10 that were part of the team in the training round. Now, if the desired MR in the test round is 80%, then the new team has 8 team agents retained from the training round and 2 new team agents, for example, A3' and A7', such that they replace the other 2 team agents, A3 and A7, that were not retained from the training round.
Although all new team agents (i.e., A3' and A7') start with a default TM, the team agents retained from the training round (i.e., A1, A2, A4, A5, A6, A8, A9, and A10) reset the competence details of the team agents that have been replaced (A3, A7) while retaining the competence details of the rest of the agents (i.e., A1, A2, A4, A5, A6, A8, A9, and A10). That is, the retained team agents retain part of their TM, whereas the other part that may not be useful (i.e., related to A3 and A7) is reset to default values (to be used for competence details of A3' and A7').
4.4. Implementing the client agent
The client is not a part of the team, but it interacts with the team to call for the initial proposals, nominate the coordinator for the first task, and approve the overall solution.
The client receives the proposed solutions for the first task from agents that can coordinate the first task. The proposals from different agents are likely to be different because each agent can propose a different range of solutions. The client selects a proposed solution that is the best match to its own acceptable range of solutions. If more than one proposal is shortlisted, the client selects any one of the shortlisted agents as the coordinator of the first task. The agents coordinating partial solutions directly report to the client about the completion of the partial solutions. The client has to ensure that all the partial solutions are received before informing the simulation controller that the project has been successfully completed.
4.5. Overview of a simulation run
A single simulation run consists of two simulation rounds. The first round of a simulation is the training round in which the agents start with default (experimenter-defined) values. None of the agents have any TM formed at this stage. Once the training round is completed, a second round of simulation is run as the test round. Depending on the level of MR, some or all the agents carry over the TM formed during the training round to the test round. The results from the training round are used as the basis from which to measure TM formation. Measurement of TP is based on the results from the test round.
Each simulation round is said to be complete when the set of tasks is complete. Completion of the set of tasks (i.e., one simulation round), requires multiple simulation cycles. For each simulation cycle, a team agent may perform a task, communicate with another agent to assign a task, or observe other agents. Opportunities for social learning occur when the agents interact, thereby forming a TM. There is one design task related activity in each simulation cycle. This activity, which could be task allocation, refusal to perform a task, or task performance, allows agents that are not directly involved in these activities to make observations. The social learning mode of PI occurs when agents are communicating with other agents to assign tasks or provide solutions, and the social learning modes of IO and TO occur when agents are not engaged in any design work during a simulation cycle and can thus observe other agents working. The number of simulation cycles in a simulation round corresponds to the number of messages exchanged between the agents to complete the set of tasks. Hence, test rounds are expected to have fewer simulation cycles than the training rounds, and the comparison across the training rounds and test rounds indicates the improvement in TP.
At the start of a simulation round, the client calls for proposals for the first task from all the agents in the team. Agents that can perform the first task propose a solution. This proposal includes the range of solutions that the agents can provide. Once the deadline for the receipt of solutions is over, the client evaluates each of the proposals and shortlists the solutions that are closest to its acceptable range of solutions. If more than one proposed solution is shortlisted, one of the shortlisted proposals is chosen at random and the task is allocated to the agent, who coordinates the task at the highest level with the rest of the team. The coordinator of the first task decomposes the task into subtasks, which it allocates to the other agents that it expects to be able to competent in performing those tasks. Because the solutions for the decomposed tasks must be compatible, the source agent (i.e., the agent that allocates task) needs to evaluate the solutions. Agents that receive the task but cannot perform the given task send a refusal message, while agents that receive the task and can perform the task communicate a proposed solution. Once the source agent has received the solutions for all the related subtasks, it checks the solutions for compatibility. The subtasks for which the solutions may not be compatible are sent for rework, based on the task handling protocol. The cycle of rework and task allocation continues unless the solutions for all the subtasks are approved. Once the solution for a subtask is approved, the agent that performed the subtask checks if the given subtask needs to be decomposed further to detail the solution. If no decomposition is required, it informs the client that the subtask is performed. If the task needs to be decomposed further, the same cycle of task allocation, coordination, and rework continues until all the subtasks are performed and the compatibility is ascertained.
5. VALIDATION OF THE COMPUTATIONAL MODEL
Teams trained in groups are known to perform better because of higher TM formation, as compared to teams where members are trained individually (Moreland et al., Reference Moreland, Agote, Krishnan, Tindale and Heanth1998; Ren et al., Reference Ren, Carley and Argote2001, Reference Ren, Carley and Argote2006). Hence, initial simulations were conducted to simulate similar scenarios, such that the simulation results can be compared to the expected results based on published findings (Moreland et al., Reference Moreland, Agote, Krishnan, Tindale and Heanth1998; Ren et al., Reference Ren, Carley and Argote2001, Reference Ren, Carley and Argote2006). If the results from the validation simulations conform to the published findings from the literature, the model can be used with confidence to conduct “what if” studies.
The validation simulations are conducted with simple tasks, flat teams, and 100% MR. Two types of agents are used. In any given simulation, only one kind of agent is used at a time. The differences in the agents are based on their learning capabilities. Agents of type AI learn only from their PIs. Agents of type AS are not only capable of learning from PIs but also observe and learn from the other interactions in the team.
The simulations with these two types of agents correspond to the studies on individual training and group training of the team members, as reported by Moreland et al. (Reference Moreland, Agote, Krishnan, Tindale and Heanth1998) and Ren et al. (Reference Ren, Carley and Argote2001, Reference Ren, Carley and Argote2006). Group training involves PIs, communication, and observations. This matches the case where the agents have all learning modes available to them (AS). In contrast, the simulations where the agents can only learn from PI (AI) are similar to the individual training case.
The measures for TP include the time taken to perform the task and the quality of output. The quality of output is not assessed in this paper, because none of the acceptable solutions is dominant. The TP is measured only in terms of the amount of communication required to complete the set of tasks, which determines how much time the team takes to perform the tasks.
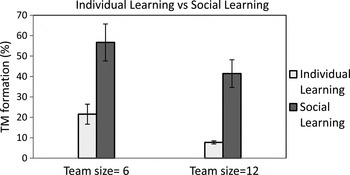
Findings for the validation studies are based on 60 simulation runs. Simulations were conducted with two different team sizes (6 and 12 members) to see whether team size produced a qualitative difference in behavior. Two-tailed t tests reject the null hypothesis that the means of the results from the experiments are similar. The teams in which the agents can learn from social observations, in addition to their PIs, have higher level of TM formation (Figure 5).
Transactive memory formation across individual and social learning scenarios.

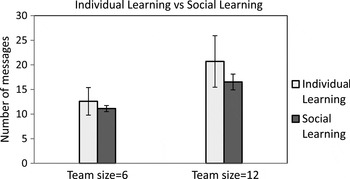
These results conform to the findings reported in the two cases studies. The two cases studies (Moreland et al., Reference Moreland, Agote, Krishnan, Tindale and Heanth1998; Ren et al., Reference Ren, Carley and Argote2006) also reported positive effects of group training on the TP. The findings from the validation simulations are similar (Figure 6). In both the cases, the teams of AS agents performed better than the teams of AI agents.
The number of messages across individual and social learning scenarios (a higher number of messages for the same team size indicates lower team performance).

As the team size increases, the differences in TM formation across individual learning scenarios and social learning scenarios increases (Figure 5). Furthermore, as the team size increases, the level of TM formation decreases, indicating that the lack of social learning is more detrimental to TM formation in larger teams (Figure 5). These findings are consistent with Ren et al. (Reference Ren, Carley and Argote2006), who found that larger groups suffer more from the lack of TM formation opportunities that are available to the smaller groups.
6. RESULTS AND DISCUSSION
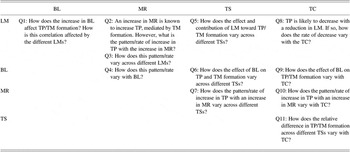
The simulation results presented in Section 5 validate the suitability of the model for studies on TM formation and social learning in teams. The model provides the basis for a simulation environment that can be used to study the differential contributions of the different social learning modes to the prosocial team processes, mediated by the formation of TM. The validated model can be used to investigate different research questions and hypotheses relating the independent variables (i.e., social learning modes, TS, BLs, level of MR, and TC) to the dependent variables (i.e., TM formation and task coordination). Table 3 shows the experiment matrix and the potential research questions that can be investigated using the developed computational model.
Simulation parameters and research questions to be investigated using the model

Note: BL, business levels; MR, member retention; TS, team structure; TC, task complexity; LM, learning modes; TP, team performance (measured as task coordination); TM, transactive memory (measured as the density of TM formation).
Simulation results testing the following hypothesis are presented to demonstrate the utility of the model in generating findings.
Hypothesis: The increase in TP, with the increase in MR, is lower in teams with fewer learning modes (LMs) available to the agents. This hypothesis is derived from Q2 and Q3 in Table 3.
Results from simulations conducted to test this hypothesis are shown in Figure 7. These results are for simulations with simple tasks, flat teams, and BL = 0%. Thus, the independent variables for this simulation are: learning modes (PI/PI + IO/PI + TO/PI + IO + TO) and team retention level MR (17/33/50/66/83/100%, these values are derived from a team size = 12 and six levels of retention), and the dependent variable is TP, measured as the amount of communication needed to perform the set of tasks. TM formation is the intervening variable in the studies with MR because the level of MR determines how much of the TM formed during the training rounds is retained in the test round.
The rate of increase in team performance with the increase in the level of member retention across different learning modes. Team performance is marked as a negative of the number of messages. [A color version of this figure can be viewed online at http://journals.cambridge.org/aie]

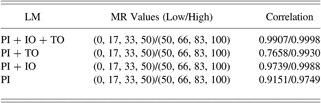
Simulation results plotted in Figure 7 support this hypothesis. The pattern in Figure 7 suggests that when MR is higher, the TP is higher. Further, these results show that the rate of increase in TP is higher with the increase in MR. This is demonstrated by a positive concave curve across all learning scenarios. These results indicate that below a certain level of MR, the lack of MR is less detrimental to the TP. Statistical comparisons provide some indication of marginally higher correlation between MR and TP at higher levels of MR (Table 4). Each row in Table 4 shows the correlation between MR and TP for a given learning mode, across lower (0, 17, 33, 50) and higher (50, 66, 83, 100) levels of MR. The interaction effects of learning modes and MR are explored further in Table 5.
Correlation between member retention and team performance (BL = 0%)

Note: BL, business levels; LM, learning modes; MR, member retention; PI, personal interaction; IO, interaction observation; TO, task observation; MR, member retention.
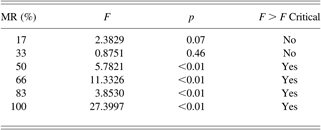
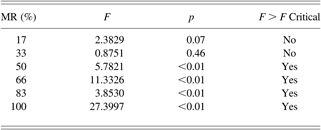
Differences in team performance across the four learning modes (PI, PI + IO, PI + TO, PI + IO + TO) at given level of member retention, measured through an analysis of variance
Note: PI, personal interaction; IO, interaction observation; TO, task observation; MR, member retention.
The pattern of change in TP with the change in MR is found to be contingent on the learning modes (i.e., the different learning modes are found to have differential contributions to the increase in TP). For example, in these simulations, the differential contributions of PIs, TO, and IOs to the increase in TP are more distinct at intermediate levels of MR (50%–83%), as shown in the differences across PI, PI + IO, and PI + TO graphs. Analysis of variance results presented in Table 5 show that there is significant difference in TP across the different learning modes at intermediate and higher levels of MR. Each row in Table 5 shows analysis of variance across the TP for the different learning modes at a given level of MR. At lower levels of MR (0, 33), the differences in performance across the different learning modes is not significant, supporting the claim that below a certain level of MR, the lack of MR is less detrimental to the TP. Further, a statistical analysis confirms that the differences observed in Figure 7 across the PI + IO and PI + TO graphs is significant (F = 37.122, p < 0.01).
Although it is known from the literature that MR typically enhances TP, these simulation results provide an insight into the pattern of increase, as well as the potential contributions of the different learning modes in fostering this causal relationship. Recent studies on team familiarity in real-world scenarios (Huckman et al., Reference Huckman, Staats and Upton2008; Huckman & Staats, Reference Huckman and Staats2008; Staats, Reference Staats2011) have started to explore underlying conditions in which team familiarity is achieved and how the differential conditions have differential effects on the relationship between team familiarity and TP. The simulation results shown in Figure 7 demonstrate the usefulness of the model in testing and generating hypotheses related to team behavior, which was the main objective of this paper. These results show that the model can be used to test theories on social learning, through simulation of scenarios that are difficult to control and test in real-world studies. The model is particularly relevant to the current research on teams and organizations because contemporary teams vary in their scope of social interaction and dissemination of information among team members. These variations in scope for social learning can result from TSs, geographical distribution of team members, information protocols within teams, reports and documentations of past projects, and use of information and communication technology. For example, how the information is documented and presented determines what assumptions the information seeker is making. Similarly, geographically distributed teams skew the opportunity for social learning. Collocated team members have multiple modes of communication channels available to them, whereas noncollocated team members are generally dependent on discrete sets of information such as texts (McDonough et al., Reference McDonough, Kahn and Barczak2001). Typically, in some of the fully virtual teams, such noncollocated interactions might be the only source of team building and team formation. Discussion forums, blogs, group mails, corporate social networking sites, and general social networking sites such as Twitter are other sources of information that team members may use to impute about others' capabilities. For example, plain text messages and status updates on social media such as Twitter and Facebook are reported to have been used by managers and colleagues to identify what others are doing, even to the extent of locating potential employees in some cases (Skeels & Grudin, Reference Skeels and Grudin2009). Users of social networking sites can learn about the relationships and associations between two other individuals based on the messages exchanged between them. Although it remains an open research question whether the social media provide new forms of social learning modes or not, it is evident that they support varying levels of social interaction and observation opportunities, allowing individuals to make assumptions about others in their network.
Design teams are increasingly project based and distributed across different locations. Factors such as the available learning modes, TS, level of MR, and TC can affect the TM, and hence the task coordination in such teams. Knowing the differential contributions of the different modes of learning across different team environments will be useful for effective team management.
7. CONTRIBUTIONS AND LIMITATIONS
The main contribution of this research is the introduction and validation of a computational model that uses fundamental modes of social learning as the basis for agent learning. This model allows the study of the differential effects of the social learning modes on TP, mediated by the formation of TM. The social learning modes are distinctly identified and operationalized as simulation parameters. Other potential independent variables currently implemented in the model are TS, BLs, levels of MR, and TC. The use of a computational method allows control and isolation of parameters such as learning modes and BLs that are difficult to isolate and control in real-world scenarios, besides the challenges posed in real-world studies in accurate elicitation of what the team members have learned (Mohammed et al., Reference Mohammed, Klimoski and Rentsch2000). The conformity of the results from the validation simulations to the established finding reported in the literature suggests that this computational model of TM and social learning modes can provide useful insights into the theories of TM formation and task coordination.
However, the simplified scenarios are also the main limitations of this work. This model currently uses reactive agents with assumptions of intentionality and rationality in actions and observations. Sociocognitive behavior is much more complex, determined by factors such as trust, motivation, and forgetfulness that may influence an agent's willingness to perform a task as well the inferences made from social observations. Although the fundamental models of social learning are differentiated in terms of PIs, TOs, and IOs, in the real word learning scenarios associated with each of these learning modes are much wider and varied. For example, PIs in real-world scenarios may include interactions such as recommendations (informing an agent about another agent's competence) and queries (asking an agent about another agent's competence), where agents explicitly exchange information about the other agents, in both formal and informal interactions (Bobrow & Whalen, Reference Bobrow and Whalen2002; Borgatti & Cross, Reference Borgatti and Cross2003). The computational model needs to be extended to include other learning scenarios.
In the current model, the task-related capabilities of agents do not change over time, which is rarely the case in real-world scenarios that may require constant updates of the TM for accuracy and recency, other aspects of TM that are critical to effective task coordination. The current model adopts one of the many different ways to represent a design task. The results may also vary with the complexity of the task modeled and the knowledge and coordination required by the agents. Design tasks are often creative and exploratory and result in the production of new knowledge and expertise. Modeling creative design tasks and the generation of new knowledge is by itself a computationally challenging task. Extensions to the current model can simulate some of the specific characteristics of the creative design processes and tasks. In particular, this model can be extended to study how social experiences and cumulative learning of individuals in teams may influence collective learning and the generation of expertise in creative design teams. For instance, simulations can investigate how members collectively learn to design better. This model can also be extended to study the density effects on learning (Huber, Reference Huber1981; Rodan, Reference Rodan2008) and to understand why some teams are more creative than others.
In summary, this paper presents a computational model based on fundamental modes of social learning in teams and provides a robust platform that can be extended across different dimensions of design TS and design tasks to test aspects of team learning and behavior.
Vishal Singh is an Assistant Professor of computer integrated construction (building information modeling) in the Department of Civil and Structural Engineering at Aalto University. He has multidisciplinary research interests investigating the interaction among products, processes, and people within the design and construction domains. He combines various qualitative and quantitative methods in his research with the aim to develop computational models and tools to support decision making in ill-defined problems, especially in design and social context.
Andy Dong is the Warren Centre Chair in Engineering Innovation in the Faculty of Engineering and Information Technologies at the University of Sydney. His research is in design-led innovation, where he has made significant methodological contributions in explaining the dynamic formation of design knowledge. He received the Design Studies Prize in 2005 for the most significant journal article in the field for his work in the context of creative teams. He is currently an Australian Research Council Future Fellow working on predictive analytics to forecast rates of potential progress of engineered products based on their underlying knowledge structure.
John S. Gero is Research Professor at the Krasnow Institute for Advanced Study and Research Professor in the Department of Computational Social Science and at the Volgenau School of Engineering, George Mason University. He was formerly the director of the Key Centre of Design Computing and Cognition, University of Sydney. He is the author or editor of 50 books and over 600 papers and book chapters in the fields of design science, design computing, artificial intelligence, computer-aided design, design cognition, and cognitive science. He has been a Visiting Professor of architecture, civil engineering, cognitive science, computer science, design and computation, and mechanical engineering in the United States, the United Kingdom, France, and Switzerland.