Introduction
The neural processes that lead to visual perception and recognition of objects seem to occur in the occipitotemporal pathway (Ungerleider & Mishkin, Reference Ungerleider, Mishkin, Ingle, Goodale and Mansfield1982; Goodale & Milner, Reference Goodale and Milner1992). The inferotemporal (IT) cortex has long been known to have an essential role in these processes (Logothetis, Reference Logothetis1998). The IT cortex is hierarchically several steps beyond the primary visual cortex, and its cells receive a converging input from prestriate visual areas (Desimone et al., Reference Desimone, Fleming and Gross1980) in such a way that the response selectivity of neurons for object features becomes gradually more complex along this pathway. It has been observed that removal of IT cortex results in a severe impairment of perceptual learning, visual discrimination learning, and object recognition in the absence of any significant changes in basic visual capacities (Dean, Reference Dean1976; Gross, Reference Gross1994; Logothetis & Sheinberg, Reference Logothetis and Sheinberg1996). Several studies showed that IT neurons are selective for object attributes, such as color, shape, texture, three dimensionality, or even complex stimuli, such as faces (Desimone & Gross, Reference Desimone and Gross1979; Fuster & Jervey, Reference Fuster and Jervey1982; Desimone et al., Reference Desimone, Albright, Gross and Bruce1984; Tanaka et al., Reference Tanaka, Saito, Fukada and Moriya1991; Perrett & Oram, Reference Perrett and Oram1993; Logothetis & Sheinberg, Reference Logothetis and Sheinberg1996). The ability of these cells to selectively respond to faces or to features present in faces suggests that damage of this region in humans causes difficulty in face recognition (Damasio et al., Reference Damasio, Damasio and Van Hoesen1982) known as prosopagnosia. However, it remains unclear how IT neurons are related to the process of face or object recognition.
The ventral pathway arises from the striate cortex. The receptive fields (RFs) of cells in this area are the result of combining the input from geniculate cells, which act as spatial frequency filters (Campbell & Robson, Reference Campbell and Robson1968; Blakemore & Campbell, Reference Blakemore and Campbell1969; Georgeson, Reference Georgeson1980; Kaplan & Shapley, Reference Kaplan and Shapley1982; De Valois & De Valois, Reference De Valois and De Valois1988; Irvin et al., Reference Irvin, Casagrande and Norton1993). The visual information is then processed by means of iterations along the cortical ventral visual pathway until it reaches the IT cortex (Felleman & Van Essen, Reference Felleman and Van Essen1991; Gross, Reference Gross1994; Riesenhuber & Poggio, Reference Riesenhuber and Poggio1999). Since the initial stages of the visual pathway seem to encode spatial frequency components, it is possible that this information could also reach the IT cortex and be used to achieve image selectivity. Some studies reported cells in this area that respond specifically to boundary curvatures described by Fourier descriptors (Schwartz et al., Reference Schwartz, Desimone, Albright and Gross1983). In the present study, we analyzed the responses of IT cells recorded in a monkey performing a face-identification task and report a relationship between cell responses and the spatial frequency components of the images used as stimulus. The aim of our experiment was to find out whether IT cells could produce significant different responses to similar natural images with slightly different spatial frequency components in order to clarify whether spatial frequency is relevant for processing visual information in the IT cortex.
Materials and methods
Animal preparation and behavioral task
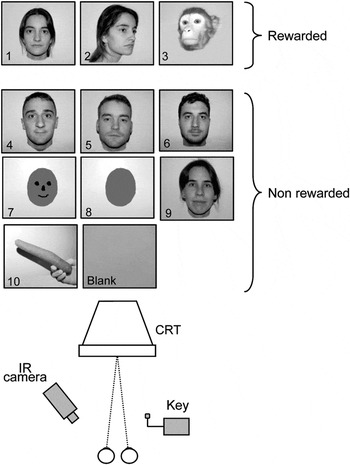
The data for this study were obtained from the right IT cortex of one monkey (Macaca mulatta, male, body weight 5.4 kg). The experimental setup was similar to that described previously (Gonzalez et al., Reference Gonzalez, Krause, Perez, Alonso and Acuña1993; Perez et al., Reference Perez, Castro, Justo, Bermudez and Gonzalez2005). The animal was trained to perform a visual recognition task. We used a total of 10 images, as shown in Fig. 1. Three images were always associated with reward, and the remaining seven images were not associated with reward. An additional blank image not associated with reward was used as a control. All these images were randomly presented on a conventional color cathode ray tube (CRT) monitor placed frontally 57.7 cm (Fig. 1) for a period of 750 ms, followed by a variable intertrial interval ranging from 300 to 600 ms. Each image had 480 × 480 pixels and subtended 18.5 × 18.5 deg of visual angle. If the monkey pressed a key while a reward-associated image was presented, a drop of water was given and the task continued with the next image randomly chosen. On the contrary, if the key was pressed when a nonreward image was present, the trial was aborted and restarted again with a nonreward image. When the key was not pressed while a nonreward image was presented, the task continued with another image randomly chosen. Pressing the key within the first 120 ms after the onset of the image presentation caused the trial to be aborted and restarted again with a new image. All images were equated for mean luminance of 21.6 cd/m2 by using a photometer (Sekonik Digi-Spot, Model L488; Sekonic Corporation Tokyo, Japan).
Images and stimulus setup. A total of 10 images were used, 3 associated to reward and 8 nonreward associated. A blank image was used as control (actually this image was the background used for the remaining images). For a given cell, only a set of six images were used, the three reward associated, two nonreward associated, and the blank image. All images were presented randomly on a computer screen (below). The animal had to press a key only when reward-associated images appeared. To control the eye position, a video camera under infrared illumination was used.

A rigid post was implanted on the anterior part of the skull to fixate the head to a head-holder system. For this, the monkey was anaesthetized with ketamine i.m. (10 mg/kg), followed by sodium pentobarbital i.v. (27 mg/kg). Supplementary pentobarbital was given whenever necessary during the surgical procedure, and analgesics and antibiotics (noramidopirine i.m. 150 mg/kg and penicillin i.m. 50,000 IU/kg) were given at the end of the surgery. Cleaning and asepsis of the implant were made periodically. Ocular movements were monitored by means of a video camera under infrared illumination. A frame grabber (Imagenation PXC200 Imagenation Corporation, Beaverton; OR) attached to a conventional personal computer was used to detect the corneal reflex on the left eye. Only trials with continuous visual fixation on the presented image were collected. All the animal procedures were conducted according to the principles approved by the Institutional Animal Care Committee of the Universidad de Santiago de Compostela.
Cell recording
Cell activity was recorded by means of metal microelectrodes (AM-Systems Inc., Washington, DC). A cylindrical stainless steel chamber was attached to the skull in order to access the right IT cortex following the same surgical procedures stated above. To reach the brain, small craniotomies of 5 mm diameter were made in the exposed skull within the chamber and microelectrode penetrations were made by using an electrohydraulic microdriver mounted on the chamber (Narishige, Tokyo, Japan). Whenever a cell was isolated, a set of six images (three reward related, two nonreward related, and the blank image) were used as stimuli. Neural voltage signals were amplified and filtered by using conventional electronic equipment (Bak Electronics, Rockville, MD). An A/D converter was used to digitize the data sampled at 50 kHz, which were stored in a computer. In order to have online control of the cell responses, a time–amplitude window discriminator was used to convert the amplified and filtered neural signal to Transistor-Transistor Logic (TTL) pulses, which a computer sampled at 1 kHz and stored with stimulus and event markers. At the end of each experiment, we extracted single spikes from the digitized recording by using a time–amplitude digital window in such a way that one to three cells were isolated from each recording. The response characteristics of these cells were quantitatively analyzed afterward by our own Matlab scripts (Matlab; The Mathworks Inc., Natick, MA). At the end of the experiments, the animal was deeply anaesthetized with nembutal. The brain of the animal was perfused with 10% formaline, removed, and placed in the same solution for several days. Sections of 50 microns of the temporal region of the brain were cut and stained with toluidine blue. Electrode tracks were reconstructed using the marks left by the electrodes together with the readings in the microdriver counter and the position of the penetrations relative to the center of the reference craniotomy.
Data analysis
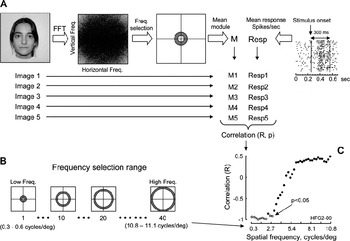
To quantify the cell response to each image, we calculated the firing rate by counting the number of spikes occurring within the 300 ms following the image onset and calculated the response rate for each image presentation (spikes/s). Then, we calculated the mean firing rate for each cell using at least 25 image presentations. Responses to images were assessed by using the analysis of variance (ANOVA, P < 0.05) test to compare the basal response rate of the cell (cell activity during 250 ms previous to the stimulus onset) with the poststimulus response rate (cell activity during 300 ms poststimulus onset). In cells with a statistically significant response for at least three images, we looked for a possible correlation between the cell response and the spatial frequencies of each presented image. For this, we performed a fast Fourier transform for each image and calculated the mean modulus amplitude of 40 ranges of frequencies from 0.3 to 11.1 cycles/deg (approximately 0.3 cycle steps). Fig. 2 schematically shows this procedure. Thus, a mean modulus for each particular range of frequencies for each image was obtained. We quantified the relationship between the mean modulus of each image of each frequency range and the mean response rate of the cell by performing a linear regression analysis between both parameters. The correlation index between each mean modulus and the cell mean response rate was calculated for each image. This procedure was repeated for all frequency ranges, and we obtained 40 correlation indexes, which were plotted against the spatial frequencies. A statistically significant correlation (P < 0.05) indicates that the cell response is related to a particular frequency range.
Schematic representation of data analysis. The frequency components of each of the five images used as stimulus were determined by using a fast Fourier transform (A). Then 40 ranges of frequencies were selected (B) and the mean modulus for each range was calculated (M1–M5). The response of the cell to each of the five images was quantified by calculating the mean response rate (Resp1–5) during 300 ms poststimulus. In this way, we obtained for a given range of frequencies five modulus (one for each image) and five response rates (one for each image). The correlation index (R) between the five modulus and five responses was calculated, so we obtained 40 correlation indexes. Finally, these correlation indexes were plotted against each frequency range (C). Cells sensitive to a given range of frequencies will show a significant correlation index (P < 0.05) for this range.

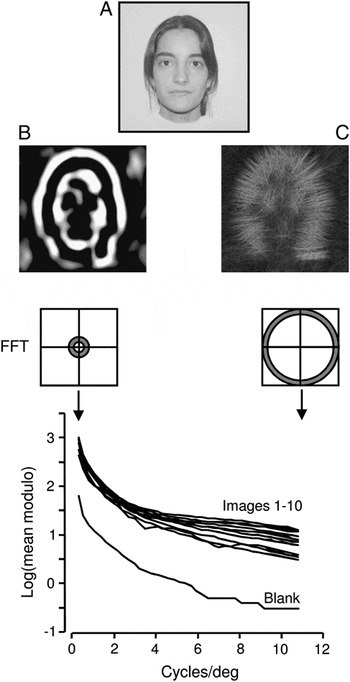
Fig. 3 shows the mean module magnitude for each range of frequencies (approximately 0.3 cycles/deg width) for each image, including the blank image used as control. Despite the similarity of the images, there were differences in the spatial frequency power among the images.
Logarithmic plot of the mean modulus for spatial frequencies from 0.3 to 11.1 cycles/deg calculated by using a fast Fourier transform for the images used in our experiments. It can be observed that, although the images are quite similar (except for the blank image), they differ in their spatial frequency components. The images (B) and (C) were made using the frequencies 0.3–0.6 cycles/deg and 10.5–10.8, respectively, of image (A).

Results
The histology showed that all cells were recorded from the inferior bank of the anterior part of the superotemporal sulcus (STS), which corresponds to the IT cortex. In this region, we found 82 cells that showed statistically significant responses (ANOVA, P < 0.05) to at least one of the images we have used as stimulus. Eleven cells (13.4%) showed responses to only one image, 7 (8.5%) to two images, 9 (11.0%) to three images, 20 (24.4%) to four images, and 35 (42.7%) to five images. We did not observe statistically significant responses to the blank image used for control (ANOVA, P < 0.05).
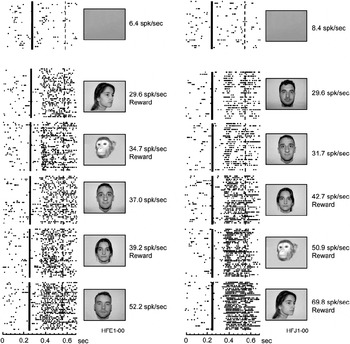
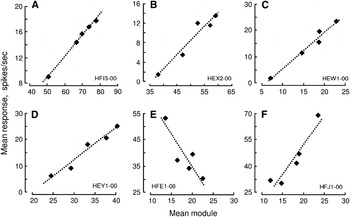
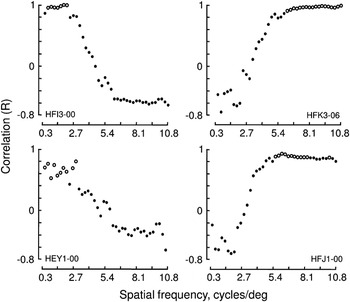
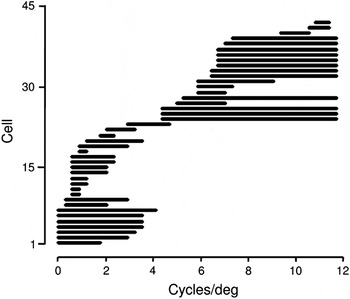
Most cells in our sample responded to three or more images (n = 64, 78%) and showed different mean response rate for each image (Fig. 4). Two thirds of these cells (42/64, 66%) showed responses that significantly correlated with the mean modulus amplitude of at least one frequency range (Fig. 5). The distribution of the correlation index (R) versus the mean modulus amplitude of the frequency ranges had a sigmoid-like profile in virtually all cells, showing a cluster of statistically significant correlation (P < 0.05) only in one region of the distribution in all cases (Fig. 6). This correlation was related to the low range of the frequencies we have used in 23 (55%) cells and to the high range in 19 (45%) cells. Fig. 7 shows the range of spatial frequencies for which each cell showed statistically significant correlated responses (P < 0.05). Most cells showed positive correlation (29 cells, 69%). Negative correlation was found in 13 cells (31%).
Example of responses recorded from two cells in the IT cortex. Cell responses are represented as rasters. Each row corresponds to an image presentation, and each dot represents a cell spike. The continuous line indicates stimulus onset. The response was quantified as the mean response rate calculated by using the responses between stimulus onset and the broken line (300 ms after stimulus onset). Rewarded images are indicated. The mean response rate (spikes/s) to each image is indicated (spikes/s). The correlation between cell response and the mean module for the frequency range 6.6–6.9 cycles/deg for the cell in the left is shown in Fig. 5E. The same correlation for the frequency range 6.3–6.6 cycles/deg for the cell in the right is shown in Fig. 5F.

Correlation between cell response and mean modulus of frequency component of six cells recorded from IT. The frequency ranges (cycles/deg) used for each correlation are (A) 1.6–1.9 (R = 0.99), (B) 2.2–2.4 (R = 0.97), (C) 6.2–6.5 (R = 0.98), (D) 2.4–2.7 (R = 0.95), (E) 6.6–6.9 (R = 0.89), and (F) 6.3–6.6 (P = 0.94). In all cases, P < 0.05. Each dot represents the mean modulus for the indicated spatial frequency range for each image. The dotted line is the regression line.

Plots of correlation indexes (calculated as indicated in Fig. 5) against spatial frequency. Empty dots indicate correlation indexes with P < 0.05. The cell in the left shows a significant correlation for low frequencies, whereas the cell in the right shows good correlation for high frequencies.

Range of spatial frequencies for which cells in our study showed a statistically significant correlated response. Cells are organized from low (bottom) to high (top) spatial frequency range. The frequency range for which each individual cell shows significant correlation is represented as a horizontal line (n = 42).

Discussion
The IT cortex is considered to be the highest end of the ventral processing stream (Logothetis, Reference Logothetis1998). It is a large cortical area extending from the anterior part of the inferior occipital sulcus to a few millimeters posterior to the temporal pole and from the fundus of the STS to the fundus of the occipitotemporal sulcus (Logothetis & Sheinberg, Reference Logothetis and Sheinberg1996). On the basis of topography and laminar organization of projections, the IT can be subdivided into posterior, central, and anterior region, each with a ventral and dorsal portion (Felleman & Van Essen, Reference Felleman and Van Essen1991). According to these reports, our recordings were made in the anterior portion of the IT cortex.
There are a relevant number of studies in humans and monkeys suggesting that the IT plays an important role in object and face recognition (Dean, Reference Dean1976; Desimone & Gross, Reference Desimone and Gross1979; Damasio et al., Reference Damasio, Damasio and Van Hoesen1982; Fuster & Jervey, Reference Fuster and Jervey1982; Desimone et al., Reference Desimone, Albright, Gross and Bruce1984; Tanaka et al., Reference Tanaka, Saito, Fukada and Moriya1991; Komatsu et al., Reference Komatsu, Ideura, Kaji and Yamane1992; Logothetis & Sheinberg, Reference Logothetis and Sheinberg1996). Based on these findings, we used a set of stimuli containing predominately faces, and as expected, we found a large number of cells responding to this type of stimulus. However, our main finding was that the responses of a relevant number of these cells showed a significant correlation with the spatial frequency of the images used as stimuli. This observation agrees with recent neuroimaging and Event Related Potential (ERP) studies that suggest that spatial frequency is a relevant factor for face recognition (Pourtois et al., Reference Pourtois, Dan, Grandjean, Sander and Vuilleumier2005; Rotshtein et al., Reference Rotshtein, Vuilleumier, Winston, Driver and Dolan2007; Nakashima et al., Reference Nakashima, Kaneko, Goto, Abe, Mitsudo, Ogata, Makinouchi and Tobimatsu2008).
Although stimulus selectivity has been reported in the IT cells (Baylis et al., Reference Baylis, Rolls and Leonard1987; Young & Yamane, Reference Young and Yamane1992; Nakamura et al., Reference Nakamura, Matsumoto, Mikami and Kubota1994), they rather show responses to more than one image but with different strength. Therefore, they show preference but not specificity (Desimone et al., Reference Desimone, Albright, Gross and Bruce1984). Indeed, graded responses to faces with several expressions (Sugase et al., Reference Sugase, Yamane, Ueno and Kawano1999; Edwards et al., Reference Edwards, Xiao, Keysers, Foldiak and Perret2003), to shapes (Schwartz et al., Reference Schwartz, Desimone, Albright and Gross1983; Kayaert et al., Reference Kayaert, Biederman, Op De Beek and Vogels2005), and to objects (Kreiman et al., Reference Kreiman, Hung, Kraskov, Quiroga, Poggio and Di Carlo2006) have been reported in IT. Graded responses to a set of different faces, rather than specific responses to individual faces, have also been observed in the STS (Baylis et al., Reference Baylis, Rolls and Leonard1985). Graded responses to several images rather than response to a single image were also the common finding in our study as shown in Fig. 4.
An additional reported characteristic of IT cells is that their responses usually remain invariant over change in size, contrast, and location within their RFs (Schwartz et al., Reference Schwartz, Desimone, Albright and Gross1983; Perrett et al., Reference Perrett, Mistlin and Chitty1989; Gross, Reference Gross2005). However, other studies showed that IT cells discharge maximally to one view of computer-generated three-dimensional objects, and their response declined gradually as the object was rotated away from this preferred view (Logothetis et al., Reference Logothetis, Pauls and Poggio1995). Similar results were obtained when using human heads (Eifuku et al., Reference Eifuku, De Souza, Tamura, Nishijo and Ono2004). In our study, instead of using the same face and change its size or orientation, we presented several faces and observed that most cells were not selective for a given face but rather they responded to several of them, although with different strength (Fig. 4).
Neurons in the visual system seem to act as tuned spatial filters, preserving information about the spatial frequency components of an image. Indeed, there are some examples supporting this hypothesis such as difference-of-Gaussians filters (Rodieck, Reference Rodieck1965) or Gabor filters, which were documented experimentally (Jones & Palmer, Reference Jones and Palmer1987a, Reference Jones and Palmerb; Jones et al., Reference Jones, Stepnoski and Palmer1987). Neurons in the primary visual cortex are sensitive to spatial frequency (Campbell & Robson, Reference Campbell and Robson1968; De Valois et al., Reference De Valois, Albrecht and Thorell1982), and most cortical visual cells in the monkey are tuned to frequencies ranging from 0.5 to 10 cycles/deg (De Valois, Reference De Valois1978; De Valois et al., Reference De Valois, Albrecht and Thorell1982). The available data favor the idea that the retinal image is initially processed through an array of visual filters (Campbell & Robson, Reference Campbell and Robson1968; Blakemore & Campbell, Reference Blakemore and Campbell1969; Kaplan & Shapley, Reference Kaplan and Shapley1982; De Valois & De Valois, Reference De Valois and De Valois1988; Irvin et al., Reference Irvin, Casagrande and Norton1993) and that the visual system carries a frequency-related code (Georgeson, Reference Georgeson1980).
Cells in the IT cortex have large RFs that usually extend into both the contralateral and the ipsilateral visual fields (Gross et al., Reference Gross, Rocha-Miranda and Bender1972; Desimone & Gross, Reference Desimone and Gross1979). This type of RF lacks the structure necessary to be a frequency filter. Therefore, the frequency sensitivity we report here must already be present in the input reaching the IT cortex.
By using filtered images, it has been observed that cells in the lower bank of the STS, considered as part of the IT cortex, respond to low pass– and high pass–filtered facial images (Rolls et al., Reference Rolls, Baylis and Leonard1985, Reference Rolls, Baylis and Hasselmo1987). These findings suggested that IT neurons could act as filters useful in distinguishing faces (Baylis et al., Reference Baylis, Rolls and Leonard1985). Here, we show that the responses observed in IT cells to different images significantly correlate with the frequency components of these images.
The primary visual cortex projects to the extrastriate visual areas in such a way that IT neurons finally receive a converging input from these areas (Desimone et al., Reference Desimone, Fleming and Gross1980). We found that the responses of IT cells correlate with spatial frequencies ranging from 0.3 to 11.1 cycles/deg, which were similar to those reported in the striate cortex. It is possible, however, that some cells in this area could be tuned to frequencies outside of this range, and therefore, this may explain why we failed to find any relationship between response and image frequency components in about one third of cases.
Another source of spatial frequency–related information is the lateral geniculate nucleus (LGN). A population of LGN cells do not degenerate after removal of V1 (Pasik & Pasik, Reference Pasik and Pasik1973; Cowey & Stoerig, Reference Cowey and Stoerig1991), suggesting that, in monkeys, LGN cells not only project to V1 but also outside the striate cortex. It has been shown (Webster et al., Reference Webster, Bachevalier and Ungerleider1993) that the LGN projects to area TEO. Hernandez-Gonzalez et al. (Reference Hernandez-Gonzalez, Cavada and Reinoso-Suarez1994) were able to identify projections from the LGN to the ipsilateral IT cortex in the macaque monkey. This latter projection arises fundamentally from the parvocellular region, which is not surprising since the parvocellular stream conveys information required for object recognition (Livingstone & Hubel, Reference Livingstone and Hubel1988). Most retinal ganglion cells contribute to the visual pathway through the parvocellular LGN (Perry et al., Reference Perry, Oehler and Cowey1984), and therefore, this pathway might be expected to contribute importantly to spatial resolution (Merigan et al., Reference Merigan, Katz and Maunsell1991). The projections arising from the LGN have been considered to subserve residual visual functions present in cortical blindsight (Hernandez-Gonzalez et al., Reference Hernandez-Gonzalez, Cavada and Reinoso-Suarez1994), a condition observed in human and nonhuman primates including macaque monkeys (Cowey & Stoerig, Reference Cowey and Stoerig1991). This projection may carry information related to spatial frequency and consequently the cells we found in IT may reflect this input.
It is assumed that the ventral pathway may use high-order derivatives of image features, structural representation in object-based coordinates, or composite shape tuning dimensions to achieve a more compact, stable, and explicit representation of objects (Connor et al., Reference Connor, Brincat and Pasupathy2007). We found that in a relevant number of IT cells, the responses to complex visual images are related to their spatial frequency components. It is possible, however, that in some cases, cell responses may be related to high-order derivatives of spatial frequency components rather than to the absolute spatial frequency content of the images. These high-order derivatives could be useful to encode information of visual objects independent of size or viewing angle. Usually, in Fourier analysis of signals, only the spectral magnitude information is used and the phase information is discarded. In images, it has been shown that phase may also carry relevant information (Oppenheim & Lim, Reference Oppenheim and Lim1981).
Recent observations revealed that different regions within the occipitotemporal cortex extract distinct visual cues at different spatial frequency ranges in faces, and the output projects forward to the fusiform gyrus (Rotshtein et al., Reference Rotshtein, Vuilleumier, Winston, Driver and Dolan2007). The cells we found in our recordings may be involved in this process.
Acknowledgments
This work was supported by grant BFU2007-61034 from the Ministerio de Education y Ciencia (MEC), Spain, Fondo Europeo de Desarrollo Regional (FEDER), NanoBioMed Consolider-Ingenio 2010, and Rede Galega de Nanomedicina. We are grateful to Victor Leboran for his help with the Fourier analysis.