


Introduction
Early detection of mild cognitive impairment (MCI) and early Alzheimer’s disease (AD) remains a significant challenge in clinical neuropsychology and preventive medicine (García-García-Patino et al., Reference García-García-Patino, Benito-León, Mitchell, Pastorino-Mellado, García García, Ladera-Fernández, Vicente-Villardón, Perea-Bartolomé and Cacho2020; Cacho-Gutiérrez et al., Reference Cacho-Gutiérrez, García-García-Patino, García-García, Aguilera-vega, Vicente-González, Cuevas-Pérez, Perea-Bartolomé, Ladera-Fernández and Benito-León2026a, Reference Cacho-Gutiérrez, García-Patino, García-García, Cuevas-Pérez, Ladera-Fernández, Perea-Bartolomé, Vicente-González and Benito-León2026b). These early symptomatic stages provide a crucial opportunity for intervention, counselling and diagnostic planning, particularly when cognitive symptoms are subtle and functional decline is still limited. However, in daily practice, clinicians often face time pressures when determining whether an older adult’s cognitive complaints reflect expected age-related cognitive changes or early Alzheimer-spectrum impairment.
Although biomarker-based approaches, including cerebrospinal fluid assays and neuroimaging within the amyloid/tau/neurodegeneration (A/T/N) framework, have transformed how we conceptualize AD, brief cognitive screening tools remain highly relevant in everyday care (Jack et al., Reference Jack, Bennett, Blennow, Carrillo, Feldman, Frisoni, Hampel, Jagust, Johnson, Knopman, Petersen, Scheltens, Sperling and Dubois2016). This is especially true in primary care and in specialties such as internal medicine, geriatrics and psychiatry, where access to comprehensive neuropsychological assessment or biomarker testing may be limited. In these settings, a brief bedside instrument can support early triage, guide referral to memory clinics and help identify patients who require more comprehensive diagnostic evaluation.
Many commonly used brief screening tools have limitations in detecting subtle cognitive impairment. The Mini-Mental State Examination (MMSE) (Folstein et al., Reference Folstein, Folstein and McHugh1975), the Mini-Cog (Borson et al., Reference Borson, Scanlan, Brush, Vitaliano and Dokmak2000), the Cognitive Disorders Examination (Codex) (Belmin et al., Reference Belmin, Pariel-Madjlessi, Surun, Bentot, Feteanu, Lefebvre Des Noettes, Onen, Drunat, Trivalle, Chassagne and Golmard2007) and the 10-Point Cognitive Screener (10-CS) (Apolinario et al., Reference Apolinario, Lichtenthaler, Magaldi, Soares, Busse, Amaral, Jacob-filho and Brucki2016) are practical instruments, but they differ in domain coverage and their performance may vary with the population, educational background and selected cutoff (Apolinario et al., Reference Apolinario, Lichtenthaler, Magaldi, Soares, Busse, Amaral, Jacob-filho and Brucki2016; Olazarán et al., Reference Olazarán, Hoyos-Alonso, Del Ser, Garrido Barral, Conde-Sala, Bermejo-Pareja, López-Pousa, Pérez-Martínez, Villarejo-Galende, Cacho, Navarro, Oliveros-Cid, Peña-Casanova and Carnero-Pardo2016; Ziso and Larner, Reference Ziso and Larner2019). In real-world clinical practice, this creates a practical gap: clinicians often need a brief tool that can detect subtle, multidimensional cognitive changes while remaining familiar and easy to administer.
This need is particularly relevant in patients with amnestic multidomain MCI (aMD-MCI) and early AD. Although amnestic MCI can be subdivided into single-domain and multidomain forms, aMD-MCI is especially important in tertiary memory-clinic settings because it often lies close to the dementia threshold and reflects broader cognitive involvement within the prodromal AD continuum (Jicha et al., Reference Jicha, Abner, Schmitt, Cooper, Stiles, Hamon, Carr, Smith and Markesbery2008; Albert et al., Reference Albert, DeKosky, Dickson, Dubois, Feldman, Fox, Gamst, Holtzman, Jagust, Petersen, Snyder, Carrillo, Thies and Phelps2011; Dubois et al., Reference Dubois, Feldman, Jacova, Hampel, Molinuevo, Blennow, DeKosky, Gauthier, Selkoe, Bateman, Cappa, Crutch, Engelborghs, Frisoni, Fox, Galasko, Habert, Jicha, Nordberg, Pasquier, Rabinovici, Robert, Rowe, Salloway, Sarazin, Epelbaum, de Souza, Vellas, Visser, Schneider, Stern, Scheltens and Cummings2014). From a clinical standpoint, this profile presents a demanding but meaningful target for brief screening: the main challenge is not fine-grained staging within impaired groups, but rather distinguishing cognitively unimpaired status from early Alzheimer-spectrum cognitive impairment in patients who warrant further evaluation.
A parsimonious screening approach should integrate signals from cognitive processes known to be vulnerable early in AD. Converging evidence indicates that temporal orientation, delayed episodic recall and clock drawing each provide relevant diagnostic information in the early stages of cognitive impairment (Liu et al., Reference Liu, Luo, Zeng, Gong, Zhang, Zhang, Han, Pan, Pang and Zhang2019; Gómez-Soria et al., Reference Gómez-Soria, Ferreira, Oliván Blázquez, Magallón Botaya and Calatayud2021). Notably, the Clock Drawing Test (CDT) is more than a simple visuoconstructive task. When administered under both command and copy conditions, it can reveal a qualitative command–copy discrepancy, in which the copied clock is better organized than the clock drawn to command; this pattern has been described in early AD (Cacho et al., Reference Cacho, García-García, Fernández-Calvo, Gamazo, Rodríguez-Pérez, Almeida and Contador2005).
From a neurocognitive perspective, the combination of these elements is not random. Early AD-spectrum impairment is linked to dysfunction in medial temporal networks that support episodic memory, including entorhinal-hippocampal circuitry, often before overt dementia becomes apparent (Gallagher and Koh, Reference Gallagher and Koh2011; Berron et al., Reference Berron, Van Westen, Ossenkoppele, Strandberg and Hansson2020). Simultaneously, subtle disruption of higher-order organizational, semantic and executive processes may occur, even when basic visuoconstructive skills remain relatively intact. Drawing a clock to command requires the individual to create an internal representation of the target time, remember the instruction, access semantic knowledge of clock conventions, plan spatial layout, sequence number placement and hand setting, and inhibit inappropriate responses, engaging multiple cognitive operations at once (Shulman, Reference Shulman2000; Paula et al., Reference Paula, Miranda, Moraes and Malloy-Diniz2013; Yuan et al., Reference Yuan, Au, Karjadi, Ang, Devine, Auerbach, DeCarli, Libon, Mez and Lin2022). In contrast, the copy condition provides an external visuospatial scaffold that eases generative and organizational demands and focuses on reproducing an already-structured model (Royall et al., Reference Royall, Cordes and Polk1998; Yuan et al., Reference Yuan, Au, Karjadi, Ang, Devine, Auerbach, DeCarli, Libon, Mez and Lin2022). A relative improvement in copy compared with command may therefore indicate a disproportionate benefit from external support in the context of emerging memory-organizational vulnerability, rather than a purely executive deficit (Cacho et al., Reference Cacho, García-García, Fernández-Calvo, Gamazo, Rodríguez-Pérez, Almeida and Contador2005; Eknoyan et al., Reference Eknoyan, Hurley and Taber2012).
To our knowledge, no widely used brief cognitive screening tool has explicitly incorporated this qualitative CDT command–copy discrepancy as a specific component within a composite scoring system. The General Practitioner Assessment of Cognition (GPCOG) combines episodic memory, temporal orientation and clock drawing in a brief format. However, it does not formally include the command–copy discrepancy as a distinct scoring element (Brodaty et al., Reference Brodaty, Pond, Kemp, Luscombe, Harding, Berman and Huppert2002). This suggests that a brief composite that integrates temporal orientation, delayed recall and the CDT command–copy discrepancy might identify a clinically useful pattern of early Alzheimer-spectrum impairment.
Accordingly, we sought to derive and evaluate CogniScan, a brief composite based on selected elements of the MMSE and the CDT, to detect early cognitive impairment in a specialty memory-clinic cohort. Our primary aim was to determine whether this parsimonious composite could discriminate between cognitively unimpaired older adults and patients with aMD-MCI or early AD, and to estimate its diagnostic accuracy and candidate cutoffs. To support the derivation and visualization of the latent discriminative structure underlying this binary distinction, we used binary partial least squares regression (BPLSR) (Vicente-González et al., Reference Vicente-González, Frutos-Bernal and Vicente-Villardón2025). As a secondary, exploratory aim, we examined whether BPLSR factor maps could reveal internal displacement between aMD-MCI and early AD, while recognizing that the instrument is intended primarily as a binary impairment detector rather than a definitive staging tool.
Methods
Ethical approval and consent to participate
The study was conducted in accordance with the ethical standards of the institutional research committee and the 1975 Declaration of Helsinki, as revised in 2013. The Research Ethics Committee of Salamanca University Hospital granted ethical approval. All participants provided written informed consent before being included in the study.
Study population
Participants with aMD-MCI and early AD were consecutively recruited between September 2009 and February 2014 from the Memory and Dementia Disorders Clinic at Salamanca University Hospital, a public centre serving more than 300,000 residents in Salamanca, Spain. Inclusion criteria were age ≥65 years at enrollment, native Spanish speakers, and the ability to read and write – criteria chosen to ensure relevance to age-related cognitive decline and to minimize heterogeneity from early-onset presentations (Bermejo-Pareja et al., Reference Bermejo-Pareja, Benito-León, Vega, Medrano and Román2008, Reference Bermejo-Pareja, Benito-León, Vega, Olazarán, De Toledo, Díaz-Guzmán, Sánchez-Sánchez, Morales-González, Trincado, Portera-sánchez and Román2009).
The same inclusion/exclusion framework was applied across all groups. Exclusions included a documented history of epilepsy, head injury or major psychiatric disorder (e.g., schizophrenia, bipolar disorder or major depressive disorder with recent psychotic features or hospitalization), and current use of centrally acting medications that may affect cognition (e.g., anxiolytics, stimulants, antipsychotics, antidepressants, antihistamines, antiepileptics). At the time of cognitive testing, participants were recruited consecutively during their initial diagnostic evaluation and had not yet begun cognitive-enhancing treatment. Accordingly, none were receiving acetylcholinesterase inhibitors (donepezil, rivastigmine or galantamine) or memantine.
A structured diagnostic protocol was followed, with standardized cognitive assessments administered by senior neuropsychologists (R.G.G.-P. and Y.C.-P.) (see below) under the supervision of a neurologist specializing in cognitive disorders (J.C.-G.). Testing took place in a quiet, controlled environment at a consistent time of day. It was divided into two sessions (each up to 75 minutes) on separate days to minimize fatigue and practice effects.
Diagnosis of aMD-MCI followed the International Working Group guidelines, requiring objective memory impairment together with impairment in at least one additional domain (Winblad et al., Reference Winblad, Palmer, Kivipelto, Jelic, Fratiglioni, Wahlund, Nordberg, Bäckman, Albert, Almkvist, Arai, Basun, Blennow, de Leon, DeCarli, Erkinjuntti, Giacobini, Graff, Hardy, Jack, Jorm, Ritchie, van Duijn, Visser and Petersen2004). A domain was considered impaired when performance on at least one test was 1.5 standard deviations or more below normative values (Winblad et al., Reference Winblad, Palmer, Kivipelto, Jelic, Fratiglioni, Wahlund, Nordberg, Bäckman, Albert, Almkvist, Arai, Basun, Blennow, de Leon, DeCarli, Erkinjuntti, Giacobini, Graff, Hardy, Jack, Jorm, Ritchie, van Duijn, Visser and Petersen2004). Although language and visuospatial functions were assessed using validated tasks, the predominant pattern in our sample combined deficits in episodic memory and executive function. The aMD-MCI group comprised 35 participants, including 16 men (45.7%) and 19 women (54.3%).
Early AD dementia was diagnosed according to the 2011 National Institute on Aging–Alzheimer’s Association criteria for probable AD dementia (McKhann et al., Reference McKhann, Knopman, Chertkow, Hyman, Jack, Kawas, Klunk, Koroshetz, Manly, Mayeux, Mohs, Morris, Rossor, Scheltens, Carrillo, Thies, Weintraub and Phelps2011). Diagnosis also required a Clinical Dementia Rating score of 1 (Hughes et al., Reference Hughes, Berg, Danziger, Coben and Martin1982). This group comprised 75 participants, including 51 men (68.0%) and 24 women (32.0%).
The control cohort comprised 73 cognitively unimpaired, community-dwelling adults, many of whom were relatives of clinical participants: 39 men (53.4%) and 34 women (46.6%). Controls met the same inclusion and exclusion criteria, with additional requirements to confirm normal cognition: no cognitive complaints; no history of neurological or psychiatric conditions (e.g., stroke, Parkinson’s disease, major depression or anxiety disorders); and no subjective or objective evidence of decline on evaluation. All were functionally independent and underwent comprehensive neurological and neuropsychological examinations to exclude MCI (Winblad et al., Reference Winblad, Palmer, Kivipelto, Jelic, Fratiglioni, Wahlund, Nordberg, Bäckman, Albert, Almkvist, Arai, Basun, Blennow, de Leon, DeCarli, Erkinjuntti, Giacobini, Graff, Hardy, Jack, Jorm, Ritchie, van Duijn, Visser and Petersen2004) or dementia (American Psychiatric Association, 2000).
Neuroimaging was obtained as part of the routine diagnostic workup. Magnetic resonance imaging (MRI) was not part of the standardized protocol and, therefore, was not analysed as a study variable. Computed tomography (CT) was the standard structural imaging modality. In the aMD-MCI group (n = 35), brain CT was available for 34 participants (97%), and single-photon emission computed tomography (SPECT) for 31 (89%). In the early AD group (n = 75), CT was available for 72 participants (96%) and SPECT for 68 (91%).
Instruments
All assessments were administered in Spanish to ensure linguistic and cultural appropriateness for the clinical cohort.
Global cognitive screening
Global cognition was screened with the MMSE (Folstein et al., Reference Folstein, Folstein and McHugh1975).
Dementia Rating Scale–2 (DRS-2)
The Spanish adaptation of the Dementia Rating Scale–2 (DRS-2) was used (Jurica et al., Reference Jurica, Leitten and Mattis2001; Cacho-Gutiérrez et al., Reference Cacho-Gutiérrez, García-García-Patino, García-García, Aguilera-vega, Vicente-González, Cuevas-Pérez, Perea-Bartolomé, Ladera-Fernández and Benito-León2026a). The battery comprises 36 tasks across 5 subscales: Attention (0–37), Initiation/Perseveration (0–37), Construction (0–6), Conceptualization (0–39) and Memory (0–25). The total score (0–144) provides a global index of cognitive performance (Cacho-Gutiérrez et al., Reference Cacho-Gutiérrez, García-García-Patino, García-García, Aguilera-vega, Vicente-González, Cuevas-Pérez, Perea-Bartolomé, Ladera-Fernández and Benito-León2026a).
Memory assessment
Episodic verbal learning and memory were evaluated with the Hopkins Verbal Learning Test–Revised (HVLT-R) (Benedict et al., Reference Benedict, Schretlen, Groninger and Brandt1998). We also used a semantically cued version (HVLT-R-SC) to derive additional indices of retrieval support (Cacho-Gutiérrez et al., Reference Cacho-Gutiérrez, García-Patino, García-García, Cuevas-Pérez, Ladera-Fernández, Perea-Bartolomé, Vicente-González and Benito-León2026b). Delayed visual memory and planning/organization were assessed with the Rey–Osterrieth Complex Figure (Jerskey and Meyers, Reference Jerskey, Meyers, Kreutzer, DeLuca and Caplan2011), which also indexes nonverbal memory relevant to visuospatial processing and encoding strategies (Lezak et al., Reference Lezak, Howieson, Bigler and Tranel2012). The DRS-2 Memory subscale served as a structured measure of verbal episodic memory (Johnson-Greene, Reference Johnson-Greene2004).
Executive functions
Executive performance was indexed using the Attention, Initiation/Perseveration and Conceptualization subscales of the DRS-2 (Johnson-Greene, Reference Johnson-Greene2004), the Trail Making Test, Parts A and B (War Department, Reference War Department1944), and phonemic and category verbal fluency tasks (Benton et al., Reference Benton, Hamsher and Sivan1983).
Neuropsychiatric and functional status
Neuropsychiatric symptoms were characterized with the Geriatric Depression Scale (Yesavage et al., Reference Yesavage, Brink, Rose, Lum, Huang, Adey and Leirer1982) and the Neuropsychiatric Inventory (Cummings et al., Reference Cummings, Mega, Gray, Rosenberg-Thompson, Carusi and Gornbein1994).
For classification as aMD-MCI, participants were required to have preserved functional status, with independence in both basic and instrumental activities of daily living and no evidence of clinically meaningful decline. Functional status was evaluated using informant-based instruments, specifically the Interview for Deterioration in Daily Living Activities in Dementia (IDDD) (Teunisse and Derix, Reference Teunisse and Derix1991) and the Informant Questionnaire on Cognitive Decline in the Elderly (IQCODE) (Morales et al., Reference Morales, González-Montalvo, Bermejo and Del-Ser1995). Final diagnostic classification was established by consensus between a neurologist and a neuropsychologist after individual case review, integrating cognitive performance, functional information from the IDDD and IQCODE, and overall clinical judgment. This process was used to establish preserved functional independence in aMD-MCI and functional impairment consistent with dementia in early AD. CogniScan performance was not used in diagnostic adjudication, thereby avoiding incorporation bias.
CogniScan
CogniScan was derived post hoc from item-level data collected during standard administration of the MMSE and the two-condition CDT. Candidate variables included MMSE item-level responses and a dichotomous CDT command–copy discrepancy indicator (Cacho et al., Reference Cacho, García-García, Fernández-Calvo, Gamazo, Rodríguez-Pérez, Almeida and Contador2005).
During the MMSE, the five temporal-orientation items (weekday, day of the month, month, season and year) were recorded as usual. The three registration words (‘pencil’, ‘orange’ and ‘shoe’) were presented for immediate repetition and later assessed for delayed recall after the intervening MMSE tasks, thereby preserving the usual MMSE delay interval. Immediately after the MMSE, the CDT was administered under two consecutive conditions, command and copy. In the command condition, participants were asked to draw a large round clock, place all the numbers and set the hands to 11:10. Immediately thereafter, a correctly drawn clock was presented, and participants were asked to copy it as accurately as possible.
The final CogniScan score was derived from the nine elements retained in the derivation analysis described below: the five temporal-orientation items, the three delayed-recall words and the CDT command–copy discrepancy indicator. One point was assigned for each incorrect orientation response, each unrecalled word and the presence of a qualitative discrepancy in which the copied clock was clearly better organized than the clock drawn to command. Minor or nonspecific improvement was insufficient to score this discrepancy. The total score ranged from 0 to 9, with higher scores indicating a greater likelihood of cognitive impairment.
Statistical analysis
Derivation of CogniScan
To derive the CogniScan composite, we used BPLSR, a supervised multivariate technique suited to numerous, potentially correlated candidate predictors because it extracts latent components that maximize their association with an external binary outcome (Vicente-González et al., Reference Vicente-González, Frutos-Bernal and Vicente-Villardón2025).
For the derivation analysis, the outcome variable was coded as cognitively unimpaired control = 0 and cognitive impairment = 1, with the impaired group combining participants with aMD-MCI and early AD. Candidate predictors comprised item-level cognitive variables extracted from the MMSE, together with the CDT command–copy discrepancy indicator. In contrast to unsupervised dimension-reduction approaches, which summarize shared variance among predictors, BPLSR was used here to identify the subset of variables showing the strongest association with impaired versus unimpaired status.
Variable retention was based on relative discriminative contribution in the latent BPLSR solution, operationalized by high communalities in the two-dimensional representation and large absolute loadings on Dimension 1, which provided the principal separation between diagnostic groups; no fixed numerical retention cutoff was prespecified. This procedure retained nine variables for the final composite: the five temporal-orientation items (weekday, day of the month, month, season and year), the three delayed-recall words (‘pencil’, ‘orange’ and ‘shoe’) and the dichotomous CDT command–copy discrepancy indicator. These retained variables defined the final CogniScan error score described above.
The resulting latent space was also used to generate factor maps, onto which controls, aMD-MCI and early AD participants were projected to visualize group separation and overlap. All multivariate analyses were performed in the R statistical environment (R Core Team, 2025) using the MultBiplotR package, which implements the BPLSR approach (Vicente-González et al., Reference Vicente-González, Frutos-Bernal and Vicente-Villardón2025).
Descriptive, comparative and diagnostic analyses
Continuous sociodemographic and clinical variables were summarized as medians and interquartile ranges (IQRs), whereas categorical variables were presented as counts and percentages. Because several measures were bounded or ordinal, and IQCODE and IDDD scores deviated significantly from normality (both p < 0.001, Kolmogorov–Smirnov test), comparisons across diagnostic groups (controls, aMD-MCI and early AD) were performed using the Kruskal–Wallis test for continuous or ordinal variables and Pearson’s chi-square (χ 2) test for categorical variables. Because of sparse expected cell counts in the educational-level contingency table, the overall association between educational level and diagnostic group was assessed using the Fisher–Freeman–Halton exact test with Monte Carlo estimation of the two-sided p value.
For Kruskal–Wallis tests, effect size was estimated using the eta-squared analogue, η 2H = (H − k + 1)/(n − k), where H is the Kruskal–Wallis statistic, k is the number of groups and n is the number of observations included in the analysis. For categorical comparisons, effect size was quantified using Cramér’s V, calculated from the Pearson chi-square statistic for the corresponding contingency table. For the educational-level comparison, statistical significance was assessed using the Fisher–Freeman–Halton exact test with Monte Carlo estimation of the two-sided p value, whereas Cramér’s V was reported as the effect-size estimate. The Phi coefficient was used for 2 × 2 tables.
Differences in the nine CogniScan elements between controls and cognitively impaired participants were examined using Pearson’s χ 2 test. Effect sizes were estimated using the Phi coefficient, and percentages were calculated within diagnostic groups.
The diagnostic performance of CogniScan for discriminating cognitively impaired participants from controls was assessed using receiver operating characteristic (ROC) analysis, with estimation of the area under the curve (AUC) and 95% confidence intervals. Candidate cutoffs were examined, and the optimal cutoff was identified using the Youden index (Youden, Reference Youden1950). For clinically relevant cutoffs, sensitivity, specificity, positive predictive value, negative predictive value and accuracy were reported. ROC analyses were performed using the pROC package (Robin et al., Reference Robin, Turck, Hainard, Tiberti, Lisacek, Sanchez and Müller2011); where applicable, epidemiologic estimates and confidence intervals were calculated using epitools (Aragon, Reference Aragon2020). Two binary comparisons were evaluated: cognitively unimpaired controls versus cognitively impaired participants (aMD-MCI plus early AD), and, secondarily, aMD-MCI versus early AD after cognitively unimpaired controls were excluded.
In additional exploratory analyses, we examined whether total CogniScan score among cognitively unimpaired controls was associated with age, sex and educational level using a general linear model. Total CogniScan score was the dependent variable, and age, sex and educational level were predictors. We also fitted a multivariable logistic regression model with cognitive status (cognitively unimpaired control = 0; cognitive impairment = 1) as the dependent variable and total CogniScan score, age, sex and educational level as independent variables. In both models, educational level was entered as a categorical predictor, with primary education as the reference category. The overall effect of educational level was assessed using an omnibus test. Predictor-specific p values were reported for age, sex and total CogniScan score; for the logistic model, we additionally reported the odds ratio (OR) and 95% confidence interval for total CogniScan score, Nagelkerke R 2 and the Hosmer–Lemeshow goodness-of-fit test. Unadjusted comparisons of years of education and the distribution of educational levels characterized the demographic composition of the diagnostic groups. The regression models addressed the separate question of whether categorical educational level was associated with CogniScan score or cognitive status.
Sample-size considerations
No formal a priori sample-size calculation was performed for the exploratory secondary analyses. The study was primarily designed to derive and evaluate CogniScan for binary discrimination between cognitively unimpaired and cognitively impaired participants; therefore, comparisons between aMD-MCI and early AD should be considered exploratory and hypothesis-generating.
Reporting
This study is reported in accordance with the 2015 Standards for Reporting Diagnostic Accuracy Studies (STARD) recommendations (Bossuyt et al., Reference Bossuyt, Reitsma, Bruns, Gatsonis, Glasziou, Irwig, Lijmer, Moher, Rennie, de Vet, Kressel, Rifai, Golub, Altman, Hooft, Korevaar and Cohen2015).
Results
Descriptive analysis of the sample
The final sample comprised 183 participants: 73 cognitively unimpaired controls, 35 with aMD-MCI and 75 with early AD. The median age was 75 years (IQR, 70–81), and the median number of years of education was 8 (IQR, 6–8). Age differed significantly across diagnostic groups (Kruskal–Wallis H = 43.556, df = 2, p < 0.001; η 2H = 0.231). Years of education also differed across groups (Kruskal–Wallis H = 6.113, df = 2, p = 0.047; η 2H = 0.023), although the associated effect size was small. By contrast, the distribution of educational levels did not differ significantly across diagnostic groups (Fisher–Freeman–Halton exact test, Monte Carlo-estimated two-sided p = 0.681; Cramér’s V = 0.131) (Table 1).
Demographic, educational, cognitive and functional characteristics by group

Table 1 Long description
Participant characteristics are compared across amnestic multidomain mild cognitive impairment (35), early Alzheimer’s disease (75), and controls (73), using medians with interquartile ranges for continuous measures and counts with percentages for categories. Age differs across groups: early Alzheimer’s disease is oldest (median 81), aMD-MCI is 76, and controls are 72, with a statistically significant difference. Sex distribution is similar across groups and not statistically significant (male: 45.7% aMD-MCI, 68.0% early Alzheimer’s disease, 53.4% controls). Education is broadly comparable: median years of education is 8 in all groups, with a small but statistically significant difference; education level categories show no significant group differences. Cognitive scores show large group separation: MMSE median is 21 in early Alzheimer’s disease, 26 in aMD-MCI, and 30 in controls; DRS-2 median is 112, 126, and 138 respectively, both with strong statistical differences. Functional and informant-based measures also differ: IDDD median is 45 in early Alzheimer’s disease versus 35 in aMD-MCI and 33 in controls, and IQCODE median is 73 versus 60 and 52, again with strong statistical differences. Overall, early Alzheimer’s disease has the poorest cognition and function, controls the best, and aMD-MCI generally falls between; results are group-level summaries and do not indicate individual outcomes.
Continuous variables are presented as the median (interquartile range); categorical variables are presented as n (%). Continuous variables were analysed using the Kruskal–Wallis test. The eta-squared analogue was calculated as η 2H = (H − k + 1)/(n − k), where H is the Kruskal–Wallis statistic, k is the number of groups and n is the number of observations included in the analysis. Categorical variables were analysed using Pearson’s χ 2 test, except for educational level, which was analysed using the Fisher–Freeman–Halton exact test with a Monte Carlo estimate of the two-sided p value because of sparse expected cell counts. Cramér’s V, calculated from the Pearson χ 2 statistic for the corresponding contingency table, was reported as the effect-size estimate. Abbreviations: AD, Alzheimer’s disease; aMD-MCI, amnestic multidomain mild cognitive impairment; MMSE, Mini-Mental State Examination; DRS-2, Dementia Rating Scale–2; IDDD, Interview for Deterioration in Daily Living Activities in Dementia; IQCODE, Informant Questionnaire on Cognitive Decline in the Elderly; η 2H, eta-squared analogue for Kruskal–Wallis tests; V, Cramér’s V.
Informant-based functional measures showed the expected gradient across diagnostic groups: IQCODE scores increased from cognitively unimpaired controls to aMD-MCI and early AD, and IDDD scores were highest in early AD. These findings supported the functional distinction between aMD-MCI and dementia (Table 1).
Item-level performance of the nine CogniScan elements
At the item level, controls showed near-ceiling performance across the temporal-orientation and delayed-recall elements, with 93–100% correct responses, whereas cognitively impaired participants performed substantially less accurately on the same elements. The CDT command–copy discrepancy was absent in 90.4% of controls and present in 92.7% of cognitively impaired participants. All nine elements were significantly associated with cognitive status (all p < 0.001), with large effect sizes (Phi, 0.79–0.85) (Table 2).
Association between cognitive status and errors in CogniScan elements

Table 2 Long description
Cognitive status is compared with the frequency of errors across CogniScan elements for controls (73 people) versus a cognitive impairment group (110 people). Orientation errors were rare in controls (0 to 2.7 percent) but common with cognitive impairment: weekday 86.4 percent, day of the month 86.4 percent, month 83.6 percent, season 80.9 percent, and year 86.4 percent. Recall failures for the three words were also uncommon in controls (0 percent for pencil and orange, 6.8 percent for shoe) and very frequent with cognitive impairment (84.5 percent pencil, 82.7 percent orange, 87.3 percent shoe). A Clock Drawing Test command–copy discrepancy occurred in 9.6 percent of controls versus 92.7 percent of the cognitive impairment group. Every item comparison reports a p value below 0.001, indicating strong evidence of group differences. Effect sizes are consistently large (Phi about 0.79 to 0.85), suggesting substantial separation between groups. Percentages are calculated within each cognitive-status group, so they should not be interpreted as overall population rates.
Values are n (%), with percentages calculated within each cognitive-status group. The cognitive impairment group combines participants with aMD-MCI and early AD. For the CDT row, the error state corresponds to a command–copy discrepancy in which the copied clock was better organized than the clock drawn to command. Pearson’s χ 2 test was used for item-level comparisons. Effect size is reported as the Phi coefficient, calculated from the Pearson χ 2 statistic. Abbreviations: AD, Alzheimer’s disease; aMD-MCI, amnestic multidomain mild cognitive impairment; CDT, Clock Drawing Test.
BPLSR factor map: full item set
The BPLSR factor map based on the full candidate item set showed that the principal fitted separation occurred along Dimension 1, with cognitively unimpaired controls displaced from cognitively impaired participants (aMD-MCI plus early AD) (Figure 1). Dimension 2 captured a smaller proportion of residual variation. Together, the first two dimensions accounted for 78.9% of the variability in diagnostic-group indicator coding. Within the impaired group, the aMD-MCI and early AD centroids were displaced, but their group envelopes overlapped, indicating partial rather than complete separation. Because BPLSR is a supervised method, the map should be interpreted as a descriptive representation of the fitted latent structure rather than as independent evidence of diagnostic validation.
Binary partial least squares regression (BPLSR) factor map using the full candidate Mini-Mental State Examination (MMSE) and Clock Drawing Test (CDT) item set. Small points represent individual participants, large filled points represent group centroids and colored polygons indicate group envelopes for cognitively unimpaired controls (blue), amnestic multidomain mild cognitive impairment (aMD-MCI; red) and early Alzheimer’s disease (AD; green). Labelled vectors show the fitted directions of association between candidate variables and the first two latent dimensions; longer vectors indicate stronger representation in the displayed two-dimensional solution. Variable labels shown in red identify the nine elements retained for the final CogniScan composite. Dimension 1 provides the principal fitted separation between controls and cognitively impaired participants, whereas overlap between the aMD-MCI and early AD envelopes indicates only partial stage separation. Because BPLSR is supervised, the map is a descriptive representation of the fitted latent structure rather than an independent validation of diagnostic performance.

Figure 1 Long description
The factor map displays two dimensions labeled Dimension 1 and Dimension 2. It includes small points representing individual participants and larger filled points indicating group centroids. The map shows three group envelopes: cognitively unimpaired controls, amnestic multidomain mild cognitive impairment (aMD-MCI) and early Alzheimer’s disease (AD). Labeled vectors indicate the directions of association between test items and the two dimensions. The vectors are labeled with various cognitive test items such as ′Sentence′, ′Hospital′ and ′Put on floor′. The map illustrates the separation between controls and cognitively impaired participants along Dimension 1, with overlap between the aMD-MCI and early AD groups. The map is a descriptive representation of the fitted latent structure.
BPLSR factor map: selected items
Repeating the BPLSR analysis with the nine retained CogniScan elements – the five temporal-orientation items (weekday, day of the month, month, season and year), the three delayed-recall words (pencil, orange and shoe) and the CDT command–copy discrepancy indicator, defined as a copied clock that was better organized than the clock drawn to command – reproduced the principal fitted separation observed with the full candidate item set (Figure 2). The first two dimensions accounted for 76% of the variability in diagnostic-group indicator coding. Controls remained distinct from cognitively impaired participants, whereas the aMD-MCI and early AD envelopes continued to overlap. These findings indicate that the reduced item set retained most of the latent discriminative structure represented by the full candidate model.
Binary partial least squares regression (BPLSR) factor map using the nine retained CogniScan elements: weekday, day of the month, month, season, year, delayed recall of pencil, delayed recall of orange, delayed recall of shoe and the Clock Drawing Test (CDT) command–copy discrepancy indicator, defined by a copied clock that was better organized than the clock drawn to command. The overlaid vectors show the fitted directions of association between retained variables and the first two latent dimensions; the longer black vector corresponds to the CDT discrepancy indicator. Small points represent individual participants, large filled points represent group centroids and colored polygons indicate group envelopes for cognitively unimpaired controls (blue), amnestic multidomain mild cognitive impairment (aMD-MCI; red) and early Alzheimer’s disease (AD; green). The reduced model preserves the principal fitted separation between controls and cognitively impaired participants, whereas aMD-MCI and early AD remain displaced but overlapping. As a supervised representation, the map should not be interpreted as independent validation of diagnostic performance.

Figure 2 Long description
The factor map illustrates the dimensions of cognitive impairment groups. The horizontal axis is labeled Dimension 1 and the vertical axis is labeled Dimension 2. The map includes three main groups: controls, amnestic multidomain mild cognitive impairment (aMD-MCI) and early Alzheimer′s disease (AD). Each group is represented by a polygon with different colors: blue for controls, red for aMD-MCI and green for early AD. The polygons indicate group envelopes, with small points representing individual participants and large filled points representing group centroids. Overlaid vectors show the directions of association between retained variables and the first two latent dimensions. The longest vector corresponds to the Clock Drawing Test (CDT) discrepancy indicator, labeled as ′CDT (copy > command)′. Other variables include weekday, day of the month, month, season, year and recall items such as pencil, orange and shoe. The map visually separates controls from cognitively impaired participants, while aMD-MCI and early AD groups remain displaced but overlapping.
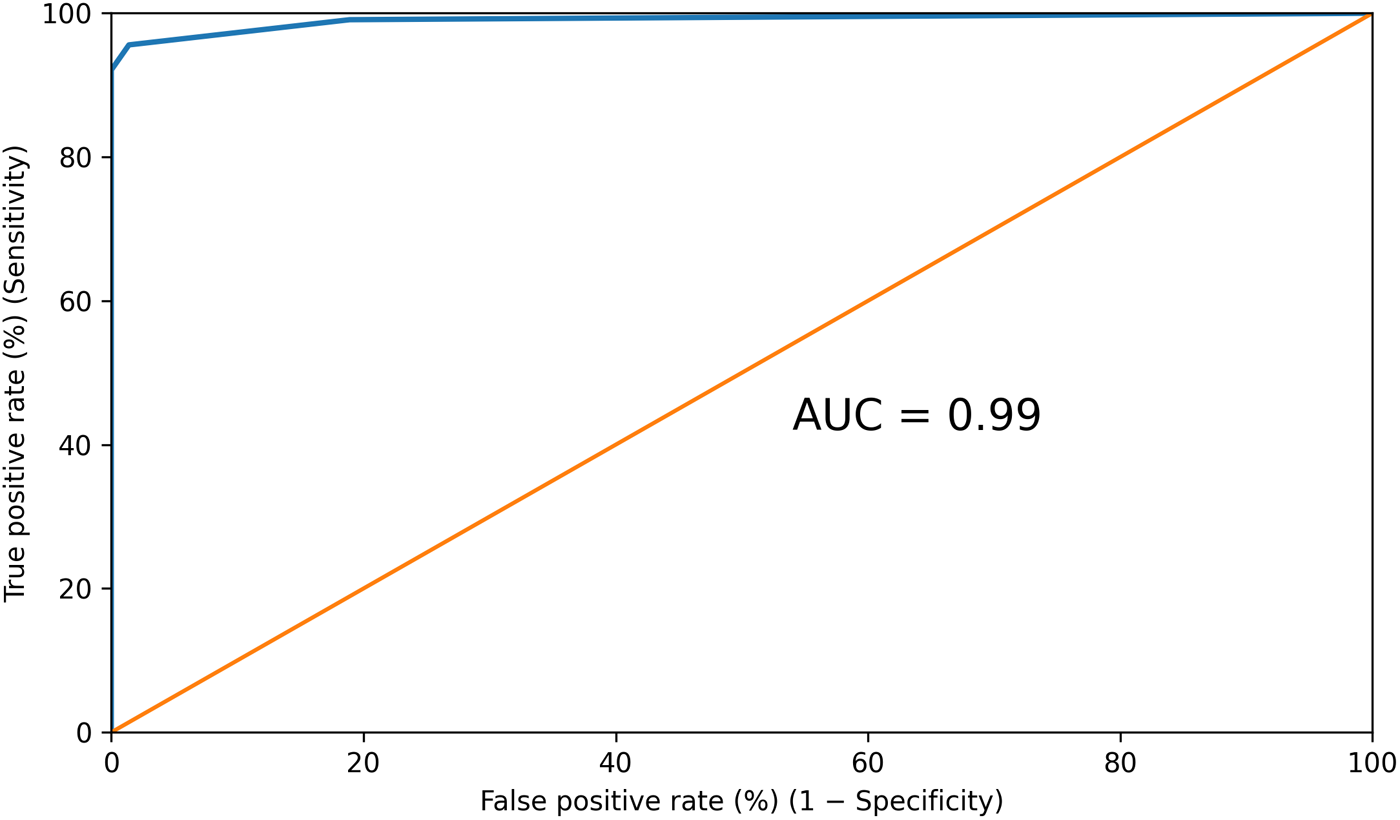
Receiver operating characteristic (ROC) curve for total CogniScan errors in classifying cognitively unimpaired controls versus cognitively impaired participants (amnestic multidomain mild cognitive impairment [aMD-MCI] plus early Alzheimer’s disease [AD]). The area under the curve (AUC) was 0.99 (95% confidence interval 0.98–1.00). The Youden-optimized cutoff was ≥2 errors. The alternative cutoff of ≥1 error increases sensitivity at the expense of specificity and therefore produces more false-positive screens. The diagonal line denotes no discrimination (AUC 0.50).

Item projections provided a descriptive view of the fitted structure: correct responses on temporal-orientation and delayed-recall items aligned primarily with the control centroid, whereas the CDT command–copy discrepancy indicator aligned more closely with the early AD centroid. Because these projections derive from a supervised latent solution, they do not establish that any single element is specific to a particular diagnostic stage.
Diagnostic performance in the derivation sample
Diagnostic accuracy was evaluated a priori as a binary outcome (cognitively unimpaired controls versus aMD-MCI plus early AD). ROC analysis demonstrated excellent discrimination between cognitively unimpaired and cognitively impaired participants, with an AUC of 0.99 (95% confidence interval 0.98–1.00) (Figure 3). A cutoff of ≥2 errors provided the optimal balance between sensitivity (96%) and specificity (99%), corresponding to the highest Youden index (0.94). At this cutoff, the positive predictive value was 99%, the negative predictive value was 94% and accuracy was 97%. Lowering the cutoff to ≥1 error increased sensitivity to 99% but reduced specificity to 81%, thereby increasing false-positive screens. Cutoff selection should therefore reflect the intended clinical context: ≥1 error may be considered when sensitivity-oriented case-finding is prioritized, whereas ≥2 errors may be preferable when a positive result triggers resource-intensive investigations or therapeutic decisions (Table 3).
Receiver operating characteristic cutoff values and classification metrics

Table 3 Long description
Classification performance is reported for multiple error-count cutoffs used to label participants as cognitively impaired when their errors meet or exceed the cutoff. At 1 error, sensitivity is very high at 99% but specificity is lower at 81%, with 92% accuracy. The strongest combined performance occurs at a cutoff of 2 errors, with 96% sensitivity, 99% specificity, a Youden index of 0.94, 99% positive predictive value, 94% negative predictive value, and 97% accuracy. Raising the cutoff from 3 to 8 errors keeps specificity at 100% and positive predictive value at 100%, but sensitivity steadily drops from 92% to 73%, and accuracy declines from 95% to 84%. Negative predictive value also decreases as the cutoff increases, from 89% at 3 errors to 72% at 8 errors. Overall, stricter cutoffs reduce false positives but increase missed impaired cases, and predictive values and accuracy reflect the sample’s observed distribution.
Cutoffs correspond to integer error counts, with participants classified as cognitively impaired when errors were greater than or equal to the specified cutoff. Sensitivity and specificity were derived from receiver operating characteristic analysis. The Youden index was calculated as sensitivity + specificity − 1. Positive predictive value, negative predictive value and accuracy were calculated from the observed sample distribution. The optimal cutoff was ≥2 errors.
Among cognitively unimpaired controls, age was significantly associated with total CogniScan score (p = 0.021), whereas sex (p = 0.791) and the overall effect of categorical educational level (omnibus p = 0.331) were not significant. In the multivariable logistic regression model, total CogniScan score remained significantly associated with cognitive impairment (OR per one-error increase, 52.7; 95% confidence interval 4.7–585.9; p < 0.001), whereas age, sex and the overall effect of categorical educational level were not independently associated with cognitive status. The model yielded a high Nagelkerke pseudo-R 2 (0.95), and the Hosmer–Lemeshow test showed no evidence of lack of fit (χ 2 = 1.79, df = 8, p = 0.99). These models evaluated categorical educational level rather than continuous years of education and therefore addressed a question distinct from the unadjusted between-group comparison. The wide confidence interval around the OR indicates considerable imprecision, so these exploratory findings should be interpreted cautiously.
Secondary exploratory analysis: discrimination between aMD-MCI and early AD
In the prespecified secondary exploratory analysis restricted to cognitively impaired participants, total CogniScan score showed lower discrimination between aMD-MCI and early AD than in the primary binary analysis (AUC 0.89, 95% confidence interval 0.82–0.97). This result was consistent with the partial overlap between the groups on the fitted BPLSR maps.
Discussion
In this single-centre derivation cohort, CogniScan showed excellent apparent discrimination between cognitively unimpaired controls and participants with Alzheimer-spectrum cognitive impairment (aMD-MCI plus early AD). The primary binary ROC analysis yielded a high AUC, and the supervised BPLSR maps showed a corresponding fitted separation. By contrast, discrimination between aMD-MCI and early AD was lower, and overlap between their group envelopes cautions against interpreting CogniScan as a definitive staging instrument. The findings therefore support its intended use primarily as a binary detector of cognitive impairment.
The biological and cognitive rationale for selecting these three components is plausible and consistent with prior work. First, temporal orientation has been proposed as a potential early behavioural marker of posterior-medial network involvement along the AD continuum; in cognitively unimpaired older adults, worse temporal orientation has been associated with higher tau burden in retrosplenial and precuneus regions, supporting its inclusion in a parsimonious composite (Dubbelman et al., Reference Dubbelman, Elias, Palmer, Dafni-merom, Gazit, Udeogu, Wang, Papp, Amariglio, Arzy and Marshall2025).
Second, delayed free recall is a cornerstone bedside measure strongly associated with medial temporal lobe-dependent episodic memory in prodromal stages. Delayed-recall performance is associated with medial temporal lobe structure (including hippocampal and entorhinal regions) and has been proposed as a clinically valid ‘gateway’ cognitive biomarker for AD, which is why word-recall tasks are central to many brief screening tools (Apolinario et al., Reference Apolinario, Lichtenthaler, Magaldi, Soares, Busse, Amaral, Jacob-filho and Brucki2016; Cerami et al., Reference Cerami, Dubois, Boccardi, Monsch, Demonet and Cappa2017).
These first two components also align with population-based evidence from primary care. In a cross-sectional study of older adults evaluated in a primary care setting, Gómez-Soria et al. found that temporal orientation and short-term memory (together with attention) were among the constructs showing early relative deterioration and were significant predictors of global cognitive impairment, supporting the diagnostic weight of orientation and delayed recall in prodromal or incipient stages (Gómez-Soria et al., Reference Gómez-Soria, Ferreira, Oliván Blázquez, Magallón Botaya and Calatayud2021).
Third, the command–copy discrepancy pattern, in which the copied clock is better organized than the clock drawn to command, should not be interpreted as a purely executive marker. Drawing a clock on command requires generating an internal representation of the requested time, maintaining the instruction, planning and sequencing, inhibiting prepotent responses (particularly for configurations such as 11:10), accessing semantic knowledge of clock conventions and organizing visuospatial construction; by contrast, the copy condition reduces several of these demands by providing an external visuospatial scaffold. Accordingly, the command–copy discrepancy pattern most likely reflects an interaction of memory, executive control and visuoconstructive processes rather than an isolated executive deficit (Cacho et al., Reference Cacho, García-García, Fernández-Calvo, Gamazo, Rodríguez-Pérez, Almeida and Contador2005), and composite approaches combining MMSE items with clock drawing have demonstrated diagnostic utility in mild AD (Cacho et al., Reference Cacho, Benito-León, García-García, Fernández-Calvo, Vicente-Villardón and Mitchell2010). Recent digital CDT work is broadly consistent with this interpretation by suggesting that command and copy conditions engage partly distinct subsystems and provide complementary information (Frank et al., Reference Frank, Bandyopadhyay, Dion, Formanski, Matusz, Penney, Davis, O’Connor, Au, Amini, Rashidi, Tighe, Libon and Price2025), while traditional ‘static’ CDT scoring can show limited sensitivity for subtle impairment, suggesting that qualitative or process-level indices may be more sensitive to subtle change than purely static scoring (Kehl-Floberg et al., Reference Kehl-Floberg, Marks, Edwards and Giles2023). A recent six-class framework of qualitative clock-drawing errors across dementia etiologies and MCI further underscores the clinical interpretability of structured qualitative clock analysis beyond global clock scores (Banik et al., Reference Banik, Pal, Pal, Pal, Dutta, Roy, Chattopadhyay and Benito-León2026).
From a neurobiological perspective, this interpretation is broadly consistent with contemporary models of AD in which early medial temporal lobe pathology disrupts episodic memory, followed by wider involvement of posterior association networks – including temporoparietal and posterior medial systems – that support visuospatial organization and higher-order control processes (Seeley et al., Reference Seeley, Crawford, Zhou, Miller and Greicius2009; Ranganath and Ritchey, Reference Ranganath and Ritchey2012; Jack et al., Reference Jack, Bennett, Blennow, Carrillo, Dunn, Haeberlein, Holtzman, Jagust, Jessen, Karlawish, Liu, Molinuevo, Montine, Phelps, Rankin, Rowe, Scheltens, Siemers, Snyder and Sperling2018). This framework aligns with the neuropathological staging of Alzheimer-related changes, in which tau pathology progresses from the transentorhinal/entorhinal regions to limbic structures and subsequently to the association neocortex, including the temporoparietal cortices, as the disease advances into symptomatic stages (Braak and Braak, Reference Braak and Braak1991; Braak and Del Tredici, Reference Braak and Del Tredici2015). In this context, combining delayed recall and temporal orientation with a CDT-derived organizational discrepancy indicator provides convergent sampling of cognitive operations that depend on partially overlapping medial temporal and posterior association networks, which may help explain the strong discrimination observed in early AD-spectrum impairment (Greicius et al., Reference Greicius, Srivastava, Reiss and Menon2004; Buckner et al., Reference Buckner, Andrews-Hanna and Schacter2008).
Our analogue CDT command–copy discrepancy indicator is conceptually related to the process-level signals captured in the digital CDT literature, although it is not a direct substitute for stroke-level digital features. In large community cohorts, digital CDT-derived features have been associated with global neuropsychological performance and structural MRI measures, supporting the value of clock-based metrics beyond simple pass/fail scoring (Yuan et al., Reference Yuan, Libon, Karjadi, Ang, Devine, Auerbach, Au and Lin2021, Reference Yuan, Au, Karjadi, Ang, Devine, Auerbach, DeCarli, Libon, Mez and Lin2022). Digital CDT metrics have also been associated with AD biomarkers in some cohorts. In clinically normal older adults, a Class II study reported associations between digital CDT performance and amyloid and tau positron emission tomography (PET) measures (Rentz et al., Reference Rentz, Papp, Mayblyum, Sanchez, Klein, Souillard-Mandar, Sperling and Johnson2021). More recent work identified specific digital CDT features associated with amyloid and tau biomarkers in low-risk older adults (Ding et al., Reference Ding, Lyu, Karjadi, Sunderaraman, Young, Mormino, Low, Devine, Gifford, Au and Lin2025). These findings support the mechanistic coherence of the composite and provide a rationale for future digital augmentation.
We did not perform head-to-head comparisons with other brief instruments in the same sample; comparative performance should therefore be interpreted with caution. Published Mini-Cog estimates vary by target condition and clinical setting (Abayomi et al., Reference Abayomi, Sritharan, Yan, Saripella, Alhamdah, Englesakis, Tartaglia, He and Chung2024). The 10-CS combines temporal orientation, word recall and category fluency rather than a CDT command–copy discrepancy (Apolinario et al., Reference Apolinario, Lichtenthaler, Magaldi, Soares, Busse, Amaral, Jacob-filho and Brucki2016). By focusing on three mechanistically coherent signals and allowing the cutoff to be selected according to intended use, CogniScan may offer a transparent approach for clinical pathways.
Educational attainment can influence performance on brief cognitive tests and may increase false-positive rates. The unadjusted omnibus comparison identified a small between-group difference in years of education, whereas the categorical distribution of educational levels did not differ significantly. These analyses describe group composition; they do not test whether education influences CogniScan performance. The exploratory regression models addressed a different question and used categorical educational level, rather than years of education, as the education-related predictor. Within the observed range, categorical educational level was not significantly associated with CogniScan score among controls and was not an independent predictor of cognitive status in the multivariable model. Thus, the models did not detect an association with categorical educational level, but they do not exclude an association with years of education. Their exploratory nature and the restricted educational range preclude firm conclusions regarding educational robustness. Broader calibration, including participants with very low literacy and higher educational attainment, remains necessary. This interpretation is consistent with recent work emphasizing low-literacy, culturally fair screening tools and the relative value of orientation and recall (Zegarra-Valdivia et al., Reference Zegarra-Valdivia, Chino, Tituana, Zapata-Restrepo, Unaucho, López-Norori, Paredes-Manrique and Custodio2025). Research on the CDT has likewise addressed fairness, including methods intended to mitigate educational and racial bias in automated classification (Zhang et al., Reference Zhang, Bandyopadhyay, Kimmet, Wittmayer, Khezeli, Libon, Price and Rashidi2024).
Cutoff selection should be guided by intended clinical use. A cutoff of ≥1 error provides the greatest sensitivity (99%) but lower specificity (81%), thereby increasing false-positive screens. The ≥2-error cutoff retains high sensitivity (96%) while providing substantially greater specificity (99%) and may therefore be preferable when a positive result leads to resource-intensive investigations or therapeutic decisions. CogniScan is a screening instrument, not a diagnostic test; a positive result should prompt comprehensive clinical assessment rather than be interpreted as a diagnosis of dementia. Table 3 makes these trade-offs explicit and allows cutoffs to be selected according to population risk, downstream capacity and the consequences of false-positive and false-negative classifications.
In routine practice, CogniScan may support triage and referral through a brief, structured assessment. For staging within the impaired group (aMD-MCI versus early AD), however, it should be regarded as supportive rather than definitive; staging should continue to rely on comprehensive neuropsychological assessment, informant history, functional assessment of activities of daily living and biomarkers, where available. Pragmatic evidence outside neurology suggests that brief, culturally sensitive tools embedded within decision support may influence clinical management in addition to discrimination metrics. In a primary-care trial, a culturally fair detection tool increased dementia-related care actions compared with usual care (Verghese et al., Reference Verghese, Chalmer, Stimmel, Weiss, Zwerling, Malik, Rasekh, Ansari, Corriveau, Ehrlich, Wang and Ayers2024). Whether CogniScan produces similar downstream effects requires prospective implementation studies.
This study has several limitations. First, its single-centre, cross-sectional design limits generalizability and precludes prognostic inference. Second, item selection, score construction, cutoff optimization and AUC estimation were performed in the same cohort; the reported diagnostic indices therefore reflect apparent performance and may be optimistic. Moreover, because the BPLSR maps are supervised representations of the fitted latent structure, they do not provide independent validation. Internal validation using resampling methods, followed by external validation in independent cohorts, is needed before fixed cutoffs can be recommended for routine clinical use. Third, comparing carefully characterized cognitively unimpaired controls – many of whom were relatives of clinical participants – with patients recruited from a tertiary memory clinic may have introduced spectrum and referral bias, potentially inflating discrimination relative to primary-care or population-based settings. The impaired sample was also enriched for aMD-MCI and early AD, limiting generalizability to nonamnestic and single-domain MCI phenotypes. Fourth, the qualitative CDT command–copy discrepancy was not formally assessed for interrater reliability; future studies should use standardized scoring instructions, blinded raters and reproducibility estimates. Fifth, discrimination between aMD-MCI and early AD was exploratory, and no formal power calculation was performed for stage discrimination or three-group separation. This question will require larger studies using a prespecified multinomial framework. Sixth, biomarker confirmation was not universal; future work should evaluate CogniScan within contemporary A/T/N frameworks and determine its incremental value beyond plasma biomarkers and structural imaging. Finally, the education-related analyses were exploratory and conducted in a relatively narrow sample of literate older adults. The regression models evaluated categorical educational level rather than continuous years of education; therefore, the absence of an association with educational level should not be interpreted as evidence that CogniScan is unaffected by education or that measurement invariance has been established. Broader calibration across demographic, educational, linguistic and cultural groups, together with formal measurement-invariance testing, is required before conclusions about demographic robustness can be drawn.
Several next steps follow from these findings. First, longitudinal studies should determine whether baseline CogniScan scores – or short-interval change scores – predict conversion from aMD-MCI to AD and add prognostic information beyond age, apolipoprotein E and blood-based biomarkers; decision-curve analysis could quantify net clinical benefit within realistic referral pathways. Second, head-to-head prospective comparisons with the Mini-Cog, 10-CS, Codex and Montreal Cognitive Assessment (MoCA) should evaluate binary and multinomial endpoints in primary-care and community settings, together with cost-effectiveness. Third, digital augmentation of the CDT component could capture latency, velocity and stroke-level metrics associated with subtle change and with MRI and PET measures; complementary spatial-orientation tasks delivered in immersive or semi-immersive formats may provide additional risk signals linked to entorhinal–retrosplenial circuitry (Shima et al., Reference Shima, Ohdake, Mizutani, Tatebe, Koike, Kasai, Bagarinao, Kawabata, Ueda, Ito, Hata, Ishigaki, Yoshimoto, Toyama, Tokuda, Takashima and Watanabe2025).
In closing, this three-component, pattern-based composite showed excellent apparent discrimination in the derivation cohort and offers alternative cutoffs that can be selected according to clinical priorities. By sampling temporal orientation, delayed recall and the CDT command–copy discrepancy, CogniScan captures cognitive operations that differed across cognitively unimpaired controls, aMD-MCI and early AD. The BPLSR maps indicated that the retained features preserved the principal fitted latent structure after item reduction, whereas ROC analysis showed excellent apparent discrimination in the same cohort. Internal and external validation are required before routine implementation. With multicenter and longitudinal validation and calibration across broader demographic strata, CogniScan may support timely referral and further etiologic evaluation.
Availability of data and materials
The data that support the findings of this study are available from the corresponding author upon reasonable request and subject to applicable data protection and privacy regulations.
Acknowledgements
Dr Julián Benito-León is supported by the National Institute of Neurological Disorders and Stroke (NINDS), National Institutes of Health (R01 NS39422 and R01 NS094607) and by the Recovery, Transformation, and Resilience Plan of the Spanish Ministry of Science and Innovation (grants TED2021-130174B-C33, NETremor, and PID2022-138585OB-C33, Resonate).
Author contributions
J.C.-G.: study conception and organization; writing – original draft. R.G.G.-P.: study conception and organization; writing – original draft. R.G.-G.: study conception and organization; writing – review and editing. Y.C.-P.: study conception, organization and execution; writing – review and editing. J.L.V.-V.: study conception, organization and execution; statistical methodology and analysis; writing – review and editing. M.V.P.-B.: study conception, organization and execution; writing – review and editing. J.B.-L.: study conception and organization; writing – original draft; writing – review and editing; supervision.
Financial support
This study received no specific grant from any funding agency in the public, commercial or not-for-profit sectors.
Competing interests
The authors declare no conflicts of interest.
Ethical standards
The study was conducted in accordance with the ethical standards of the institutional research committee and with the 1975 Declaration of Helsinki, as revised in 2013. Ethical approval was obtained from the Research Ethics Committee of Salamanca University Hospital. All participants provided written informed consent before inclusion in the study.




 Open access

