Implications
Supermarket chains in various countries are defining requirements for suppliers to provide data on the carbon footprint of products. The user inputs into OVERSEER® Nutrient Budgets allow farm-specific greenhouse gas emissions to be estimated and product carbon footprints from the ‘cradle-to-farm-gate’ to be produced for pastoral systems with co-products.
Introduction
A range of New Zealand studies have determined the carbon footprint of primary products from the ‘cradle-to-farm-gate’ or ‘cradle-to-grave’ using life cycle assessment (LCA), including milk (Ledgard et al., 2008; Flysjö et al., Reference Flysjö, Henriksson, Cederberg, Ledgard and Englund2011), lamb meat (Ledgard et al., Reference Ledgard, McDevitt, Boyes, Lieffering and Kemp2009 and Reference Ledgard, Lieffering, Coup and O'Brien2011a), beef meat (Lieffering et al., Reference Lieffering, Ledgard, Boyes and Kemp2010a and Reference Lieffering, Ledgard, Boyes and Kemp2010b), wool (Rankin et al., Reference Rankin, Ledgard and Boyes2010), kiwifruit (Mithraratne et al., Reference Mithraratne, Barber and McLaren2010) and apples (Frater, Reference Frater2010). These carbon footprints were produced using LCA procedures that meet PAS 2050 (BSI, 2011) or ISO 14044 recommendations. Some of these studies compared data from a range of countries, but Gac et al. (Reference Gac, Ledgard, Lorinquer, Boyes and Le Gall2012) noted the need for common methods to be used. Additional studies have also been reported on inputs used within the primary sector in New Zealand, such as fertilisers (Ledgard et al., Reference Ledgard, Boyes and Brentrup2011b), electricity, fuel and transport (Nebel, Reference Nebel2008).
In general for products from pastoral agricultural systems such as milk and meat, greenhouse gas (GHG) emissions from the ‘cradle-to-farm-gate’ (on-farm emissions plus embodied emissions from products used on the farm) represent 70% to 90% of the total carbon footprint (Ledgard et al., Reference Ledgard, McDevitt, Boyes, Lieffering and Kemp2009 and Reference Ledgard, Lieffering, Coup and O'Brien2011a), largely because of animal-related methane and nitrous oxide emissions. In contrast, GHG emissions from the ‘cradle-to-farm-gate’ represent 20% to 40% of the total emissions for some crops used for human consumption (Barber et al., Reference Barber, Pellow and Marber2011) and 15% to 25% for horticultural products such as apples (Frater, Reference Frater2010) and kiwifruit (Mithraratne et al., Reference Mithraratne, Barber and McLaren2010).
OVERSEER® Nutrient Budgets (Overseer) is a farm-specific nutrient management tool used in New Zealand. It is an integrated model that allows multiple animal enterprises (dairy, dairy replacements, sheep, beef, deer, dairy goats and others), as well as cut and carry, horticultural and cropping systems to be modelled for a single farm. The structure of the model allows farm-specific GHG emissions to be estimated, including on-farm emissions (methane and nitrous oxide) and embodied emissions from inputs used on the farm (Wheeler et al., Reference Wheeler, Ledgard and DeKlein2008). Since the release of the original model, international LCA standards (e.g. PAS 2050 (BSI 2011)) have been developed for determining the carbon footprint of products. Some supermarket chains are also defining requirements for suppliers to provide data on the carbon footprint of their products.
New Zealand farms may be broadly divided into three categories: dairy, sheep/beef/deer and cropping (fruit, vegetable and arable). Mixed category farms such as cropping farms that grow fodder crops only for animal grazing in winter, or farms that are a mix of pastoral and arable cropping, also exist. On sheep/beef farms, the ratio of animals varies from all sheep to all cattle, and the management varies from breeding only through to finishing units. Pastoral farms can also have blocks with different sheep/beef ratios. Grazing of dairy replacements or winter grazing of dairy milking cows on sheep/beef farms is common practice, and sheep can graze around grape vines. Overseer allows for feed pads, wintering pads, barns and for the distribution of feed to these structures. Many pastoral farms also grow fodder or forage crops. Thus, for example, maize for ensilaging may be grown and the silage fed on paddocks, feed pads, or exported to another farm. In addition, inputs may be applied across multiple animal enterprises or products. Farm-scale inputs such as fuel and electricity apply to all enterprises on a farm. Nitrogen (N) fertiliser may be applied to a specific block, for example, one grazed by sheep and beef cattle, with associated products of wool, sheep meat and beef.
The model options are required to cater for the range of management practices found on New Zealand farms. This means a robust system is required to allocate the individual sources of GHGs (e.g. methane, nitrous oxide, direct carbon dioxide and embodied carbon dioxide emissions for inputs used on the farm) to each product and to cater for between-farm movements of a product. For example, supplements such as hay and silage may be made on one farm and used on another, or live-weight gain may occur over multiple farms (stratification) before slaughter.
The systems used in standard LCA analysis do not provide sufficient flexibility for use in Overseer. Williams et al. (Reference Williams, Audsley and Saunders2012) modelled stratification of the UK sheep industry for an LCA and Nguyen et al. (Reference Nguyen, Hermansen and Mogensen2012) similarly captured stratification for EU beef production LCA. Eady et al. (Reference Eady, Carre and Grant2012) modelled co-production at the farm level on cropping/sheep farms in Australia, but there are no general methods to model co-production on mixed pastoral systems. This paper describes the method developed to allocate farm GHG emissions on an area basis as in the original model (Wheeler et al., Reference Wheeler, Ledgard and DeKlein2008) as well as to farm products (functional unit basis), with a focus on co-production on New Zealand pastoral farms.
Methods
GHG emissions
GHG emissions were estimated for each source on the farm. Enteric methane emissions were determined using a metabolic intake model (Wheeler, Reference Wheeler2012a) to estimate dry matter intake (DMI) and New Zealand National GHG Inventory methane emission factors for enteric emissions (Ministry for the Environment, 2011). The DMI model is responsive to animal numbers, animal production and feed quality. Faecal methane emissions were determined from the amount of faecal dry matter (DM) and New Zealand National GHG Inventory methane emission factors (Ministry for the Environment, 2011). Direct nitrous oxide emissions from excreta were estimated from DMI, and site-specific data were used to estimate excreta N and emission factors (Wheeler, Reference Wheeler2012b). Indirect nitrous oxide emissions were estimated using site-specific data to estimate leaching and ammonia volatilisation and New Zealand National GHG Inventory emission factors. The on-farm direct carbon dioxide emissions from urea fertiliser and lime application were based on their composition (Intergovernmental Panel on Climate Change, 2006). Refrigerant emissions were based on LCA of refrigeration use in New Zealand dairy farms (M. Boyes, unpublished data).
Embodied emissions for inputs used on the farm were also included as detailed in a study by Wheeler (Reference Wheeler2012c). The source of the supplementary feeds brought onto farms is not always known when purchased. Therefore, the embodied emissions for supplementary feeds were based on the rate supplied by the user (in tonnes) and typical LCA-based emissions (kg CO2 equivalents per kg DM) for growing the feed, plus any manufacturing and transportation required to a central depot in New Zealand. Farm-specific information (e.g. transport, application methods) were used when available. A similar process was used for fertiliser. An LCA study on fertiliser manufacturing in New Zealand and overseas sourced material was used (Ledgard et al., Reference Ledgard, Boyes and Brentrup2011b). The model allows users to either enter specific energy-based data, or default electricity, fuel use and transport distances are used. National average emission factors for fuel and electricity were used. For other inputs, embodied emissions were estimated using an LCA approach on the basis of national average data, converted to a per animal, per stock unit or per hectare basis, after which the results were multiplied by the number of animals, stock units or area as appropriate to the farm.
Off-farm components were also included in the product footprint. Thus, for replacement animals grazed off-farm or winter grazing, the embodied GHG emissions for pasture grown and transport costs in both directions were included.
All emissions were converted to kg CO2 equivalents on a 100-year basis using a global warming potential factor of 25 for methane and 298 for nitrous oxide (Intergovernmental Panel on Climate Change, 2006). It should be noted that, at this stage, changes in soil or plant carbon stocks are not included in the model.
Basis of the allocation model
The objective of the allocation methodology was to use farm-specific data to determine the GHG emissions and allocate these to the required per ha and product footprint GHG reports. The model has two scales, namely, farm or block scale, to which inputs and outputs are aligned. Blocks are units of the farm with common site and management attributes, and may be pastoral (grazing animals), fodder crop, cut and carry, cropping, fruit crop, wetland, riparian, tree or house blocks. For pastoral systems, the allocation was achieved by determining the GHG emissions for each animal enterprise as an intermediate step.
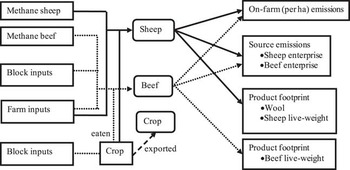
The model requires input information for each animal enterprise to derive feed and nutrient intake including pasture, supplements and crops fed to the animals. The animal enterprises on a block are also defined, and hence pasture intake by each animal enterprise on a block can be estimated. Feed produced on fodder crop, cut and carry, and cropping blocks and transferred to animals was also tracked on an animal enterprise basis. Thus, GHG emissions could be allocated to specific animal enterprises either directly (e.g. methane) or indirectly through the feeding regime (e.g. supplements), or block inputs allocated using block pasture intake (e.g. emissions from fertiliser) or the proportion of crop transferred (e.g. Ledgard et al., Reference Ledgard, McDevitt, Boyes, Lieffering and Kemp2009). This is shown schematically in Figure 1 for a sheep/beef farm.
Schematic flow pathways for determining greenhouse gas (GHG) emissions on a typical sheep/beef farm that included a fodder crop. The left hand side represents calculated GHG emissions (e.g. methane sheep) or inputs used to estimate GHG emissions, the boxes in the middle the enterprise estimated emissions and the right hand side the reported emissions. Note that only some options are shown.

Within farm systems, animals used for meat processing can be the output of a deliberate meat production system (live-weight gain system) or a by-product from another product stream (e.g. cull cows from a dairy system where the primary product is milk). In live-weight gain systems, the growth or live weight that was converted into meat is a result of a weaned animal (one not used for replacements) and a series of management units where live-weight gain occurs. Thus, the final live weight used for meat processing is the result of raising a calf to weaning, and then rearing it (live-weight gains) on one or more farms (Figure 2). Consequently, for a given farm, GHG emissions must be determined for a weaned animal if it was raised on the farm, and for any live-weight gain that occurred on that farm.
Flow pathway between farms of live-weight gain used in meat processing.

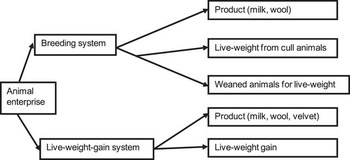
The model requests users to quantify female and male breeding stock, and their replacements, for each animal enterprise. The GHG emissions associated with each animal enterprise can thus be split into GHG emissions from breeding and finishing systems (Figure 3). Within a live-weight system, there can be two product streams, namely, non-meat products (e.g. wool, velvet or antler) and live-weight gain. A breeding system consists of mature animals producing offspring to weaning, or for producing milk (dairy system). Weaned non-replacement animals from a breeding herd are treated as trading animals. The breeding animals have three potential product streams: non-meat product (milk, wool, velvet), meat (cull animals) and animals used in the live-weight gain system. Farms may have breeding and live-weight gain systems; thus, a dairy system might typically only have a breeding system, whereas sheep and beef farms could have breeding and live-weight gain systems, although some intensive farms may have a live-weight gain system only.
Flow pathway for the allocation of greenhouse gas (GHG) emissions to products.

To achieve the allocation between breeding and finishing, an estimate was required for the fraction of emissions allocated to the non-meat products. For breeding systems, the remaining emissions were then allocated between animals raised for use in a finishing system (non-replacement animals) and live-weight sold (culled animals). Combining Figures 1 and 3 meant that any source of GHG emissions could be allocated to an animal enterprise, and then allocated to a product footprint, or an on-farm (per ha) emission rate.
Allocation to animal enterprise
Individual sources of emissions were distributed to each farm enterprise (dairy, sheep, beef, deer, dairy goats, supplements removed, horticultural and cropping), with the method depending on the source. Thus, emissions such as methane were calculated on an animal basis. Emissions from imported inputs used on a block basis, such as fertiliser, were distributed to each animal enterprise in proportion to the pasture DM consumed (Wheeler and Shepherd, Reference Wheeler and Shepherd2012). Animal types that were fed supplements are identified by the user. All other embodied emissions were directly associated with an animal enterprise, or are allocated based on land area.
Forage crops fed to animals on-farm are defined by the user. The allocation was less clear for some autumn sown grain crops that are grazed and subsequently harvested for grain, or for fruit crops with animals grazing underneath. The former was based on the proportion of total above-ground yield consumed by the animals, and the latter was based on estimated GHG emissions for growing pasture from an LCA analysis (unpublished data), which were then removed from the fruit crop GHG emissions.
Emissions for each animal enterprise were divided into breeding and live-weight gain (Figure 1) on the basis of total metabolic energy requirements (Wheeler, Reference Wheeler2012a) of the animals in each system. Emissions for each management system were then partitioned to non-meat products (Figure 3), and for breeding systems the remaining GHG emissions were split between those required to raise animals and those for culled animals.
Product allocation
LCA standards recommend that emissions are allocated to products using a hierarchy of system expansion, biophysical allocation or economic allocation (ISO, 14044). System expansion was not applicable to a farm system model such as Overseer as the information to expand the system boundaries was not available at the farm scale.
For dairy animals, the proportion allocated to product (pproduct) may be entered by the user, or a default used, which is based on biophysical allocation (International Dairy Federation, 2010). The default was estimated as
 $$pproduct\,{\rm{ = }}\,{\rm{1 - 5}}{\rm{.7717}}\,\times \,R$$
where R is the ratio of live weight of all animals sold (calves, culled cows) and fat protein-corrected milk (FPCM), where
 $$ {FPCM\,{\rm{ = }}&\,milkyield\times {\rm{0}}{\rm{.1226}} \times fat\% \:{\rm{ + }}\:{\rm{0}}{\rm{.0776}}\:\cr &\times true\_protein\% \:{\rm{ + }}\:{\rm{0}}{\rm{.2534}}$$
where milkyield is in kg milk, and fat% and true_protein% are the fat and protein contents of the milk, respectively.
For beef cattle, the proportion allocated to product (pproduct) was zero because there were no co-products produced inside the farm gate. Hence, GHG emissions for beef are allocated to calves that are weaned and live-weight gain, as outlined in the section ‘Basis of allocation model’. For other animal types, the proportion allocated to the main product outputs was based on economic allocation, as there was no biophysical method available. Using a price-based allocation implies that the allocation may change over time if the relative prices of products change. On the basis of international guidelines, a 5- to 10-year average was used to exclude annual fluctuations.
For sheep, the proportion allocated to product was defined as the income from wool divided by the total income from sheep (wool and animals sold). This can be entered by the user, or a default economic allocation calculated using 10-year average data. The default economic allocation included the difference in price between mutton and lamb as the model already differentiates between live-weight gain from sheep <1 year (lambs) and > 1 year (mutton). The proportion of gross revenue for sheep derived from wool averaged 0.17 on intensive farms (predominantly finishing systems), 0.22 on mixed breeding/finishing farms, 0.29 on South Island hill country (predominately breeding operations) and 0.59 on South Island high country (merino wethers for wool production; Ministry of Agriculture and Forestry, 2009). This suggested that the product allocation can differ between breeding and trading systems, and hence was estimated separately.
For deer, the co-products (antler or velvet) are only produced by male animals. Hence, deer enterprise emissions were split into male and female emissions on the basis of the metabolic energy requirements. For female deer, product allocation was zero as there are no co-products, and therefore GHG emissions for female deer are ascribed to fawns that are weaned and live-weight gain. For male deer, if antler or velvet was removed, the user can enter a product allocation or a default economic allocation was estimated as
 $${pproduct\,{\rm{ = }}&\,income\_velvet\,/\,\cr &(income\_velvet\, + \,income\_lwg)$$
where income_velvet was based on an average price over 5 years of $NZ70/kg, and velvet and antler (kg sold) were provided by the user and income_lwg was based on an average price of $NZ4.50/kg live weight and the estimated live-weight gain from male animals sold.
Reared animal allocation
Reared animal allocation is the ratio of non-product breeding emissions that were allocated to animals raised for a live-weight gain system, that is, the non-replacement animals at weaning (Figure 2). The remainder was allocated to meat from animals sold from the breeding system (culls). The allocation was based on live-weight gain (lwg), with a similar approach used for each animal enterprise. Thus,
 $$\scale95%{panimal\,{\rm{ = }}\,lwg\_weaned/(lwg\_weaned\,{\rm{ + }}\,lwg\_culled)$$
where lwg_weaned is the weight of animals weaned, and lwg_culled is the weight of mature animals culled. These were estimated as
 $${ lwg\_weaned\,{\rm{ = }}&\,n\_breeding\,\times \,weanweight\cr &\,\times \,(1{\rm{ - }}replacement\_rate)$$
 $${ lwg\_culled\,{\rm{ = }}&\,n\_breeding\,\times \,matureweight\cr &\,\times \,replacement\_rate $$
where n_breeding is the number of breeding animals, weanweight is the weaning weight (kg/animal), mature weight is the weight of a mature animal (kg/animal) and replacement_rate is the proportion of breeding animals replaced (culled) each year. It was assumed that live-weight gain is a measure of the biophysical requirements to achieve that live weight. This could be further refined by including a factor to take into account the composition of the live-weight gain.
Model outputs
GHG emissions for breeding systems were allocated to product (milk, meat, wool velvet or antler), and animals that were raised to weaning and live-weight gain as
 $${ C{{O}_{\rm{2}}}eProductBreed\,{\rm{ = }}& \,C{{O}_{\rm{2}}}eBreedEmission\,\cr &\times \,pproduct$$
 $${ C{{O}_{\rm{2}}}eAnimalBreed\,{\rm{ = }}&\,C{{O}_{\rm{2}}}eBreedEmission\cr &\,\times \,({\rm{1 - }}pproduct)\,\times \,panimal$$
 $${ C{{O}_{\rm{2}}}eLwgtBreed\,{\rm{ = }}&\,C{{O}_{\rm{2}}}eBreedEmission\cr &\,\times \,({\rm{1 - }}pproduct)\cr &\,\times \,({\rm{1 - }}panimal) $$
where CO 2eBreedEmission is the total emissions allocated to a breeding system for a given animal enterprise, and pproduct (product allocation) and panimal (reared animal allocation) were defined previously. GHG emissions for live-weight gain systems were allocated to product and live-weight gain as
 $${ C{{O}_{\rm{2}}}eProductLwg\,{\rm{ = }}& \,C{{O}_{\rm{2}}}eLwgEmission\cr &\times pproductLwg$$
 $$\scale97%{{C{{O}_{\rm{2}}}eLwg\,{\rm{ = }}\,C{{O}_{\rm{2}}}eLwgEmission\times ({\rm{1 - }}pproductLwg) $$
where CO 2eLwgEmission is the total emission allocated to a live-weight gain system for a given animal enterprise, and pproductLwg is the allocation to a product for a live-weight gain system. The reported product footprint for each animal enterprise (kg CO2 equivalents/kg product) was then estimated as
 $$ {C{{O}_{\rm{2}}}eProduct\,{\rm{ = }}&\,(C{{O}_{\rm{2}}}eProductBreed\cr &\,{\rm{ + }}\,C{{O}_{\rm{2}}}eProductLwg)/kg\,product$$
where product is the weight of either milk solids, wool, velvet or antler sold off-farm and CO 2eProductLwg is zero for milk. The GHG emissions for raising an animal to weaning (kg CO2 equivalents/animal) were estimated as
 $$\scale95%{C{{O}_{\rm{2}}}eAnimalRaise\,{\rm{ = }}\,C{{O}_{\rm{2}}}eAnimalBreed/number\_lwg$$
where number_lwg is the number of animals from the breeding system that end up as animals in a live-weight gain system either on- or off-farm, and is estimated as
 $$ {number\_lwg\,{\rm{ = }}&\,n\_breeding\times birth\_rate\cr &\times ({\rm{1 - }}replacement\_rate)$$
where n_breeding is the number of mature breeding animals, birth_rate is the lambing, calving or fawning rate and replacement_rate is the proportion of breeding animals that were replaced each year. The estimated GHG emissions for live-weight gain (kg CO2 equivalents per kg live-weight gain per year) were estimated separately for the breeding and trading systems as
 $$\displaylines{ & C{{O}_{\rm{2}}}eLWGBreed\,{\rm{ = }}\,C{{O}_{\rm{2}}}eLwgtBreed\,/\,lwg\_Breed \cr & C{{O}_{\rm{2}}}eLWG\,{\rm{ = }}\,C{{O}_{\rm{2}}}eLwg\,/\,lwg\_lwg $$
where lwg_Breed is the live-weight gain (kg/year) associated with breeding animals, including replacements and lwg_lwg is the live-weight gain of animals in the live-weight-gain management system.
Live-weight sold
The total emissions for live-weight sold for meat processing (the source of the meat product) for a trading system is the sum of the emissions to produce a young animal to weaning, and of live-weight gain emissions associated with live-weight reared on one or more farms. Thus:
 $${eC{{O}_{\rm{2}}}liveweightformeat\,{\rm{ = }}\,totalC{{O}_{\rm{2}}}e/lwtslaughter$$
where lwtslaughter is the live weight at slaughter (kg/animal), and totalCO2e (kg CO2 equivalents) was estimated as
 $$\scale95%{totalC{{O}_{\rm{2}}}e\,{\rm{ = }}\,C{{O}_{\rm{2}}}eAnimalRaise\,{\rm{ + }}\,\rSigma {\rm{(}}C{{O}_{\rm{2}}}eLWG\times lwg{\rm{)}}$$
where CO2eAnimalRaise is the emissions for a young animal raised to weaning from the breeding mob on the farm or a default value (kg CO2 equivalents/animal), CO2eLWG is the emissions for a gain in live weight on a given farm (kg CO2 equivalents /kg live-weight change) and lwg is the change in live weight on a given farm (kg/animal).
On-farm GHG emissions
The on-farm (per hectare) GHG emissions were the emissions associated with an activity on that farm. It is essentially the sum of the emissions from each source divided by total farm area, except:
• Embodied emissions for DM production associated with wintering or grazing replacements off-farm were not included as these occurred on another farm.
• Transport costs for wintering and grazing off-farm were in one direction (to the farm) to ensure that there was no double accounting between farms.
• Supplements removed were given the same emissions factors as supplements brought in of the same type.
These rules allow emissions from a series of farms to be added together if required.
Discussion
This paper reports a methodology for allocating emissions on both an area basis and per product basis when co-production occurs on New Zealand pastoral farms. When there is only a single product stream, the procedure is similar to those used in New Zealand LCA studies, for example, for dairy milk production on dairy-only farms. This is not surprising, given that the model for estimating the range of source emissions was based on these LCA analyses. However, the difference occurs when there are multiple products and systems on a farm.
Variation in allocation was investigated in a random selection of farm files. For a dairy enterprise, the percentage of GHG emissions allocated to product varied from 75% to 85% between farms. This reflected variations in inputs such as milk production, replacement rates, breeds, and milk protein and fat contents between farms. In comparison, using the typical product allocation in the guide for LCA of NZ-produced milk (International Dairy Federation, 2010) gave 85.6% of dairy GHG emissions allocated to milk, 2.9% to animals for live-weight gain and 11.5% to cull live weight. In a beef breeding system, typically 40% to 50% of GHG emissions were allocated to animals reared to weaning for use in a live-weight gain system and 50% to 60% to live-weight gain for culled animals. The percentage allocation to animals reared to weaning decreased as the proportion of trading animals (animals brought and sold for fattening) increased.
Overseer files of farms based on New Zealand monitor farm data (Ministry of Agriculture and Forestry, 2009) were generated. These farms are ‘typical’ farm for a range of basic farm types for which production and financial data are collected regularly. An analysis indicated that on average, 63%, 69% and 77% of total GHG emissions to the farm gate were from methane for dairy, North Island sheep and beef farms, and South Island sheep and beef farms, respectively. Corresponding nitrous oxide emissions were 22%, 27% and 16%, respectively, of total emissions. Emission rates varied considerably between farms. For example, methane emissions were, on average, 660 kg CO2 equivalents per hectare on dairy farms, and ranged from 200 to 2500 kg CO2 equivalents per hectare on sheep and beef farms. This was largely a reflection of the total feed intake by animals. In contrast, nitrous oxide emissions ranged from 100 to 3500 kg CO2 equivalents per hectare and varied because of the total feed intake by animals, as well as the farm block characteristics such as soil type, rainfall and irrigation (affecting degree of drainage) and N-fertiliser applications.
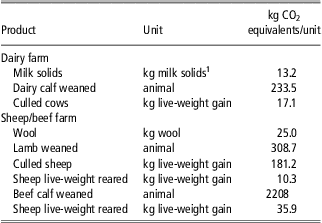
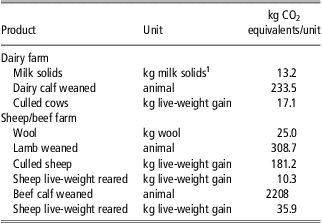
The model generated product carbon footprints (per kg product) that were consistent with values from previous LCA studies (Ledgard et al., 2008, Reference Ledgard, McDevitt, Boyes, Lieffering and Kemp2009 and Reference Ledgard, Lieffering, Coup and O'Brien2011a; Flysjö et al., Reference Flysjö, Henriksson, Cederberg, Ledgard and Englund2011; Lieffering et al., 2010b), but varied as expected depending on the production and management system used, and site characteristics. Typical values for outputs from a typical New Zealand dairy and sheep and beef farms are shown in Table 1.
Examples of product carbon footprint outputs for a typical New Zealand dairy and traditional sheep/beef farm
1milk solids = fat + protein.
The total embodied emissions for a weaned animal used for live-weight gain varied between farms. Thus, a calf reared until weaning from a dairy farm had lower GHG emissions than a calf from a beef system (Table 1) because it was a by-product of the milking system. Using the emissions for a weaned animal from Table 1, assuming emission efficiency for live-weight gain from weaning to slaughter of 10 kg CO2e/kg live-weight gain and a sale weight of 300 kg, then the average emissions per kg live weight sold for slaughter are 9.1 and 14.7 kg CO2e/kg live-weight for a dairy beef system and breeding beef (suckling) system, respectively. The ratio of these results is consistent with the results by Nguyen et al. (Reference Nguyen, Hermansen and Mogensen2012) for Europe.
Currently, most New Zealand dairy farmers require a nutrient budget as a condition of milk supply. By default, these farms also have GHG emissions reports. Gac et al. (Reference Gac, Ledgard, Lorinquer, Boyes and Le Gall2012) noted the need for common methods to be used for inter-county comparisons, and comparisons between farms should also use common methods that this model provides. As GHG and energy-related emissions are closely aligned, the same principles are also used to develop an energy report, but this is not covered in this paper.
Conclusions
The GHG module within Overseer calculates GHG emissions using farm-specific data. It was updated so that GHG emissions may be estimated at a minimum with no additional inputs to the model than those for the estimation of nutrient flows, and using various default values. Alternatively, the user can input key farm-specific information such as fuel and electricity use, transport distances and fertiliser application methods. These emissions are then allocated between the different co-products so that a product carbon footprint (cradle-to-farm-gate), on the basis of LCA principles, can be produced.
The model generates product carbon footprints that are consistent with average values from LCA analysis but are farm specific. Thus, different farm systems may be compared for their efficiency in terms of GHG emissions for producing products to the farm gate. When comparing these results with full LCA analyses, it should be noted that the model provides product carbon footprint estimates to the farm-gate stage, whereas LCA analyses usually aim to cover the whole life cycle, and thus may include emissions due to manufacturing, transport to market, consumption and disposal of waste material.
This paper indicates that it is possible to allocate GHG emissions to co-products from mixed farming systems, and provides an initial framework for undertaking this analysis. This module meets the current requirements for New Zealand farms but will need to evolve as farm systems and methodologies change. An example of the latter would be that the economic allocation between wool and meat could be replaced with a biophysical allocation method. The updated GHG module was included in the current release of Overseer.
Acknowledgements
Funding for this work was provided by the Ministry for Primary Industries and the Fertiliser Association of New Zealand through the Overseer development project (Contract number MAF POL 0910 11316), and is gratefully acknowledged.
This paper was published as part of a supplement to animal, publication of which was supported by the Greenhouse Gases & Animal Agriculture Conference 2013. The papers included in this supplement were invited by the Guest Editors and have undergone the standard journal formal review process. They may be cited. The Guest Editors appointed to this supplement are R. J. Dewhurst, D. R. Chadwick, E. Charmley, N. M. Holden, D. A. Kenny, G. Lanigan, D. Moran, C. J. Newbold, P. O'Kiely, and T. Yan. The Guest Editors declare no conflict of interest.