





Four years into the full-scale Russian invasion, Ukraine’s healthcare workforce has endured levels of strain unprecedented in Europe in recent decades. More than 2800 attacks on health facilities have killed at least 224 healthcare workers and injured more than 900, 1 while thousands more continue to work under chronic threat. Even conservative estimates indicate that 3% of doctors had left the country by mid-2024. 2 Yet despite this sustained pressure, the scale and determinants of the mental health burden of doctors and nurses remain largely unknown. To date, the only available estimates come from a small study conducted in 2024, which reported a prevalence of anxiety and depressive disorders of approximately 10% among healthcare workers, based on a sample largely composed of paramedics and doctors working in emergency departments. Reference Rzońca, Podgórski, Łazarewicz, Gałązkowski, Rzońca and Detsyk3 These estimates are broadly in line with reports from 2023 and 2025 in the general population in Ukraine, Reference Martsenkovskyi, Shevlin, Ben-Ezra, Bondjers, Fox and Karatzias4 but remain lower than estimates reported among healthcare workers globally. Reference Maqbali, Alsayed, Hughes, Hacker and Dickens5
To address this evidence gap, the World Health Organization (WHO) Regional Office for Europe, within a European Commission-funded initiative in Eastern Europe, conducted a nationwide assessment of mental health among doctors and nurses in Ukraine. The study was designed to provide robust estimates of depression, anxiety and suicidal ideation, and to examine modifiable factors operating at individual, occupational and organisational levels in the context of ongoing war. The work is situated within the WHO European Frameworks for Action on the Health and Care Workforce Reference Azzopardi-Muscat, Zapata and Kluge6 and on Mental Health, 7 and aligns with national initiatives, including the All-Ukrainian Mental Health Programme commissioned by the First Lady of Ukraine. Using data collected in mid-2025, we aim to generate evidence to inform workforce policy, service planning and mental health support strategies.
Method
Study design and participants
We conducted a cross-sectional study using an online survey composed of validated self-report instruments. The study protocol was preregistered in Open Science Framework on 13 May 2025, before data collection began. No target sample size was specified because the aims were mainly exploratory – four confirmatory hypotheses on working conditions and mental health were defined for all participating countries, but none were tailored to the Ukrainian context. Recruitment ran from 20 May to 15 September 2025. Initially planned for 3 months, data collection was extended by 3 weeks to offset reduced responses during the summer break. This report follows the Strengthening the Reporting of Observational Studies in Epidemiology guidelines (see Supplementary Appendix 1). All procedures contributing to this work comply with the ethical standards of the relevant national and institutional committees in human experimentation and with the Helsinki Declaration of 1975, as revised in 2013. The Ethics Committee at the Universidad Autónoma de Madrid (Spain) approved the study (identifier: CEI-141-3158/2). Because the study was observational and did not collect personal data, the requirement for informed consent was waived by the committee.
The survey was completely anonymous and open to all doctors and nurses in Ukraine. The recruitment strategy was as follows. The WHO Regional Office for Europe and the WHO Country Office in Ukraine supervised dissemination of the survey. The Ministry of Health of Ukraine disseminated the survey through two official channels: (a) the 24 oblast health departments and (b) the National Health Service of Ukraine, which distributed the survey to healthcare facilities and medical staff nationwide according to established communication protocols. In addition, the Ministry of Health collaborated with professional associations of physicians and nurses, as well as healthcare worker leaders, to distribute the survey through their networks. Information about the study was also published on the official communication platforms of the Ministry of Health.
This recruitment strategy was as structured as possible, given the extraordinary circumstances surrounding healthcare delivery in Ukraine. However, it was not possible to determine precisely to whom the invitation was sent or who received it; therefore, response and cooperation rates are not reported. Moreover, we could not detect whether individuals outside the target population (i.e. doctors and nurses) completed the survey, nor could we identify duplicate responses. To describe survey coverage, we used official records from the Ministry of Health. According to the Ukrainian Public Health Centre, there were 155 725 doctors and 243 664 nurses in the country in 2024. 8 These data are not disaggregated by gender. To estimate the number of professionals by gender, we used the proportions reported in the 2024 health labour market analysis published by the WHO Regional Office for Europe. 9
Procedures
We used an ad hoc online questionnaire that could be completed on different devices (mobile telephones, tablets, computers). Participants selected their preferred language (English, Armenian, Georgian, Romanian or Ukrainian) and were informed that completion would take approximately 10 min. The questionnaire included 76 items, most drawn from validated instruments or large European surveys, such as the Third European Survey of Enterprises on New and Emerging Risks (2019) and the European Working Conditions Survey (2015) – the same questionnaire was used in the European Union, Iceland and Norway, in the Mental Health of Nurses and Doctors study. 10,Reference Muscat, Lazëri, Zapata and Kluge11
For this analysis, we used items on workplace violence and other risk and protective factors as exposures, and depression, anxiety and suicidal thoughts as mental health outcomes. We also included the following sociodemographic characteristics: age, gender, relationship status and having children in the household. The survey was piloted among local doctors and nurses before large-scale distribution. The full instrument is available on the Open Science Framework. Reference Arrona Gómez, Mediavilla, Redlich, Langins, Lazeri and Zapata12
The exposures of interest were grouped into risk and protective factors. Items covering risk factors were taken from the Second Version of the Copenhagen Psychosocial Questionnaire (COPSOQ-II), a self-report on job strain that has been validated in several languages. Reference Pejtersen, Kristensen, Borg and Bjorner13 These items included bullying, sexual harassment, violent threats and physical violence. Original responses for these items were Likert frequency scales, from ‘no’ to ‘yes, daily’. Items covering protective factors at the interpersonal level (i.e. social support) were also taken from the COPSOQ-II, with responses ranging from ‘never’ to ‘always’. Individual-level protective factors included meaning and purpose, as measured by the Work and Meaning Inventory. Reference Steger, Dik and Duffy14 Scores ranged from 0 to 4, with higher scores indicating better agreement with statements. Exact item wording, response levels and transformations are shown in Supplementary Appendix 2.
Outcomes
The main outcomes of interest were probable depression, probable anxiety and presence of passive suicidal thoughts, as measured by self-reported screening tools the Patient Health Questionnaire-9 (PHQ-9) and the Generalised Anxiety Disorder-7 (GAD-7) questionnaire. The PHQ-9 Reference Kroenke, Spitzer and Williams15 is a self-report questionnaire developed to assess the severity of depression symptoms in individuals. It comprises nine items, each corresponding to the nine diagnostic criteria for major depressive disorder as outlined in the DSM-5. Participants are asked to rate the frequency of experiencing each symptom over the previous 2 weeks, which are scored on a four-point Likert scale (0–3). Recent studies employing the Ukrainian version of the PHQ-9 have reported very good internal reliability (α = 0.90), test–retest reliability (intraclass correlation coefficient 0.84) and good construct validity. Reference Hyland, Vallières, Shevlin, Karatzias, Ben-Ezra and McElroy16,Reference Roberts, Makhashvili, Javakhishvili, Karachevskyy, Kharchenko and Shpiker17 A cut-off score of 10 was used to detect major depressive disorder in this study.
The GAD-7 includes seven items covering the occurrence of different symptoms of various anxiety disorders in the past 2 weeks. Reference Spitzer, Kroenke, Williams and Löwe18 It uses the same response options as the PHQ-9, with higher scores indicating more anxiety symptoms. The threshold used to detect the manifestation of pathological symptomatology in this study was ten points. Psychometric analysis of the Ukrainian version of the GAD-7 have demonstrated excellent internal consistency and discriminant validity of the items, as well as retest reliability and the construct and criterion validity of the scale. Reference Aleksina, Gerasimenko, Lavrynenko and Savchenko19 The factor structure of the methodology corresponds to the original univariate model. Cronbach’s α-values in our sample were 0.89 and 0.92 for the PHQ-9 and GAD-7 sum scores, respectively.
To measure suicidal thoughts, we used the ninth item of the PHQ-9 (‘Over the last two weeks, how often have you been bothered by thoughts that you would be better off dead or of hurting yourself in some way?’). This single item is associated with increased risk of suicide attempt over 1- and 2-year periods. Reference Rossom, Coleman, Ahmedani, Beck, Johnson and Oliver20,Reference Simon, Rutter, Peterson, Oliver, Whiteside and Operskalski21 Following recommendations from these studies, responses of ‘not at all’ were coded as 0, and any positive response (1, 2 or 3) was coded as 1.
We defined the potential confounding variables for each model based on prior causal knowledge, as specified in our protocol. We used directed acyclic graphs to draw the causal relationships between exposures, outcomes and potential confounding variables. Gender, age group, healthcare setting and proximity to combat areas and occupied territories were included in all adjusted models. Additional potentially confounding variables were included for some exposures. Specifications for each model are reported next to each estimate.
Statistical analysis
The aims were to estimate the prevalence of mental health problems and risk and protective factors, and to analyse their associations by using regression models adjusted for confounding. Prevalence and association estimates were stratified by profession and gender, and additionally by region where appropriate. Given the non-probabilistic nature of the sample, prevalence estimates should be interpreted as observed proportions among survey participants rather than as population-representative prevalence.
Main analyses
We estimated the prevalence of mental health outcomes by calculating the proportion of respondents scoring above established cut-off values for depression, anxiety and suicidal thoughts (see Supplementary Appendix 2). Exposure variables were operationalised by dichotomising the relevant questionnaire items (see Supplementary Appendix 2). Proportions were reported together with 95% confidence intervals.
Associations between exposures and mental health outcomes were examined by using multilevel Poisson regression models with a log link to obtain prevalence ratios; absolute prevalences are presented alongside relative estimates to facilitate interpretation. Models were fitted separately for each exposure–outcome combination. All models included a random intercept for region to account for geographical clustering of participants and to estimate within-region associations. Crude models included no covariates. Two sets of adjusted models were fitted: partially adjusted models, including age group, gender and presence of occupying troops; and fully adjusted models, including additional covariates selected a priori for each specific exposure–outcome combination. All association estimates were reported stratified by profession and gender.
Given the non-probabilistic sampling strategy and the limited availability of auxiliary population data (restricted to gender and profession), unweighted prevalence and association estimates were specified as the primary analytical approach. Adjustment for confounding was performed directly within regression models. Confidence intervals were based on model-based standard errors from the multilevel models.
As a robustness check, we compared these standard errors with those obtained from alternative models including region as a fixed effect. Because standard errors from the multilevel models were consistently larger, all main results are reported using the more conservative multilevel estimates.
Sensitivity analyses
We conducted three sensitivity analyses to assess the robustness of prevalence estimates and association results. First, we obtained calibrated prevalence and association estimates by using post-stratification weights based on gender and profession to evaluate the sensitivity of findings to differences in sample composition. These calibrated estimates were used for robustness assessment, but do not fully correct for non-probability sampling or residual selection bias. These models replicated the main models without random intercepts for region, because of the limited granularity and insufficient information within strata. Second, Bayesian hierarchical regression models were fitted to examine exposure–outcome associations, allowing for partial pooling across regions. Details are provided in Supplementary Appendix 3. Third, dose–response relationships were assessed by modelling exposures as ordinal variables and mental health outcomes as continuous scores, using fully adjusted linear regression models.
Missing data and software
Observations with missing information on profession or mental health outcomes, as well as those with more than 90% of questionnaire items missing, were excluded. Four in five participants completed more than 90% of the survey, and 80% completed it in full (see Supplementary Appendix 4). Complete-case analyses were performed; missing data were not imputed. All analyses were conducted with R version 4.5.2 (R Foundation for Statistical Computing, Vienna, Austria; https://www.R-project.org/) and RStudio version 2025.09 (RStudio, Inc., Boston, Massachusetts, USA; http://www.rstudio.com/).
Results
Between 20 May and 15 September 2025, we collected 23 737 valid responses: 10 158 from doctors and 13 579 from nurses. These figures represent 6 and 5% of all doctors and nurses in the country, respectively, according to data from the Ukrainian Ministry of Health and the WHO. The regions with the highest numbers of responses were Dnipropetrovsk Oblast (n = 2997) and Lviv Oblast (n = 2807), whereas the lowest numbers were recorded in Luhansk Oblast (n = 22) and Crimea (n = 0) (Supplementary Appendix 5). Most participants were women aged 31–45 years, and 10% were undertaking postgraduate training. A third worked in hospital settings, a third worked in primary care and the remainder were distributed across other settings. Sociodemographic characteristics are presented in Table 1.
Sociodemographic characteristics and workplace-related variables, by profession and gender

Table 1 Long description
A table comparing sociodemographic characteristics and workplace-related variables by profession and gender. The table has 10 rows and 8 columns. Column headers are: Characteristic, Doctor Male, Doctor Female, Doctor Overall, Nurse Male, Nurse Female, Nurse Overall. Row labels include Age groups, Relationship status, Having children in the household, Postgraduate training, Length of service, Healthcare setting, Proximity to combat areas and occupied territories. Each row provides percentages and counts for each category. Superscript 1 indicates the number of respondents in each category.
Conflict zones are defined by proximity to combat areas and occupied territories.
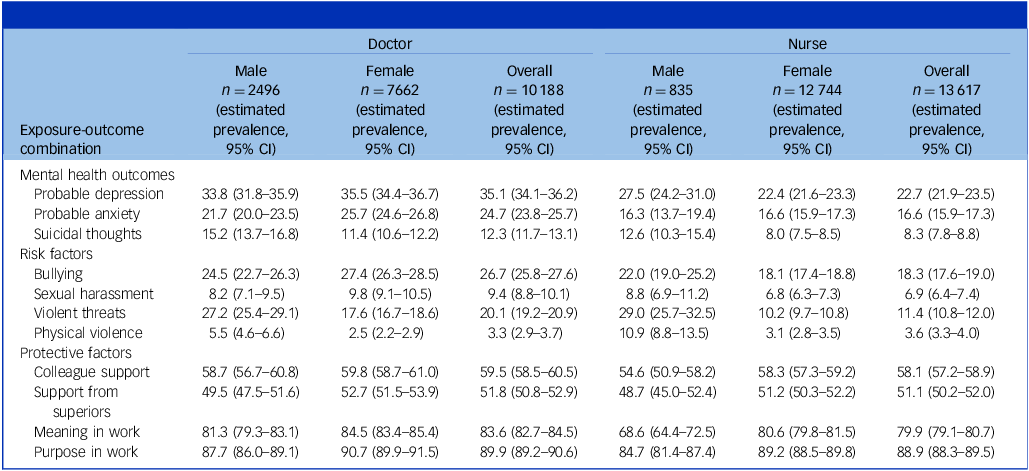
Prevalence of mental health outcomes, risk and protective factors are shown in Table 2. Overall, one in three doctors and one in four nurses reported symptoms compatible with major depressive disorder; one in four doctors and one in six nurses reported symptoms of anxiety disorders and approximately one in ten doctors and nurses reported suicidal thoughts. Prevalence was higher among doctors than nurses, and was similar regardless of proximity to combat areas or occupied territories. Observed prevalences across mental health outcomes were very similar to those calibrated by profession and gender (Supplementary Appendix 6). A detailed description of mental health problems by sociodemographic and clinical characteristics is provided in Supplementary Appendix 6. The most prevalent risk factor in the sample was bullying, reported by one in four doctors and nearly one in five nurses. By contrast, more than half of respondents reported feeling supported by colleagues and/or immediate superiors, and over 80% reported finding meaning and purpose in their work. Observed prevalences across risk and protective factors were very similar to those calibrated by profession and gender (Supplementary Appendix 7). A detailed description of risk and protective factors by sociodemographic and clinical characteristics is provided in Supplementary Appendix 7.
Prevalence of mental health outcomes, by profession and gender

Table 2 Long description
A table comparing mental health outcomes and risk factors among doctors and nurses by gender. The table has 13 rows and 10 columns. Columns are labeled: Doctor Male, Doctor Female, Doctor Overall, Nurse Male, Nurse Female, Nurse Overall. Rows are labeled: Probable depression, Probable anxiety, Suicidal thoughts, Risk factors, Bullying, Sexual harassment, Violent threats, Physical violence, Protective factors, Colleague support, Support from superiors, Meaning in work, Protective in work. Row 1: Doctor Male, 33.8 percent (31.8-35.9); Doctor Female, 35.5 percent (34.4-36.7); Doctor Overall, 35.1 percent (34.1-36.2); Nurse Male, 27.5 percent (24.2-31.0); Nurse Female, 22.4 percent (21.6-23.3); Nurse Overall, 22.7 percent (21.9-23.5). Row 2: Doctor Male, 23.7 percent (22.0-25.3); Doctor Female, 25.7 percent (24.6-26.8); Doctor Overall, 24.7 percent (23.9-25.7); Nurse Male, 16.3 percent (13.7-19.4); Nurse Female, 16.6 percent (15.9-17.3); Nurse Overall, 16.6 percent (15.9-17.3). Row 3: Doctor Male, 11.4 percent (10.3-12.6); Doctor Female, 11.4 percent (10.6-12.2); Doctor Overall, 11.4 percent (10.7-12.1); Nurse Male, 12.6 percent (10.3-15.4); Nurse Female, 8.6 percent (7.5-8.5); Nurse Overall, 8.3 percent (7.8-8.8). Row 4: Doctor Male, 26.7 percent (25.2-28.2); Doctor Female, 27.4 percent (26.3-28.5); Doctor Overall, 27.0 percent (26.1-28.0); Nurse Male, 22.0 percent (19.0-25.2); Nurse Female, 18.1 percent (17.4-18.8); Nurse Overall, 18.3 percent (17.6-19.0). Row 5: Doctor Male, 8.2 percent (7.1-9.5); Doctor Female, 9.8 percent (9.1-10.5); Doctor Overall, 9.4 percent (8.8-10.1); Nurse Male, 8.8 percent (6.5-11.2); Nurse Female, 6.8 percent (6.3-7.3); Nurse Overall, 6.9 percent (6.4-7.4). Row 6: Doctor Male, 27.2 percent (25.4-29.1); Doctor Female, 17.6 percent (16.7-18.6); Doctor Overall, 20.1 percent (19.2-20.9); Nurse Male, 29.0 percent (25.7-32.5); Nurse Female, 10.2 percent (9.7-10.8); Nurse Overall, 11.4 percent (10.8-12.0). Row 7: Doctor Male, 5.5 percent (4.6-6.6); Doctor Female, 2.5 percent (2.2-2.9); Doctor Overall, 3.3 percent (2.9-3.7); Nurse Male, 10.9 percent (8.8-13.5); Nurse Female, 3.1 percent (2.8-3.5); Nurse Overall, 3.6 percent (3.3-4.0). Row 8: Doctor Male, 58.7 percent (56.7-60.8); Doctor Female, 59.8 percent (58.7-61.0); Doctor Overall, 59.5 percent (58.5-60.5); Nurse Male, 54.6 percent (50.9-58.2); Nurse Female, 58.3 percent (57.3-59.2); Nurse Overall, 58.1 percent (57.2-58.9). Row 9: Doctor Male, 49.5 percent (47.5-51.6); Doctor Female, 52.7 percent (51.5-53.9); Doctor Overall, 51.8 percent (50.8-52.9); Nurse Male, 48.7 percent (45.0-52.4); Nurse Female, 51.2 percent (50.3-52.2); Nurse Overall, 51.1 percent (50.2-52.0). Row 10: Doctor Male, 81.3 percent (79.3-83.1); Doctor Female, 84.5 percent (83.4-85.4); Doctor Overall, 83.6 percent (82.7-84.5); Nurse Male, 68.6 percent (64.4-72.5); Nurse Female, 80.6 percent (79.8-81.5); Nurse Overall, 79.9 percent (79.1-80.7). Row 11: Doctor Male, 87.7 percent (86.0-89.1); Doctor Female, 90.7 percent (89.9-91.5); Doctor Overall, 89.9 percent (89.2-90.6); Nurse Male, 84.7 percent (81.4-87.4); Nurse Female, 89.2 percent (88.5-89.8); Nurse Overall, 88.9 percent (88.3-89.5).
Cut-off scores ≥10 used to detect probable depression (PHQ-9) and probable anxiety disorders (GAD-7); responses other than zero to PHQ-9 item 9 were used to detect suicidal thoughts. PHQ-9, Patient Health Questionnaire-9; GAD-7, Generalised Anxiety Disorder-7 questionnaire.
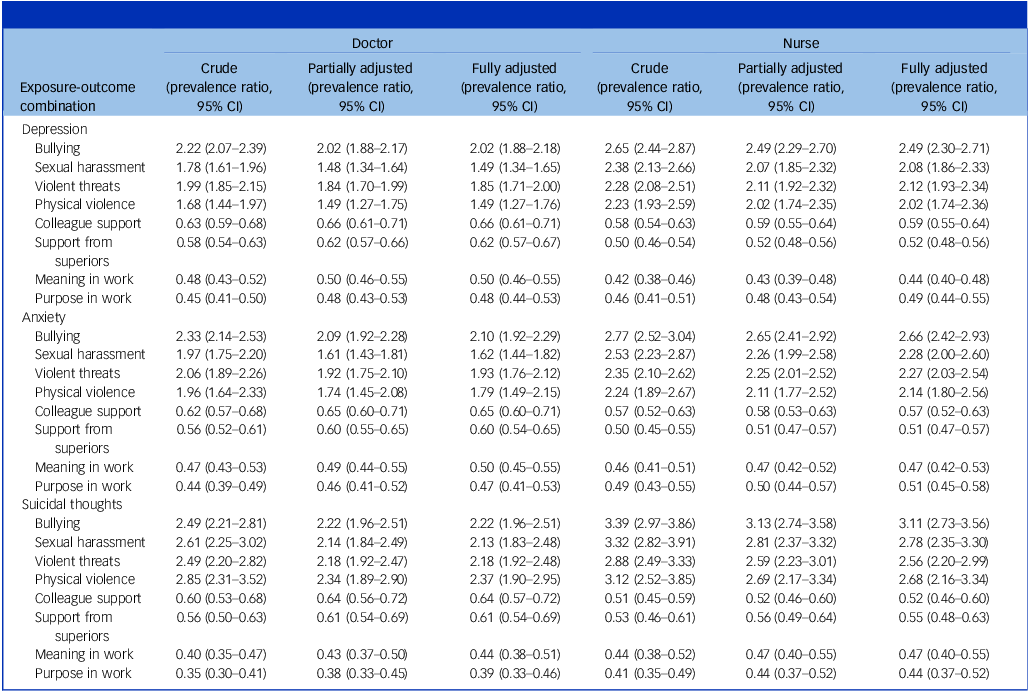
All workplace exposures were associated with higher observed prevalences of depression, anxiety and suicidal thoughts. Among nurses exposed to bullying, the prevalence of depression was 45% compared with 18% among those unexposed (prevalence difference 27 percentage points), the prevalence of anxiety was 34 v. 13% (21 percentage points) and the prevalence of suicidal thoughts was 18 v. 6% (12 percentage points). Corresponding differences among doctors were similar in direction but smaller in magnitude (see Supplementary Appendix 8). Relative differences mirrored these results (see Table 3). Prevalence ratios were robust across model specifications, with crude, partially adjusted and fully adjusted estimates showing minimal attenuation, and were consistent in sensitivity analyses incorporating post-stratification calibration by profession and gender (Supplementary Appendix 8), and alternative analytical approaches (Supplementary Appendix 8). Dose–response analyses supported these findings, with graded associations observed across most exposure–outcome combinations. Sexual harassment and physical violence showed weaker dose–response patterns for depression and anxiety, but not for suicidal thoughts (Supplementary Appendix 8).
Association between exposures and mental health outcomes, by profession

Table 3 Long description
The table presents data on the association between various workplace exposures and mental health outcomes for doctors and nurses. It includes columns for crude, partially adjusted, and fully adjusted values for both professions. The rows are categorized under depression, anxiety, and suicidal thoughts, with specific exposures such as bullying, sexual harassment, violent threats, physical violence, colleague support, support from superiors, meaning in work, and purpose in work. Each cell contains specific values representing the prevalence of mental health outcomes under different conditions. For example, under depression for doctors, bullying shows a crude value of 2.22, partially adjusted value of 2.02, and fully adjusted value of 2.02. The table provides a detailed comparison of how different exposures impact mental health outcomes in doctors and nurses.
All models include region as a second-order covariate. Crude models do not include additional covariates. Partially adjusted models include gender, age group and proximity to combat areas and occupied territories. Fully adjusted models incorporate covariates in addition to those of partially adjusted models, as follows: bullying and sexual harassment adjusted by healthcare setting, postgraduate training and length of service; violent threats and physical violence adjusted by healthcare setting; support from colleagues or superiors adjusted by healthcare setting and length of service; meaning and purpose in job adjusted by healthcare setting, relationship status, having children and length of service.
The highest prevalences of mental health problems were observed in Kyiv City, Kyiv Oblast and Sumy Oblast (Supplementary Appendix 9). To examine regional associations, we used intercepts from weakly informative, fully adjusted Bayesian models and estimated the prevalence ratios among exposed and unexposed individuals (Fig. 1).
Geographic distribution and prevalence ratios of mental health outcomes associated with workplace violence in Ukraine. Prevalence ratios for depression (left column) and anxiety (right column) are displayed among individuals exposed to the four types of workplace violence: bullying, sexual harassment, violent threats and physical violence. Absolute prevalences were obtained from fully adjusted Bayesian models and estimated as prevalence rations. Oblasts are colour-coded according to a binned prevalence ratio scale, ranging from lower values (pale yellow) to higher ones (dark blue). To contextualise within the ongoing conflict, oblasts are grouped by region status: proximity to active combat or occupation are outlined in red (‘Active’) with a light grey overlay pattern, whereas non-combat areas are outlined in grey (‘Non-active’). We could not retrieve data from Crimea, represented in turquoise. The relative visual uniformity within each individual map shows that the relative mental health burden associated with the exposures of interest is highly consistent nationwide, regardless of proximity to active combat zones.

Discussion
In this study, we estimated the prevalence of mental health problems and analysed their association with a range of exposures among doctors and nurses in Ukraine. This is the largest study conducted to date, with more than 20 000 responses from 25 of the 26 Ukrainian regions. We identified a substantial mental health burden in the health workforce and highlighted determinants that are potentially actionable at different levels, including exposure to violence, interpersonal support, and purpose and meaning at work.
Our finding that one in three doctors and one in four nurses may have depression, and one in four doctors and one in six nurses may have anxiety, is consistent with aggregated estimates of anxiety and depression reported across conflict-affected populations worldwide. Reference Charlson, van Ommeren, Flaxman, Cornett, Whiteford and Saxena22 This alignment suggests that, although substantial, the mental health burden among Ukrainian doctors and nurses reflects broader patterns observed in populations in conflict settings. Notwithstanding, comparisons with studies conducted in the general population are challenging because of the wide variability in reported estimates, with the prevalence of anxiety and depression ranging from approximately one in ten individuals Reference Martsenkovskyi, Shevlin, Ben-Ezra, Bondjers, Fox and Karatzias4 to nearly half of the population. Reference Lushchak, Velykodna, Bolman, Strilbytska, Berezovskyi and Storey23,Reference Xu, Pavlova, Chen, Petrytsa, Graf-Vlachy and Zhang24
Prevalence estimates in our study are higher than those previously reported among doctors and paramedics in Ukraine, Reference Rzońca, Podgórski, Łazarewicz, Gałązkowski, Rzońca and Detsyk3 and higher than estimates from the general population. Reference Martsenkovskyi, Shevlin, Ben-Ezra, Bondjers, Fox and Karatzias4 They are, however, comparable to levels observed among healthcare workers internationally during the COVID-19 pandemic. Reference Maqbali, Alsayed, Hughes, Hacker and Dickens5 Although direct comparisons are constrained by differences in study design, sampling strategies and measurement instruments, these findings may indicate a particularly elevated burden among doctors and nurses. This excess burden is plausibly related to the cumulative occupational stressors associated with prolonged conflict, including sustained exposure to traumatic injury, moral strain in resource-limited settings and the unique circumstance of healthcare workers themselves being targets of violence.
We identified four types of violence that were strongly associated with poor mental health. The most prevalent form of violence across professions and genders was bullying, reported by more than one in four respondents, in contrast to one out of ten respondents across other occupations. Reference Magnusson Hanson, Pentti, Nordentoft, Xu, Rugulies and Madsen25 Consistent with previous findings, Reference Theorell, Hammarström, Aronsson, Träskman Bendz, Grape and Hogstedt26 bullying was strongly associated with adverse mental health outcomes, with a three-fold increase in the odds of anxiety and depression. By contrast, physical violence was the least prevalent type of exposure, with reports ranging from 2.5% among female doctors to nearly 11% among male nurses. Despite its relatively low prevalence, physical violence was associated with a four-fold increase in the risk of reporting suicidal thoughts, and this has been shown in previous studies for other professions as well. Reference Magnusson Hanson, Pentti, Nordentoft, Xu, Rugulies and Madsen25
We also identified potentially protective factors operating at both the interpersonal and individual levels. Overall, 60% of respondents reported perceived support from colleagues, and approximately 50% from their immediate superiors. This finding is particularly relevant, as perceived social support represents a modifiable target for intervention Reference Zell and Stockus27 and can help mitigate the harmful effects of bullying. Reference Farley, Mokhtar, Ng and Niven28 At the individual level, nearly 90% of respondents reported continuing to find meaning and purpose in their daily work. This sense of meaning is shaped partly by social relationships, including those with colleagues and superiors, but also reflects deeper elements such as personal values and professional purpose. Reference Rosso, Dekas and Wrzesniewski29
Altogether, our findings show that mental health problems are highly prevalent and strongly associated with risk and protective factors, across professions and genders. This supports a zero-tolerance approach to workplace violence and the broad implementation of scalable mental health strategies that also strengthen protective factors – such as social support and sense of meaning at work (for example, interventions tailored to healthcare workers, like Doing What Matters or Problem Management Plus). Reference Mediavilla, Felez-Nobrega, McGreevy, Monistrol-Mula, Bravo-Ortiz and Bayón30 Of note, the prevalence of mental health problems, the proportion of individuals exposed to violence, and the strength of their associations were similar across regions. One plausible explanation is that the presence of Russian troops does not accurately capture exposure to the war: long-range missile and drone attacks routinely reach cities far from the frontline, including Kyiv, where single overnight strikes have killed dozens of civilians. The entire Ukrainian healthcare system is therefore facing the consequences of the war, and identifying drivers of poor mental health beyond region-level proxies of conflict exposure is critical to inform adequate organisational and public health strategies.
Our findings should be interpreted in light of several limitations. First, the non-probabilistic sampling strategy and the inability to estimate response or cooperation rates raise the possibility of selection and self-selection bias. We computed weighted estimates, which were very similar to unweighted estimates. However, gender-stratified data were not available for doctors and nurses, and we had to approximate the gender distribution in the healthcare workforce using internal data from both the Ministry of Health and the WHO Country Office in Ukraine. Moreover, even though the survey was disseminated through official channels, we could not control whether the survey link was used more than once or accessed by respondents who were not doctors or nurses. Second, mental health outcomes relied on self-reported screening tools (PHQ-9 and GAD-7), which, despite strong psychometric properties, may overestimate clinical disorder. Third, we did not assess exposure to war-related traumatic events or include any measure of probable post-traumatic stress disorder (PTSD). This was a deliberate decision, for two reasons: (a) the absence of a validated Ukrainian-language version of the PTSD Checklist for DSM-5 (PCL-5) or any comparable PTSD screener, as confirmed recently; Reference Figueiredo and Hefter31 and (b) the substantial additional survey length required to properly assess exposure to traumatic events, a prerequisite for valid probable-PTSD estimates under DSM-5 and ICD-11 criteria, which we judged would compromise the response rate. Consequently, our results likely underestimate the overall burden of mental health problems in this population, and we cannot disentangle the contribution of war-related trauma from that of workplace exposures. Fourth, the cross-sectional design precludes causal inference, and reverse causation cannot be ruled out. Finally, exposures and outcomes were measured within the same survey, which means that common method variance may have inflated associations.
Strengthening the well-being of healthcare workers in Ukraine will require structured, system-level approaches aligned with existing WHO guidance on mental health at work and with the European Framework for Action on the Health and Care Workforce. However, substantial uncertainties remain regarding how these recommendations can be effectively implemented under the sustained pressures of an ongoing war. Future research should therefore prioritise evaluating the real-world feasibility, acceptability and effectiveness of organisational interventions – such as clear leadership responsibilities for staff well-being, protected time and resources for mental health activities, adequate workload distribution, integration of well-being indicators into routine management and the creation of psychologically safe workplaces. Additional priorities include establishing national requirements for psychosocial risk assessment, piloting facilities that demonstrate integrated approaches to prevention and support, and strengthening multi-stakeholder coordination to ensure implementation and financing. Ultimately, sustained improvements will depend not only on the uptake of organisational reforms, but also on broader progress toward restoring safety and stability across the country.
Supplementary material
The supplementary material is available online at https://doi.org/10.1192/bjp.2026.10809
Data availability
The data that support the findings of this study are available from the corresponding author, R.M., upon reasonable request. The analytic code is available from GitHub (https://github.com/CCOMS-UAM/ukr-hcws-violence). The study materials (study protocol and questionnaire) are available on the Open Science Framework (https://doi.org/10.17605/OSF.IO/N6BWF).
Acknowledgements
The authors made use of AI tools to assist with the drafting of this article. The free version of ChatGPT, based on GPT-4, was used without modification between November 2025 and February 2026.
Author contributions
V.A.A.G., R.M. and J.L.A.-M. conceived the study design. V.A.A.G. conducted data curation and validation, and V.A.A.G. and R.M. were responsible for formal analysis, methodology, software and visualisation. T.Z., L.L. and J.L.A.-M. were responsible for funding acquisition. V.A.A.G., R.M., T.Z., A.M.T.-I., C.R., G.C., J.H., A.L.-B., O.K., K.C., I.M., I.K., L.L. and J.L.A.-M. conducted the study investigation. T.Z., A.M.T.-I., C.R., G.C., J.H., A.L.-B., L.L. and J.L.A.-M. were responsible for project administration. L.L., T.Z. and J.L.A.-M. were responsible for study resources. R.M. and J.L.A.-M. supervised the study. V.A.A.G. and R.M. wrote the original draft of the manuscript. T.Z., A.M.T.-I., C.R., G.C., J.H., A.L.-B., O.K., K.C., I.M., I.K., L.L. and J.L.A.-M. reviewed and edited the manuscript.
Funding
This study was funded by the European Commission (contribution agreement 70002272).
Declaration of interest
None.



 Open access


eLetters
No eLetters have been published for this article.