Implications
With the switch to light-emitting diode (LED) lighting occurring across the broiler industry it is important to confirm which wavelengths of light are best for production and animal welfare. Light-emitting diode lights output a much different and more complex spectrum than previously used types of light. The simplest of LEDs produce white light that can be either categorized as Cool or Warm. Little is known about which wavelength of light will optimize the production and welfare of broiler chickens. The present study demonstrated that broiler chickens had better growth, efficiency and improved welfare under Cool LED lighting when compared with Warm LED lighting.
Introduction
The poultry industry is currently undergoing a switch from traditional lighting sources to LED. This switch will lead to benefits such as decreased energy usage, increased bird performance and improved bird welfare via reduced fear and stress (Benson et al., Reference Benson, Hougentogler, McGurk, Herrman and Alphin2013; Watkins, Reference Watkins2014; Archer, Reference Archer2015; Huth and Archer, Reference Huth and Archer2015). Proper utilization of the LED technology is crucial to improving the production efficiency and animal welfare during poultry production. The use of LED lights allows for the manipulation of the light spectrum more readily than ever before which is especially important in poultry production as different light spectrums have been shown to affect bird behavior (Sultana et al., Reference Sultana, Hassan, Choe and Ryu2013) and even growth (Cao et al., Reference Cao, Liu, Wang, Xie, Jia and Chen2008; Riber, Reference Riber2015). Therefore a proper understanding of how different spectral outputs of produced by different LEDs have on the behavior and stress of poultry is essential.
Light spectrum produced by a light source is the combination of different wavelengths of electromagnetic radiation. The color ‘temperature’ of the electromagnetic radiation emitted from an ideal black body is defined as its surface temperature in kelvins. Many different wavelength combinations can combine to create the same kelvin measurement of white light. The kelvin rating is used to give an overall range of white light types. Light-emitting diodes emit light primarily by processes other than thermal radiation which means that the emitted radiation does not follow the form of a black-body spectrum. Alternatively, these sources are assigned what is known as a correlated color temperature (CCT). The CCT is the color temperature of a black-body radiator, which to human color perception, most closely matches the light from the lamp. Typical light fixtures in poultry usually range from 2700 to 5000 K. Color temperatures over 5000 K are called Cool, while lower color temperatures (2700 to 3000 K) are called Warm.
For poultry the visual range differs from that of a human in several ways, the most striking being inclusion of the UV range due to the addition of a fourth type of single-cone photoreceptor which humans lack (Osorio et al., Reference Osorio, Vorobyev and Jones1999; Prescott and Wathes, Reference Prescott and Wathes1999). Furthermore, spectral sensitivity is not even across the spectrum for birds as they have maximum visual sensitivity at 415, 455, 508 and 571 nm (Prescott et al., Reference Prescott, Wathes and Jarvis2003). This becomes crucial for poultry production as certain behaviors have been shown to be wavelength specific. Birds spend more time sitting or standing in place under short wavelengths (blue/green) and move more under longer (red/yellow) wavelengths (Sultana et al., Reference Sultana, Hassan, Choe and Ryu2013). In fact, Rozenboim et al. (Reference Rozenboim, Biran, Uni, Robinzon and Halevy1999) found that raising broilers under green and blue light enhanced weight gain over birds raised under white and red light. Rozenboim et al. (Reference Rozenboim, Biran, Chaiseha, Yahav, Rosenstrauch, Sklan and Halevy2004) even found that the timing of wavelength exposure can affect growth. Mixing green and blue light has also been observed to affect growth in broilers (Hassan et al., Reference Hassan, Sultana, Choe and Ryu2014; Yang et al., Reference Yang, Yu, Pan, Ying and Zhou2016). Different lighting fixtures output different spectra and LED lighting has been shown to improve feed conversion over compact fluorescent lamp lighting in broiler chickens as a result (Huth and Archer, Reference Huth and Archer2015; Rogers et al., Reference Rogers, Pritchett, Alphin, Brannick and Benson2015). Riber (Reference Riber2015) saw an increased growth in broilers reared under white LED with most blue light in their overall wavelength output. However, Olanrewaju et al. (Reference Olanrewaju, Purswell, Collier and Branton2015a) found that LED lights with differing color temperatures did not affect performance or carcass characteristics.
Measures such as physical asymmetry, heterophil/lymphocyte (H/L) ratio and corticosterone (CORT) concentration are often used to determine stress susceptibility of poultry. Increased physical asymmetry has been used to indicate a stronger perception of stress (Graham et al., Reference Graham, Freeman and Emlen1993; Knierim et al., Reference Knierim, Van Dongen, Forkman, Tuyttens, Spinka, Campo and Weissengruber2007; Archer and Mench, Reference Archer and Mench2013) and an indicator of current stress levels (Kellner and Alford, Reference Kellner and Alford2003). Immune cell populations change with changes in stress and increases in the ratio of H/L have been shown to indicate increased stress levels. The hormones released within the body during stress are a standard approach to determine stress and in poultry the main glucocorticoid hormone is corticosterone (Mormede et al., Reference Mormede, Andanson, Auperin, Beerda, Guemene, Malmkvist, Manteca, Manteuffel, Prunet, van Reenen, Richard and Veissier2007). Lighting has been shown to affect stress parameters (Onbasilar et al., Reference Onbasilar, Erol, Cantekin and Kaya2007; Campo et al., Reference Campo, Prieto and Davila2008; Xie et al., Reference Xie, Wang, Dong, Cao, Wang, Chen and Chen2008). Although Olanrewaju et al. (Reference Olanrewaju, Purswell, Collier and Branton2015a and 2015Reference Olanrewaju, Purswell, Maslin, Collier and Brantonb) concluded that LED lighting of different color temperatures did not affect stress in broilers it has been suggested by Xie et al. (Reference Xie, Wang, Dong, Cao, Wang, Chen and Chen2008) that blue light may play a role in alleviating stress response in broilers due to reduction in the level of serum IL-1β. Abdo et al. (Reference Abdo, El-Kassas, El-Nahas and Mahmoud2017) also observed that monochromatic blue light reduced the stress susceptibility of broilers during heat stress. Blue light has also been shown to improve immune response and alleviate the stress response in broilers (Zhang et al., Reference Zhang, Cao, Wang, Dong and Chen2014). As Cool white light contains more blue light than Warm white light it may be possible that Cool white light will see the same stress reduction as monochromatic blue light.
Different spectra of light have also been demonstrated to change fear responses in poultry (Sultana et al., Reference Sultana, Hassan, Choe and Ryu2013). This is important as fear is an important component of animal welfare and can be tied to stress and performance. Fear tests utilizing the animal’s anti-predator response have been found to be the most reliable methods for analyzing fear levels in animals (Miller et al., Reference Miller, Garner and Mench2005 and Reference Miller, Garner and Mench2006). Ratner (Reference Ratner1967) defined four phases of anti-predator fear responses progression from freezing, to fleeing, to fighting and finally tonic immobility (TI). Catching a chicken and holding it by its legs and inverting it will invoke its fight or flight response and has been found to be a useful means for measuring fear (Newberry and Blair, Reference Newberry and Blair1993). If a chicken cannot escape it will go into a state of TI. This response is characterized by a sustained period of non-responsiveness brought about by physical restraint (Maser et al., Reference Maser, Gallup and Barnhill1973; Jones, Reference Jones1986), and has been used as a reliable means of measuring fear (Jones, Reference Jones1986). Isolation of animals that live in groups also elicits a fear response and is often used to determine fear levels (Forkman et al., Reference Forkman, Boissy, Meunier-Salaün, Canali and Jones2007). Monochromatic blue light has been demonstrated to attenuate the fear reaction in a TI test, whereas red and red–yellow light increased the duration (Sultana et al., Reference Sultana, Hassan, Choe and Ryu2013). Furthermore, Prayitno et al. (Reference Prayitno, Phillips and Omed1997) found a higher occurrence of aggressive interactions in broilers reared under monochromatic red light compared with those reared under blue, green and white light. Harrison et al. (Reference Harrison, Mcginnis, Schumaier and Lauber1969) concluded that blue light has a calming effect on the birds, and it has been used during catching to keep birds calm as well as to reduce stress prior to processing at the plant (Barbosa et al., Reference Barbosa, de Carvalho, Rossa, Soares, Coro, Shimokomaki and Ida2013). Mohamed et al. (Reference Mohamed, Eltholth and El-Saidy2014) found that rearing broilers under blue light reduced both fear and stress.
Little research has been done to determine how different color temperature white LED lights affect the growth and welfare of broiler chickens; therefore we conducted an experiment to investigate this. The objective of this present study was to determine if utilizing a single color temperature of LED light (2700 v. 5000 K) during the rearing of broiler chickens would affect the productivity, stress susceptibility and fear response of the birds. It is hypothesized that broilers raised under Cool light which contains more blue light will have improved growth and reduced fear and stress susceptibility when compared with Warm white light that has more yellow/red light.
Material and methods
General procedures
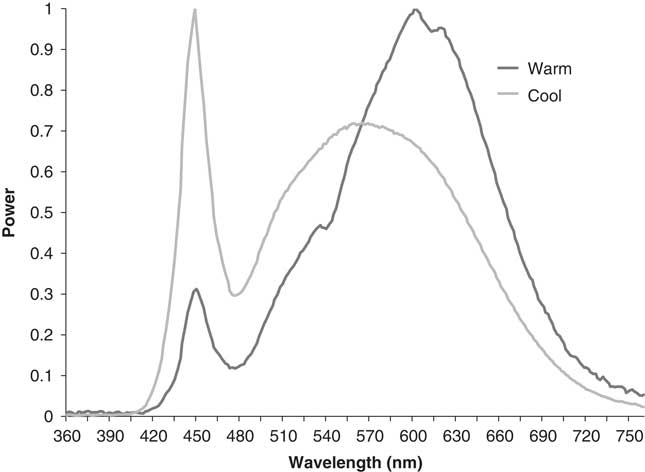
The study was conducted using Cobb500 broilers (n=960). This experiment involved two treatments and two trials: Cool (L6A19DIM 6W, 5000 K; Overdrive, Roanoke, VA, USA) LEDs and Warm (L6A19DIM 6W, 2700 K, Overdrive) LEDs. A comparison of spectra between these bulbs can be seen in Figure 1. Each treatment consisted of eight pens containing 30 Cobb broiler chicks each in a light tight room outfitted with one of the light sources. Two in time replications(trials) were conducted to investigate the differential effects of providing Cool LED light v. Warm LED light during growth on growth, fear and stress. The light type was rotated between rooms to control for any ‘room affect’. Each of the two rooms utilized was set up in an identical pattern, with the only difference being the light bulbs in the fixtures. Each room measured 8.1×5.8 m, constructed of thick concrete walls, and sealed to prevent any outside light from entering. Ventilation was provided by a single fan on the north end of the room exhausting air, which created negative pressure in the room and drew air in through cooling pads on the south wall. Each of the pens measured 1.2-m wide, 2.4-m long and 0.6-m depth. The birds were managed according to the guidelines set forth in the Guide for the Care and Use of Agricultural Animals in Research and Teaching (Federation of Animal Science Societies, 2010). The pens were lined with two to three inches of pine shavings. One tube feeder and a single row of six nipple drinkers were provided per pen, and adjusted for height as the birds grew. All feed was weighed and recorded (Ohaus Champ CD-11; Ohaus, Pine Brook, NJ, USA), and the residual feed at the end of the study was subtracted from the total. All feed was produced at the Texas A&M feed mill and birds were provided starter (day 0 to 14), grower (day 15 to 28) and finisher feed (day 9 to 42). There were six light fixtures in each room, and four of them were directly over the pens 3 m above the floor. All lights were connected to a single dimmer and timer per room. For the 1st week, the birds were given 23 h light–1 h dark at 20 lux of light as measured at bird head height using a light meter (Extech 401027; Extech Instruments, Nashua, NH, USA). The flicker rate was measured using a spectral flickering irradiance meter (SFIM-300; Everfine, Hangzhou, China) and both bulbs had a flicker index of 0.04 and 150 Hz at 20 lux. For the rest of the trial the lights were dimmed down to 5 lux and 20 h light–4 h dark which are commonly used by commercial poultry producers in the United States. Both bulbs had a flicker index of 0.05 and 350 Hz at 5 lux. No dawn/dusk period was provided at any time point. Upon conclusion of the study, all birds were euthanized with a mixture of air and CO2. All methods were approved by the Texas A&M Institutional Animal Care and Use Committee (AUP no. 2015-0255).
Light frequency spectrum for Cool (5000 K) and Warm (2700 K) light-emitting diode lights used to rear birds in this study. Measured at bird level using handheld spectrometer (model MK350; UPRtek, Zhunan Township, Taiwan). Spectrum and flicker rate was the same at 5 or 20 lux for both types of bulbs.

Growth and feed conversion
The birds in each pen were weighed at day 0 and day 42 and BW gain was calculated by subtracting day 0 weight from day 42 weights. Chicks were randomly allocated to pens on day 0. Feed was weighed before it was added to the feeder in each pen and residual feed was weighed back on days when birds transitioned from feed type (i.e. starter to grower) and on day 42 so that feed intake could be calculated. Feed conversion ratio was calculated by dividing the total feed intake per pen by the total BW gain per pen and was corrected for mortality (mortality was weighed and added to final pen weights).
Fear tests
Isolation
To test the fear response of chicks an isolation test was performed using methods modified from Archer (Reference Archer2017). In brief, the isolation tests were performed at 10 days of age by randomly collecting eight birds from a pen and placing them in a dark blue 133-l uncovered plastic container. A timer was set for 3 min, and the number of vocalizations produced by the bird during this time was counted. More vocalizations were considered to indicate more fearfulness (Forkman et al., Reference Forkman, Boissy, Meunier-Salaün, Canali and Jones2007; Archer and Mench, Reference Archer and Mench2014).
Tonic immobility
Tonic immobility was conducted at 5 weeks of age by again using methods described in Archer (Reference Archer2017). In brief, eight random birds from each pen were caught and placed in a U-shaped cradle on its back. The head of the bird was covered with one hand while the breast was held with the other for ~15 s to induce TI, after which time contact was removed and a timer was started. If the bird righted itself within 15 s, the timer was reset and the above procedure was performed again. If again the bird righted itself in under 15 s, it was recorded as a time of 0. Otherwise the latency of each bird to right itself (or attempting to right itself) was recorded, with a maximum of 10 min. Longer latency for birds to right themselves were considered to indicate more fearfulness (Jones, Reference Jones1986).
Inversion
When the birds were 42 days old we subjected the same eight birds that had been used for TI testing to an INV test, as described by Newberry and Blair (Reference Newberry and Blair1993). Each bird was caught and then inverted it by holding it by its legs with one hand until the bird ceased to wing flap, or for 30 s. The intensity of flapping was determined by counting the number of wing flaps and duration of flapping from video recordings (ZR900; Canon, Melville, NY, USA; 24 frames per second). Greater intensity of flapping was considered to indicate more fearfulness (Newberry and Blair, Reference Newberry and Blair1993). The same birds were used in all fear tests and there is no evidence (Archer, unpublished) that these two tests would affect each other as they were carried out several days apart.
Stress measures
Physical asymmetry
Physical asymmetry of each bird was measured as per Archer et al. (Reference Archer, Shivaprasad and Mench2009) at 42 days immediately after they were euthanized. In brief, using a calibrated Craftsman IP54 Digital Caliper (Sears Holdings, Hoffman Estates, IL, USA), the middle toe length, metatarsal length and metatarsal width were measured for both the right and left legs. The composite asymmetry score was calculated by taking the sum of the absolute value of left minus right of each trait, then dividing by the total number of traits. Thus the formula for this trial would be (|L−R|Middle toe length+|L−R|metatarsal length+|L−R|metharsal width)/3=composite asymmetry score.
Corticosterone and heterophil/lymphocyte ratio
At 42 days blood samples were randomly collected from 20 birds per treatment for corticosterone analysis and an additional 20 (total 40 birds) for heterophil/lymphocyte analysis. The area around the wing vein was sanitized with 70% alcohol, and in preparation, the inside of a 3-ml syringe was lined with a small amount of heparin. Between 1 and 2 ml of blood were collected from each bird, and a drop was used to prepare a blood–smear slide for heterophil/lymphocyte analysis (described below). The remaining blood was injected into a plasma separation gel and lithium heparin vacutainer (BD 368056; BD, Franklin Lakes, NJ, USA), which was temporarily stored in an ice bath. Once all samples had been taken, the vacutainers were spun down in a Beckman GS-6R centrifuge (Beckman Coulter, Brea, CA, USA) for 15 min at 4000 r.p.m. to separate the cells from the plasma. The plasma was poured off into 2 ml microcentrifuge tubes and stored at −19°C until further analysis. Plasma corticosterone and serotonin concentrations were measured using a commercially available ELISA kit (corticosterone: ADI-901-097; Enzo Life Sciences, Farmingdale, NY, USA; serotonin: ADI-EKS-715; Enzo Life Sciences). The inter- and intra-assay %CV were both under 5% for both types of assays.
The blood–smear slides were stained using a hematology staining kit (Catalog no. 25034, Polysciences Inc., Warrington, PA, USA). Heterophil/lymphocyte ratio was measured by taking the blood–smear slides and observing them under 1000× magnification (10× eyepiece, 100× oil emersion lens) using an Omax DCE-2 microscope (Omax, Kent, WA, USA). An area of the slide that had moderate cell density (no overlapping cells) was chosen, and the numbers of both heterophils and lymphocytes observed were counted until the total observed number reached 100 (Campo et al., Reference Campo, Prieto and Davila2008). A keystroke counter was used to accurately keep track of the number of cells observed. Increases in corticosterone (Cockrem, Reference Cockrem2007) and H/L ratios (Gross and Siegel, Reference Gross and Siegel1983) indicated increases in stress.
Statistical analysis
General linear models were used to investigate treatment, trial, treatment×trial effects on composite asymmetry, isolation, TI, INV, corticosterone, H/L ratio, weight gain and feed conversion. The LSD test was used to test all planned comparisons. All of the assumptions of GLM were tested (Shapiro–Wilk test for normality, Levene’s test for homogeneity of variance). No transformations were needed to meet assumptions. All analyses were performed using SAS 9.3 for Windows (SAS Institute Inc., Cary, NC, USA). Significant differences were determined at P<0.05. No effects were observed on trial or treatment×trial interaction so only treatment effects will be discussed.
Results
Growth and feed conversion
Growth and feed conversion data are presented in Table 1. Differences were observed between treatments in both 42 day BWs (F 1,28=7.78, P=0.01) and feed conversion (F 1,28=5.55, P=0.03). The broilers reared under Cool LED lighting were heavier on day 42 (2.89±0.03 kg, P=0.02) and had better feed conversion (1.54±0.03, P=0.02) compared with the broilers raised under Warm LED lighting (2.79±0.03 kg and 1.61±0.01, respectively).
The BW (kg) and feed conversion ratio (FCR) at 42 days of age, number of vocalizations during 3 min isolation (n/3 min), latency to right during tonic immobility (s), flapping intensity during inversion (flaps/s), composite asymmetry score (mm), plasma corticosterone (ng/dl) and heterophil/lymphocyte ratio of broilers reared under Cool (5000 K) or Warm (2700 K) light-emitting diode (LED) lights

a,bDiffering letters within column indicate significant differences (P<0.05).
Fear tests
Fear test data are presented in Table 1. Differences in fear responses were observed between treatments in all three fear tests (Isolation: F 1,236=8.00, P=0.005; TI: F 1,236=13.64, P<0.001; INV: F 1,236=43.28, P<0.001). The broilers reared under Cool LED lighting vocalized fewer times during isolation (45.3±2.8 vocalizations within 3-min period, P=0.005), had shorter latency to right during TI (136.2±11.1 s, P=0.001) and flapped less intensely during INV (4.08±0.10 flaps/s, P=0.001) when compared with the broilers that were raised under Warm LED lighting (56.5±2.9 vocalizations within 3-min period, 207.2±15.8 s and 4.92±0.08 flaps/s, respectively).
Stress measures
Stress measure data are presented in Table 1. Differences in stress susceptibility were observed between treatments in all three stress measures (asymmetry: F 1,236=20.34, P<0.001; corticosterone: F 1,76=11.50, P=0.001; H/L ratio: F 1,156=4.69, P<0.03). The broilers reared under Cool LED lighting had lower composite asymmetry (1.65±0.08 mm, P=0.001), had lower plasma corticosterone concentrations (5.8±1.2 ng/dl, P=0.01) and lower H/L ratios (0.16±0.01, P=0.03) when compared with the broilers that were raised under Warm LED lighting (2.38±0.14 mm, 13.4±2.7 ng/dl and 0.21±0.02, respectively).
Discussion
The productivity and welfare of broiler chickens was affected by the different color temperatures of LEDs used in this study. The Cool white led bulbs resulted in birds that were heavier and had better feed conversion after 42 day of rearing. This is contradictory to what Olanrewaju et al. (Reference Olanrewaju, Purswell, Collier and Branton2015a and Reference Olanrewaju, Purswell, Maslin, Collier and Branton2015b) observed. A possible explanation could be that this current study used bulbs from a different manufacturer (Overdrive) than what Olanrewaju et al. (Reference Olanrewaju, Purswell, Collier and Branton2015a and Reference Olanrewaju, Purswell, Maslin, Collier and Branton2015b) used (Green Watt). Each LED manufacture is known to alter the wavelength that is emitted to their own specifications. Even if bulbs have the same kelvin rating they do not emit the same wavelengths. Some bulbs may have more blue or green for example. Huth and Archer (Reference Huth and Archer2015) observed that LEDs from different manufacturers had differing spectrums and resulted in differing growth and stress susceptibility. As we do not have access to the exact bulbs Olanrewaju et al. (Reference Olanrewaju, Purswell, Collier and Branton2015a and Reference Olanrewaju, Purswell, Maslin, Collier and Branton2015b) used and they did not provide a spectrogram of their bulbs we do not know how exactly they compared with those used in this study. The results of this current study do, however, seem to agree with previous research which found that green/blue light resulted in better growth than red light (Rozenboim et al, Reference Rozenboim, Biran, Uni, Robinzon and Halevy1999 and Reference Rozenboim, Biran, Chaiseha, Yahav, Rosenstrauch, Sklan and Halevy2004; Hassan et al., Reference Hassan, Sultana, Choe and Ryu2014; Yang et al., Reference Yang, Yu, Pan, Ying and Zhou2016). Although the previous research used monochromatic light the Cool lights in this current study would have more output from the blue/green wavelengths of the spectrum whereas the Warm lights had more output from the red wavelengths of the spectrum (Figure 1). Riber (Reference Riber2015) observed that rearing broilers under LED lights with more blue light contained in their spectrums resulted in greater weight gain.
The fear responses of the broilers in this current study were also affected by the color temperature of the light under which they were reared. Birds were less fearful when reared under the Cool LED lighting. Broilers reared under Cool LED lighting vocalized less during isolation, had shorter latency to right during TI testing and flapped less intensely during INV testing all which have been previously used to determine fear response (Jones, Reference Jones1986; Newberry and Blair, Reference Newberry and Blair1993; Forkman et al., Reference Forkman, Boissy, Meunier-Salaün, Canali and Jones2007; Archer and Mench, Reference Archer and Mench2013 and Reference Archer and Mench2014). No previous research has been conducted looking at the fear response of broilers reared under different color temperature LEDs making these results novel. However, different monochromatic spectra have been shown to elicit differing fear responses in poultry (Sultana et al., Reference Sultana, Hassan, Choe and Ryu2013). Sultana et al. (Reference Sultana, Hassan, Choe and Ryu2013) observed shorter TI responses of birds reared under monochromatic blue light. Furthermore, differing types of lighting which all emit differing spectra of light have been observed to result in broilers with differing levels of fear (Archer, Reference Archer2015 and Reference Archer2016; Huth and Archer, Reference Huth and Archer2015). Though more research would be needed to confirm it is again thought that increased level of blue light in the Cool LED treatment is what contributed to the reduced fear observed in this current study.
The stress susceptibility of the broilers in this current study were also affected by the color temperature of the light under which they were reared. Birds were less stress susceptible if they were raised under Cool LED lighting. Broilers reared under Cool LED lighting had lower composite asymmetry, lower plasma corticosterone and lower H/L ratios when compared with broilers reared under Warm LED lighting. This again disagreed with Olanrewaju et al. (Reference Olanrewaju, Purswell, Collier and Branton2015a and Reference Olanrewaju, Purswell, Maslin, Collier and Branton2015b) who observed no differences in corticosterone and other stress measures when birds were reared with LEDs with differing color temperatures. Again Olanrewaju et al. (Reference Olanrewaju, Purswell, Collier and Branton2015a and Reference Olanrewaju, Purswell, Maslin, Collier and Branton2015b) used bulbs from a different manufacture than those used in this current study which could explain why they observed no effect. Previous research investigating different lighting fixture types has, however, observed differences in stress susceptibility (Archer, Reference Archer2015 and Reference Archer2016; Huth and Archer, Reference Huth and Archer2015) and those fixtures produce differing spectra even when they are the same color temperature.
Furthermore, with the shift to LED lighting technology by the poultry industry it is important to determine the appropriate lighting fixtures to optimize productivity and animal welfare. Although there has been a vast amount of research done on lighting and how it affects poultry it is now likely outdated as it is based on old technology. Recent research has demonstrated that using LEDs can increase production and improve welfare when compared with incandescent and compact fluorescent technology (Mendes et al., Reference Mendes, Paixao, Restelatto, Morello, de Moura and Possenti2013; Archer, Reference Archer2015; Huth and Archer, Reference Huth and Archer2015) and that even the placement of the lighting fixtures can impact those factors as well (Archer, Reference Archer2015). Even the current management protocols for intensity of lighting have been called into question as broilers raised under LED lights have been shown to grow and have similar welfare under bright light which is not true for incandescent lighting (Archer, Reference Archer2016). This current study demonstrates that color temperature of light is an important factor for optimizing productivity and welfare. Although this current study disagrees with the only other research looking at the effects of Cool v. Warm LED lights on broilers (Olanrewaju et al., Reference Olanrewaju, Purswell, Collier and Branton2015a and Reference Olanrewaju, Purswell, Maslin, Collier and Branton2015b) that only further illustrates that bulbs produced by different manufactures may also be a factor as all LEDs are not created equal (Huth and Archer, Reference Huth and Archer2015). The differences observed in the current study between Cool and Warm LED lights in growth, fear and stress susceptibility likely are related to the amount of blue light in the Cool LED when compared with the Warm LED (Figure 1) and conversely the amount of red/yellow light. While little to no research has been published looking at the effect of white light color temperature there is a large amount on monochromatic light. That literature overwhelmingly demonstrates that blue light increases growth and reduces stress and fear in poultry. Therefore, when using white light to rear broilers, as this current study demonstrated, it is important to use Cool LED light that contains a sufficient amount of blue light to maximize production and welfare.
Previous research has illustrated that the spectra of light that broilers are reared under can greatly impact their growth and welfare. However, rearing birds under monochromatic lighting especially that of shorter wavelengths is not always suitable for poultry workers. Short wavelengths have been reported to be associated with human health problems (Lougheed, Reference Lougheed2014), therefore, lighting used in poultry housing will likely be white with specific color temperatures containing the optimum wavelengths growth and welfare. Lighting has always been an important environmental factor in the rearing of poultry but LED lighting now provides the ability to create the appropriate light spectra to maximize productivity and welfare.
Acknowledgment
The author thank Cobb-Vantress for the donation of chicks for this study.