





Introduction
As outbreak detection remains a relevant task in infection prevention and control (IPC), several institutions have implemented routine sequencing strategies to uncover potential nosocomial transmission events. Due to resource constraints, these typically focus on multidrug-resistant organisms (MDROs) Reference Mellmann, Bletz and Boking1 or on clinical isolates, Reference Sundermann, Kumar and Griffith2 thus resulting in a potential blind spot concerning susceptible but epidemiologically relevant microorganisms. Semi or fully automated outbreak detection systems (AODS) may address this blind spot by detecting clusters based on patient movement, microorganism and phenotypical data. In 2018, our institution implemented an AODS, the CLuster AleRt system (CLAR), which continuously evaluates microorganism frequency to identify statistically unexpected counts of isolates. Reference Aghdassi, Kohlmorgen and Schroder3,Reference Schroder, Pena Diaz and Rohde4
Although automated outbreak detection has a long history in healthcare epidemiology, Reference Wright, Perencevich, Novak, Hebden, Standiford and Harris5–Reference Childress and Childress9 recent advances in machine learning (ML) have renewed interest in developing systems that can identify clinically and epidemiologically relevant clusters from routinely collected data. Reference El Arab, Almoosa, Alkhunaizi, Abuadas and Somerville10–Reference Sundermann, Chen and Miller12 While genotyping provides the most accurate assessment of transmission events, Reference Gilchrist, Turner, Riley, Petri and Hewlett13,Reference Prior, Becker and Brandt14 the limited resources lead to small and biased datasets. In contrast, expert-reviewed alerts generated by a hospitalwide AODS cover a much broader range of epidemiological events. However, the concordance between these assessments and genotypic clustering has not previously been investigated. Here, we addressed this question to inform future ML-based identification of relevant CLAR alerts and to better understand what information is captured when expert assessment will be used as the outcome for model development.
Methods
Study design and setting
We conducted a retrospective observational study including manually annotated CLAR alerts from all wards of Charité — University Medical Center Berlin, a 3,000-bed university hospital with three hospital sites and approximately 150 in patient units. CLAR alerts have been manually assessed for relevance since August 2019 as part of routine IPC work. This retrospective study considered alerts generated between August 1, 2019 and December 31, 2024, and genotyping results from the same period.
The CLuster AleRt system
CLAR is a module of the HygienePortal, a digital platform for IPC and hospital epidemiology developed in-house that supports IPC management and real-time data integration and analysis (Figure 1). It has the functionality of a rule-based AODS that generates alerts indicating temporal and spatial clusters of microorganism detections. Important settings of CLAR rules involve specification of considered microorganisms, specimen types, wards or departments, antibiotic susceptibility testing results, specification of time intervals and handling of repeat isolates (copy strains). Routinely implemented rules daily evaluate unusual patterns either of selected pathogens that are particularly relevant in the context of hospital outbreaks (Acinetobacter baumanii, Clostridioides difficile, Citrobacter species, Escherichia coli, Enterococcus faecalis, Enterococcus faecium, Enterobacter species, Klebsiella species, Pseudomonas aeruginosa, Staphylococcus aureus, Salmonella species, Serratia species, and selected viruses) or of any microorganism in blood cultures. CLAR is not restricted to MDRO, but also considers isolates without relevant antimicrobial resistance. Temporal clustering is assessed using predefined 14-day or 30-day intervals, while spatial clustering is evaluated based on patient movement at the level of individual hospital wards or prespecified groups of wards. By considering historical data of more than one year, CLAR generates alerts if the identified cluster size exceeds an expected threshold value calculated by at least one of six employed algorithms (early aberration reporting system (EARS), Reference Hutwagner, Thompson, Seeman and Treadwell15 cumulative sums, Reference Watkins, Eagleson, Veenendaal, Wright and Plant16 Farrington Reference Farrington, Andrews, Beale and Catchpole17 and three confidence interval algorithms using different assumptions of data distribution Reference Nishiura18 ). Further details of the system as well as the applied rules and algorithms are given in the supplementary material and the previous work by Schröder et al. Reference Schroder, Pena Diaz and Rohde4
Schematic representation of data sources and integration of the automated outbreak detection system CLAR into routine IPC workflow. Data from the hospital electronic health records and the laboratory system were migrated into the HygienePortal, a digital, in-house developed IPC system of the hospital. It includes a data warehouse with structured data about patient movements (e.g., hospital admission and discharge, ward transfers), microbiological results (e.g., positive blood cultures), patient demographics (e.g., age, gender, comorbidities), and outcomes (e.g., in-hospital death). Important settings of CLAR rules involve definition of considered species, specimen type, ward or departments; antibiotic susceptibility testing results; specification of time intervals and handling of copy strains; use of different statistical algorithms: EARS, CuSums, Farrington, confidence interval methods (Poisson, score, normal distribution). CLAR, CLuster AleRt system; CuSums, cumulative sums; EARS, Early Aberration Reporting System.

The primary use case of CLAR is the early detection of hospital outbreaks, with a particular focus on identifying potential transmission chains. As additional cases are detected over time, the system may generate repeated alerts for the same cluster. Generated CLAR alerts were assessed by the IPC team on a daily basis without strictly predefined criteria. If the responsible physician, based on clinical context and epidemiological information, rated alerts as relevant and suspected transmission events, genotyping was frequently requested. In many cases, genotyping was not restricted to CLAR alert isolates, but could also include isolates of previous clusters or manually detected cases, reflecting complex constellations in real-world hospital environments.
The data sources of CLAR and the integration of the system into the routine workflow of the IPC team are visualized in Figure 1.
Genomic analysis of isolates
Genotyping was performed for available bacterial isolates either by whole-genome sequencing (WGS) using core-genome multilocus sequence typing (cgMLST) or repetitive-sequence-based polymerase chain reaction (rep-PCR). The corresponding reports contained information on the genomic concordance of all currently analyzed isolates in terms of identified clusters (based on species-specific allelic distance thresholds (cgMLST) or band pattern similarity thresholds (rep-PCR)). WGS was performed using short-read sequencing technology on Illumina MiSeq or iSeq platforms, while strain typing by rep-PCR was conducted using the DiversiLab system. If new cases with an epidemiological link were detected and additional isolates were requested for genotyping, a report series was created with follow-up reports containing information on the new isolates in comparison with older isolates. All reports were communicated to the requesting IPC team. The absence of genomic concordance was interpreted as evidence against transmission, whereas genomic concordance was considered suggestive of a possible transmission event.
Data collection
During the study period, all CLAR alerts of bacterial isolates that were manually annotated by the IPC team as relevant and all genotyping reports were reviewed. Genotyping reports contained information about species, isolates, sample date, reporting date, applied methods and assignment of isolates to genomic clusters. Data of CLAR alerts included affected wards and patients, species, isolates, sample date, specimen type, antibiotic susceptibility testing results, triggering algorithms (i.e. exceeding calculated threshold), patient movements and relevance assessment of IPC physicians. For the purpose of this article, we applied the following terminology described in Table 1.
Definition and explanation of applied terminology

Table 1. Long description
A table with six rows and two columns defining and explaining terminology used in cluster detection and alert management. The first column lists terms such as Alert series vs single alerts, Algorithmic clusters, Epidemiological clusters, Genotyping report series, Genomic clusters, and G+/G-CLAR alert. The second column provides detailed explanations for each term. For example, Alert series vs single alerts explains the difference between original and secondary alerts. Algorithmic clusters describe how alerts are counted to avoid double counting. Epidemiological clusters detail the relevance and genotyping assessment. Genotyping report series refers to constellations with multiple genotyping reports. Genomic clusters define how isolates with matching genotypes form a cluster. G+/G-CLAR alert classifies CLAR alerts based on genomic level matching.
The assessment of CLAR alerts and genotyping reports is visualized in section 3 of the supplementary material.
Inclusion and exclusion criteria
Given the retrospective nature of the study, we had to apply the following inclusion and exclusion criteria as well as the following sequence of steps to arrive at our final data set:
-
1. Genotyping reports from the investigated period were included, and, where applicable, report series were identified
-
2. CLAR alerts with bacterial isolates and assessed as relevant by IPC physicians were included, and, where applicable, alert series were identified
-
3. Only genotyping reports and alerts that could be matched (i.e. genotypically investigated CLAR alerts) were included. Where genotyping results were available for more than one CLAR alert per alert series, only the earliest alert with at least one genotyped isolate was included in the analysis. Similarly, where more than one genotyping result was available for an epidemiological cluster, only the first report with at least one CLAR isolate was included in the analysis. This decision was made to emulate conditions at the beginning of an outbreak. Initial reports of a genotyping report series reflect the time point at which an alert was first considered clinically relevant and triggered further investigation, including genotyping. Follow-up reports a priori have a higher likelihood of clustering which would introduce a bias toward higher concordance between epidemiological relevance and genotyping results. Consequently, the number of considered epidemiological clusters in the final data set equals the number of analyzed genotyping reports and CLAR alerts.
Primary and secondary outcomes
The primary outcome was the proportion of G+ CLAR alerts (definition provided in Table 1 and visualized in supplementary material) among all genotypically investigated CLAR alerts. This proportion was not reported as a positive predictive value, because not all relevant CLAR alerts underwent genotyping. Secondary outcomes were characteristics of CLAR alerts associated with concordance between relevance assessment and genotyping results.
Statistical analysis
To determine the concordance between epidemiological relevance and genotyping result, we calculated the proportion of G+ CLAR alerts of all genotypically investigated CLAR alerts. Differences between G+ and G- CLAR alerts were tested using chi-squared test (for categorical variables), Fisher’s exact test (for categorical variables with cell counts <5) or Mann–Whitney-U test (for continuous variables). Agreement statistics (e.g., Cohen’s kappa) were not calculated, because the study population was restricted to alerts classified as epidemiologically relevant. A multivariable logistic regression analysis with a stepwise backward approach was performed to investigate if parameters of CLAR alerts were associated with concordance between relevance assessment and genotyping results. Variables were selected based on epidemiological rationale, relevance to outbreak detection, and results of univariable analysis. A P value < .05 was used as the threshold for statistical significance. Analyses were performed in SPSS version 29.0 and R-Studio version 4.5.3.
Results
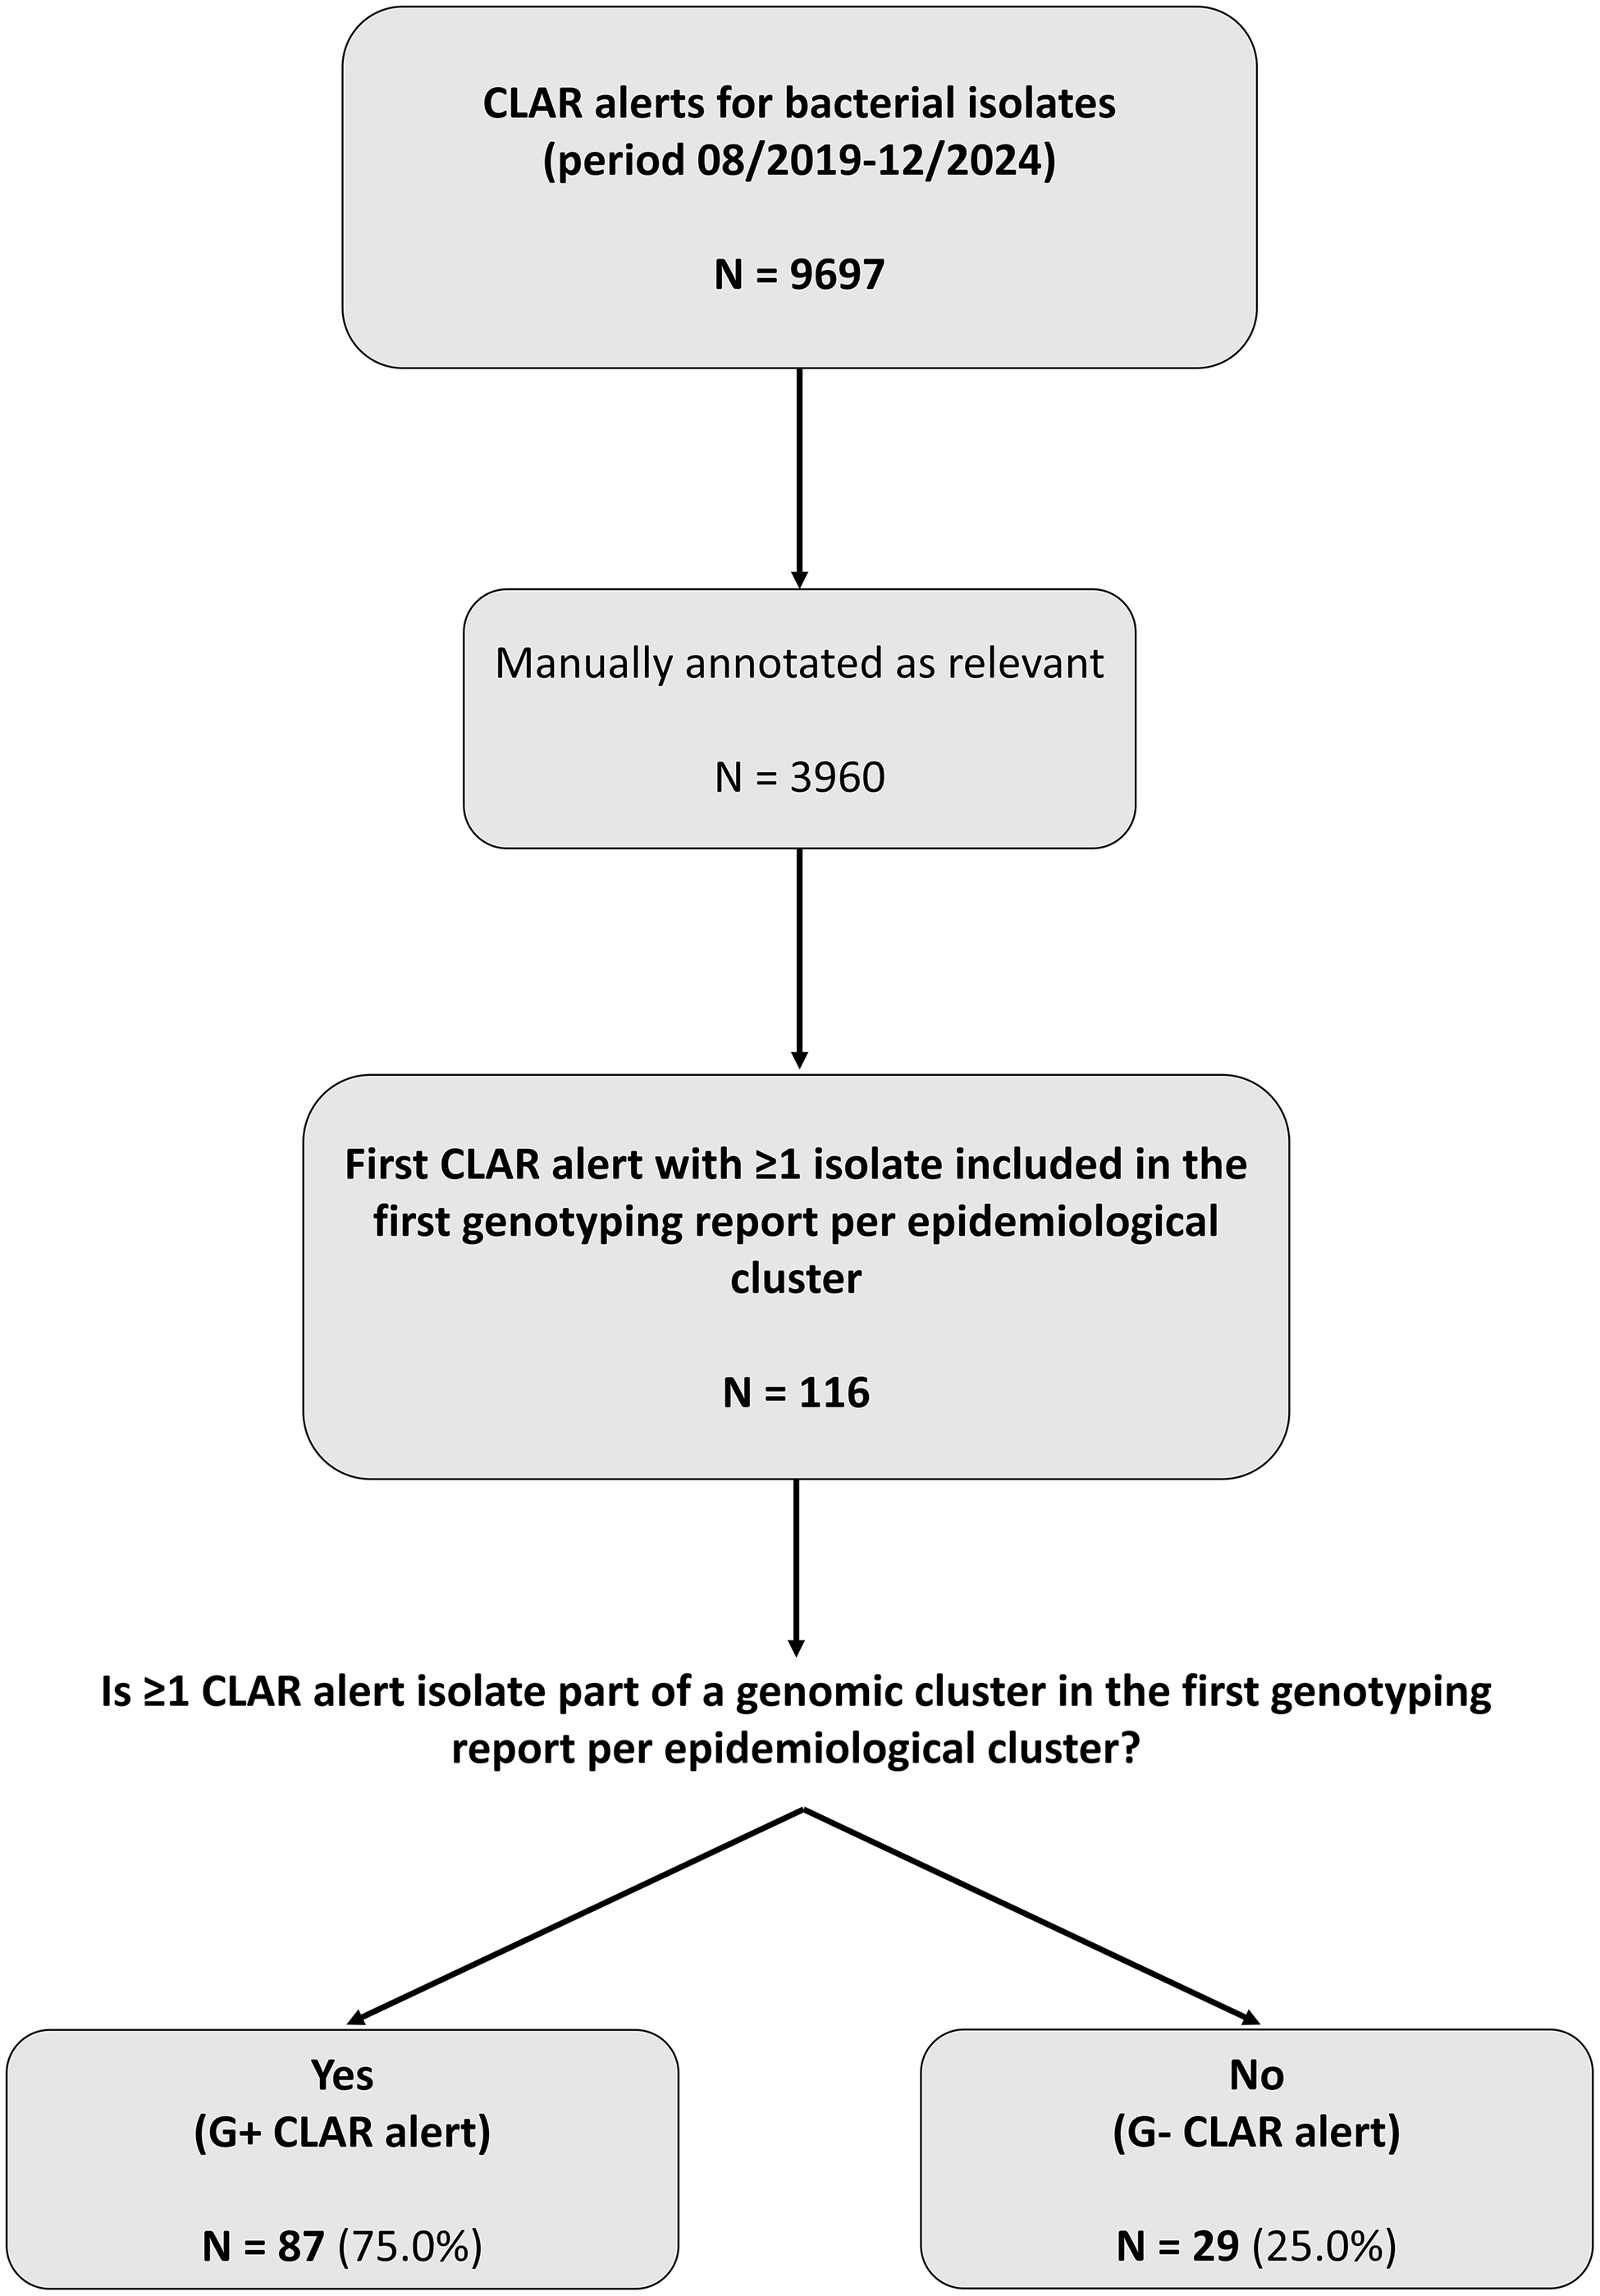
During the study period, 9,697 alerts for bacterial isolates were recorded. The alerts comprised 6,282 distinct algorithmic clusters (Figure 2). Of these, 3,960 alerts (40.8%) representing 2,992 algorithmic clusters (47.6%) were assessed as relevant. Suitable genotyping reports could be matched in 116 cases to CLAR alerts, resulting in 116 considered epidemiological clusters. Overall, the first CLAR alerts of epidemiological clusters comprised 360 unique patient isolates and contained between two to twelve patient isolates per alert (median: 2) (Table 2).
Flowchart of CLAR alert assessment results. cgMLST, core genome multilocus sequence typing; CLAR, CLuster AleRt system.

Comparison of included CLAR alerts with isolates belonging to genomic clusters (G+ CLAR alert) and without isolates belonging to genomic clusters (G- CLAR alert)

Table 2. Long description
A table comparing CLAR alerts with isolates belonging to genomic clusters (G+CLAR alerts) and without isolates belonging to genomic clusters (G-CLAR alerts). The table has 16 rows and 8 columns. Column headers are Overall, n (%); Period, n (%); Ward type, n (%); Alert size, median (IQR); Alerting algorithm, n (%); Number of alerting algorithms, n (%); Type of algorithmic cluster, n (%); Original alert of alert series or single alert, n (%); Species, n (%); Specimen type of CLAR alert isolates, n (%); Antibiotic resistance of CLAR alert isolates (MDRO), n (%). Row 1: Overall, n (%): All first CLAR alerts per epidemiological cluster, 116 (100.0); G+CLAR alerts, 87 (100.0); G-CLAR alerts, 29 (100.0); P value, ; % of G + CLAR alerts per category, 75.0. Row 2: Period, n (%): 08-12/2019, 6 (5.2); 2020, 31 (26.7); 2021, 39 (33.6); 2022, 17 (14.7); 2023, 8 (6.9); 2024, 15 (12.9). Row 3: Ward type, n (%): Intensive care unit (ICU), 64 (55.2); Non-ICU, 20 (17.2); Neonatology, 32 (27.6). Row 4: Alert size, median (IQR): Number of different patients, 2 (2-3). Row 5: Alerting algorithm, n (%): EARS, 78 (67.2); CuSums, 48 (41.4); Farrington, 35 (30.2); CI, 84 (72.4); CI-Poisson, 108 (93.1); Z-Score, 108 (93.1). Row 6: Number of alerting algorithms, n (%): 1, 6 (5.2); 2, 2 (1.7); 3, 27 (23.3); 4, 43 (37.1); 5, 26 (22.4); 6, 12 (10.3). Row 7: Type of algorithmic cluster, n (%): Single alert, 50 (43.1); Alert series, 66 (56.9). Row 8: Original alert of alert series or single alert, n (%): Yes, 78 (67.2); No, 38 (32.8). Row 9: Species, n (%): K. pneumoniae, 30 (25.9); E. faecium, 21 (18.1); S. aureus, 16 (13.8); S. marcescens, 14 (12.1); K. oxytoca, 8 (6.9); A. baumannii, 5 (4.3); E. coli, 5 (4.3); E. cloacae, 4 (3.4); C. freundii, 4 (3.4); P. aeruginosa, 3 (2.6); Other, 6 (5.2). Row 10: Specimen type of CLAR alert isolates, n (%): Blood culture, 32 (27.6); Other clinical, 55 (47.4); Screening, 60 (51.7). Row 11: Antibiotic resistance of CLAR alert isolates (MDRO), n (%): MRSA, 6 (5.2); ESBL, 14 (12.1); 3GCR, 29 (25.0); CRE, 18 (15.5); VRE, 16 (13.8); No MDRO, 61 (52.6.
1, 3, 4: Proportions do not sum to 100%, because one CLAR alert can be generated by multiple algorithms (1), can contain isolates from different specimen types (2) and with different antibiotic resistance patterns (4). These variables were analyzed separately for each category, as categories were not mutually exclusive.
2: Reasons for “No” for this variable were constellations where genotyping reports were available for isolates not contained in the first alert of an alert series, but from secondary alerts.
Abbreviations: 3GCR - Third-generation cephalosporine-resistant, CI - Confidence interval, CLAR- CLuster AleRt system, CRE - Carbapenem-resistant Enterobacterales, CuSums - Cumulative sums, EARS - Early aberration reporting system, ESBL - Extended-spectrum beta-lactamase, IQR - Interquartile range, MDRO - Multidrug-resistant organism, MRSA - Methicillin-resistant Staphylococcus aureus, VRE - Vancomycin-resistant Enterococci.
The number of triggering algorithms per CLAR alert was variable across the data set. In 108 alerts (93.1%), thresholds of two confidence interval algorithms (CI-Poisson, CI-Score) were exceeded, while thresholds of Farrington algorithm were exceeded in only 35 cases (30.2%). As per the definitions provided above, of the included 116 alerts, 50 (43.1%) were single alerts and 66 (56.9%) were part of an alert series. The majority of alerts was generated by intensive care units (n = 64, 55.2%) and neonatal wards (n = 32, 27.6%). The five most frequent microorganisms causing alerts were K. pneumoniae (25.9%), E. faecium (18.1%), S. aureus (13.8%), S. marcescens (12.1%) and K. oxytoca (6.9%). Alerts contained isolates that were detected in screening (51.7%), blood (27.6%) and/or other clinical specimen types (47.4%), and with a relevant antimicrobial resistance phenotype in 47.4% (3GCR: 25.0%, carbapenem-resistant Enterobacterales (CRE): 15.5%, vancomycin-resistant Enterococci: 13.8%, extended-spectrum beta-lactamase: 12.1%, methicillin-resistant Staphylococcus aureus: 5.2%). Percentages of CLAR alerts with specimen types and antimicrobial resistance phenotypes do not sum to 100%, as these characteristics could differ between isolates within the same CLAR alert. The epidemiological graphs of selected CLAR alerts are provided in the supplementary material.
Genotyping was performed by WGS in 77 reports (66.4%) and rep-PCR in 39 reports (33.6%). In total, the reports contained 508 patient isolates, of which 253 isolates (49.8%) were from the assessed CLAR alerts. In 87 of 116 CLAR alerts (75.0%), at least one isolate belonged to a genomic cluster (G+ CLAR alert, Table 2); at the isolate level, 171 of all 253 genotyped CLAR alert isolates showed genetic clustering (67.6%). In eight of the CLAR alerts (6.9%), isolates were grouped into multiple genomic clusters. In 29 of 116 CLAR alerts (25.0%), none of the isolates showed genetic concordance with other isolates (G- CLAR alert).
Comparing the 87 G+ CLAR alerts to 29 G- CLAR alerts, we detected some differences with respect to the alert characteristics and the genotyping results. In a larger proportion of G+ CLAR alerts, thresholds of CI-Poisson and CI-Score were exceeded (96.6% vs 82.8%, P = .023). Also, G+ CLAR alerts were more likely the original alert of an alert series or a single alert compared to G- CLAR alerts (72.4% vs 51.7%, P = .040). Non-significant differences between the two groups of CLAR alerts with regard to the causing microorganisms were found primarily for K. pneumoniae (G+ 29.9% vs G- 13.8%, P = .140) and E. faecium (G+ 14.9% vs G- 27.6%, P = .163). In G+ CLAR alerts compared to G- CLAR alerts, isolates were more often from screening materials (59.8% vs 27.6%, P = .005) and had a higher proportion of CRE (19.5% vs 3.4%, P = .041). No differences were found for the size of the CLAR alerts, i.e. the number of affected patients. The frequency of combinations per ward type and specimen type for G+ and G- CLAR alerts is depicted in Figure 3A. It demonstrates that the majority of G+ CLAR alerts was found in the neonatology involving screening isolates (n = 18) and on the ICU involving other clinical isolates (n = 17). Figure 3B shows combinations of alerting algorithms with a majority of G+ CLAR alerts being generated by CI algorithms and EARS (n = 27).
UpSet plots showing the distribution and overlap of CLAR alert characteristics including ward type and specimen type (A), or alerting algorithms (B) the horizontal bars indicate the number of alerts per category (set size), while the vertical bars represent the number of alerts per intersection (intersection size). The intersection matrix below displays the combination of CLAR alert characteristics present in each intersection, with filled dots indicating included characteristics. Lines connecting dots indicate combinations of multiple characteristics. CI, confidence interval algorithm; CLAR, CLuster AleRt system; EARS, early aberration reporting system; ICU, intensive care unit; POI, poisson.

Figure 3. Long description
Panel A: An UpSet plot displays the distribution and overlap of CLAR alert characteristics including ward type and specimen type. The horizontal bars indicate the number of alerts per category (set size), while the vertical bars represent the number of alerts per intersection (intersection size). The intersection matrix below shows the combination of CLAR alert characteristics present in each intersection, with filled dots indicating included characteristics. Lines connecting dots indicate combinations of multiple characteristics. Panel B: Another UpSet plot shows the distribution and overlap of alerting algorithms. The horizontal bars indicate the number of alerts per category (set size), while the vertical bars represent the number of alerts per intersection (intersection size). The intersection matrix below displays the combination of CLAR alert characteristics present in each intersection, with filled dots indicating included characteristics. Lines connecting dots indicate combinations of multiple characteristics.
Alert characteristics associated with concordance between epidemiological relevance and genotypic clustering
We further investigated the differences between G+ and G- CLAR alerts by conducting multivariable logistic regression analyses with a stepwise backward selection. Parameters of the final model independently associated with genotypic clustering were alerts containing CRE isolates (OR: 11.08, 95%-CI: 1.37−89.87) and pertaining to the neonatology department (OR: 10.13, 95%-CI: 2.19−46.91). Variables removed during the selection process based on P > .05 were screening isolates, single alert or original alert of alert series, number of algorithms, K. pneumoniae and E. faecium.
Discussion
In 75.0% of the epidemiological clusters detected by CLAR, at least one isolate of the first CLAR alert belonged to a genomic cluster in the initial genotyping report. This finding corroborates our previous results that CLAR is capable of identifying relevant clusters Reference Schroder, Pena Diaz and Rohde4 and further suggests a moderate to high positive predictive value of expert assessment for identifying probable transmissions. The proportion of G+ CLAR alerts was especially high in the neonatology department (93.8%). This may be explained by the implementation of routine screening protocols in neonatology, usually performed at least weekly, which provide a more comprehensive and stable representation of the microorganism-specific endemic level. As a result, deviations from routine epidemiological patterns identified by CLAR and deemed relevant by experts are more likely to reflect true aberrations rather than stochastic variation, and thus more frequently correspond to underlying transmission events.
With regard to the type and number of algorithms, the highest proportions of G+ CLAR alerts were found for alerts triggered by three to four algorithms. Overall, the results indicate that, in the hospital setting, the use of multiple complementary algorithms may be advantageous for capturing different outbreak patterns, although some algorithms may perform better than others.
The predominance of screening samples in G+ CLAR alerts compared to isolates from blood culture or other clinical specimen types may indicate that screening isolates are more likely to be selected for genotyping in situations where there is already a high likelihood of transmission, whereas blood culture isolates may be genotyped also due to their clinical relevance rather than a strong suspicion of transmission. This underscores the necessity to also consider screening material in outbreak investigations.
While the most frequently represented microorganisms in genotyping reports for epidemiological clusters detected by CLAR were K. pneumoniae and E. faecium, the proportion of G+ CLAR alerts of these two microorganisms revealed a substantial difference (86.7% vs 38.2%). These findings align with previous research, such as the study by Weber et al., indicating a higher likelihood of transmission for 3GCR K. pneumoniae isolates detected by CLAR than for 3GCR E. coli. Reference Weber, Neffe and Diaz19
The majority of G+ CLAR alerts did not involve MDRO. This correlation further emphasizes the importance of incorporating non-MDROs in AODS, while the scope of manual or genomic systems is often limited to MDROs. Reference Mellmann, Bletz and Boking1,Reference Sobkowiak, Schwierzeck and van Almsick20 However, among relevant CLAR alerts involving CRE, 17 of 18 alerts contained at least one isolate belonging to a genomic cluster.
Results of the multivariable regression analysis confirmed a higher likelihood of concordance between expert assessment and genotypic clustering in case of alerts with CRE or originating from neonatology. However, generalisability of the model is limited, because it focuses on the onset of new clusters. It is important to emphasize that the model does not identify factors associated with outbreak occurrence itself. Rather, it assesses which characteristics of alerts that have already been classified as epidemiologically relevant are associated with a higher likelihood of genotypic confirmation. Nevertheless, when derived from local epidemiological data and expert assessments, such analyses may facilitate interpretation of ML models predicting relevance by providing insight into the circumstances under which epidemiological and genomic evidence are most likely to align.
Although the first studies on automated outbreak detection using statistical surveillance methods were published in the 1980s, Reference Schifman and Palmer8,Reference Childress and Childress9 more recent studies continue to investigate such approaches in hospital settings, albeit with different methodologies. Reference Baker, Septimus and Kleinman21,Reference Wolf, Barth-Jakschic, Bader, Peter and Liese22 None of them comprehensively incorporated both genomic information and epidemiological expert assessment. Other approaches have taken the opposite perspective, using routine sequencing as the starting point and subsequently reconstructing epidemiological links through temporal associations and patient movement. Reference Sundermann, Kumar and Griffith2,Reference Sobkowiak, Schwierzeck and van Almsick20 While these frameworks provide high-resolution insights into transmission pathways, they are inherently resource-intensive and may not be feasible outside large tertiary care centers, indicating the need to reduce the reliance on WGS. Reference Liu, Chen and Sundermann23 Also, genotyping results are easier to interpret when an epidemiological link has already been established, as cluster assignment in sequencing-based analyses depends on predefined cut-offs and is therefore influenced by the chosen methodology. Reference Maechler, Weber and Schwengers24
While recent economic evaluations have suggested that continuous genomic surveillance may be a cost-effective strategy compared with outbreak-triggered sequencing by enabling earlier detection of transmission events, Reference Egli and Howden25 our findings support a targeted alternative, in which AODS are used to prioritize isolates with the highest likelihood of representing epidemiologically relevant events. The CLAR system, combined with expert epidemiological assessment, enables the identification and prioritization of potentially relevant clusters among routine microbiological findings before sequencing resources are allocated. Such a workflow may provide a pragmatic balance between comprehensive surveillance and resource efficiency by focusing genomic investigations on signals most likely to represent true transmission events.
Several limitations must be acknowledged when interpreting the findings of this study. First, as alert assessment depended on the evaluating IPC expert, inter-individual variability may have influenced which alerts were classified as relevant and therefore included in the analysis. Second, a substantial proportion of genotyping results from the early study period were based on rep-PCR, which has lower discriminatory resolution compared to WGS. This may have led to misclassification of genomic relatedness and thus affected the assessment of transmission. Third, isolates of CLAR alerts deemed not relevant were not routinely sequenced, which limits our ability to assess false negatives. In addition, a non-negligible number of CLAR alert isolates could not undergo genotyping because they were not retained. Fourth, to emulate early outbreak conditions, we disregarded follow-up alerts and genomic reports, which, if included, might have altered results. Fifth, the likelihood of observing genomic clustering may also vary between pathogens depending on their underlying population structure and genomic diversity, which we could not investigate, because our study was based on selectively genotyped isolates from CLAR alerts rather than systematic sampling of the hospitalwide pathogen population. Finally, we only assessed alerts from routinely implemented rules including the microorganisms mentioned in the methods, or from blood cultures. Thus, clusters of unusual pathogens, especially if not recovered from blood cultures, were not investigated, limiting the generalizability of our results.
Together, our findings suggest that epidemiological context complements genomic surveillance and may help prioritize isolates for targeted sequencing. Future ML models could learn to incorporate this information to support outbreak detection and cluster prioritization. However, expert contextualization will remain essential, as neither epidemiological nor genomic data alone fully capture the complexity of transmission dynamics in clinical settings. ML-based systems could therefore help allocate limited resources, particularly healthcare staff and sequencing capacity.
Supplementary material
The supplementary material for this article can be found at https://doi.org/10.1017/ice.2026.10569
Data availability statement
Not applicable, because all data were collected within the context of the surveillance of healthcare-associated infections conducted in accordance with the German Protection against Infection Act.
Acknowledgements
Dr. Rüther is participant in the Berlin Institute of Health (BIH) Charité Digital Clinician Scientist Program funded by the Charité – University Medical Center Berlin, and the Berlin Institute of Health at Charité.
Author contributions
F.D.R. formulated the research questions with the input of S.J.S.A., S.S., M.B., and L.A.P.D. provided the necessary programing and performed data extraction. F.D.R., M.P., S.J., and N.B. collected the data. F.D.R. was responsible for data analysis and composed the manuscript with the input of all co-authors.
Financial support
None reported.
Competing interests
The authors declare that they have no competing interests.
Ethical statement
The study was approved by the Charité University Medical Center Institutional Review Board (process number: EA2/180/25). Informed consent was not needed for this retrospective analysis of routinely collected data within the context of the surveillance of healthcare-associated infections conducted in accordance with the German Protection against Infection Act.
Use of artificial intelligence tools
OpenAI’s ChatGPT was employed as a drafting tool to assist with refining the language, coherence, and structure of this manuscript. All scientific content, analyses, and conclusions were exclusively the responsibility of the authors.




 Open access

