Introduction
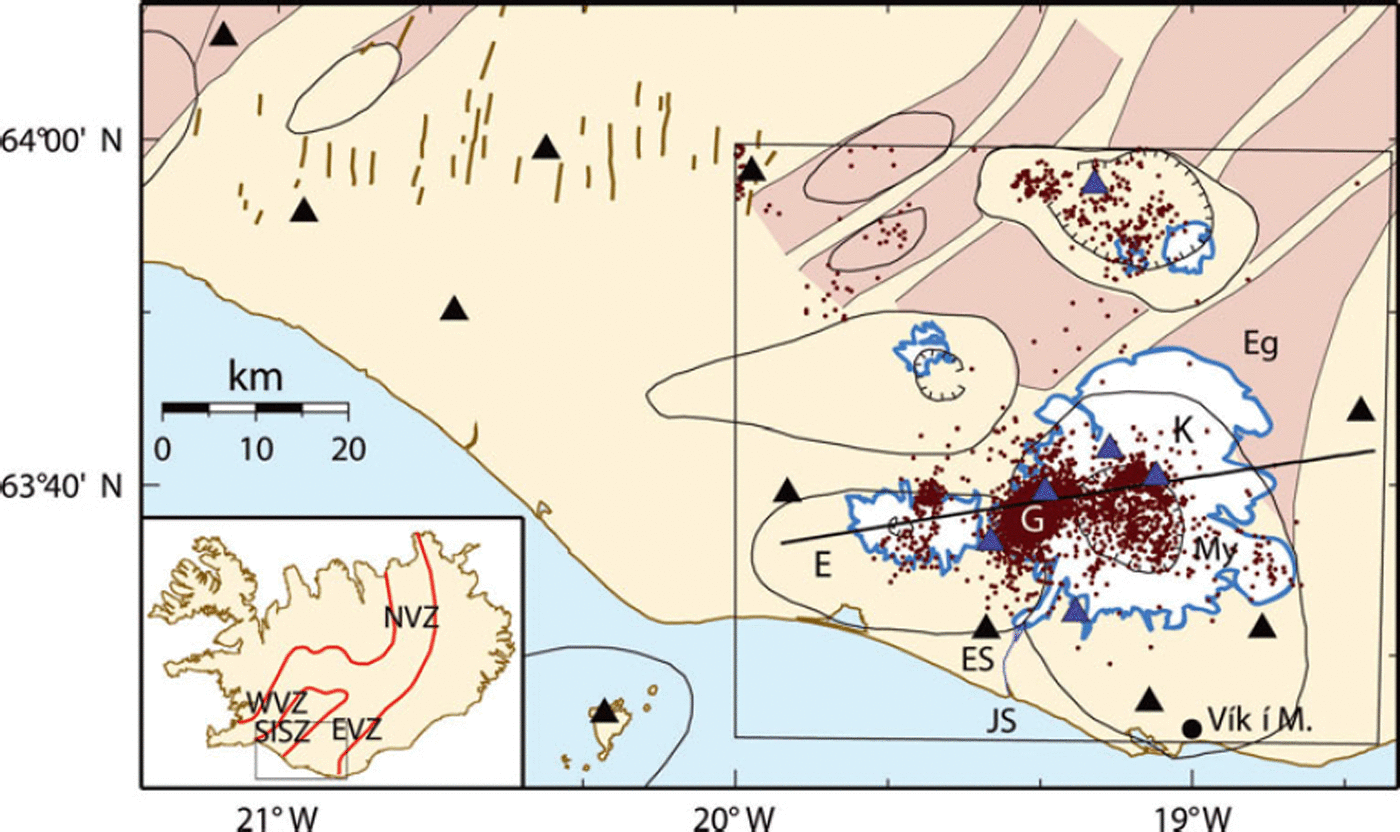
The Katla volcano in south Iceland, overlain by the Mýrdalsjökull glacier, is situated in the eastern volcanic zone, south of the rift-transform intersection with the South Iceland seismic zone (Fig. 1). The plate spreading rates decrease from north to south in the volcanic zone and are measured to be 8 mma–1 northwest of Mýrdalsjökull with a spreading axis aligned in a northeast–southwest direction (Reference LaFemina, Dixon, Malservisi, Ánadóttir, Sturkell and SigmundssonLaFemina and others, 2005). Its smaller and older neighbour, Eyjafjallajökull, also a glacier-covered volcano, rises just west of it and appears to be tectonically connected to Katla (Reference Einarsson and BrandsdóttirEinarsson and Brandsdóttir, 2000). The Katla volcanic system consists of the 1400m high central volcano and is structurally connected to the 60 km long Eldgjá fissure, which extends from the northeast part of the central volcano in the direction of the eastern volcanic zone (Reference LarsenLarsen, 2000). Katla is one of the most active and hazardous volcanoes in Iceland, with at least 20 phreatomagmatic eruptions and jökulhlaups since 900AD, the last occurring in 1918. During the Holocene, Katla has had three types of eruptions: basaltic explosive eruptions inside the caldera (most frequent), silicic explosive eruptions and large effusive basaltic fissure eruptions producing volumes of the order 10 km3 (Reference LarsenLarsen, 2000).
Map of the Katla volcano (K) under the Mýrdalsjökull glacier (My) and the Eyjafjallajökull volcano (E) to the west. The Katla fissure swarm, including the Eldgjá fissure (Eg), stretches from the centre of the volcano to the northeast. Earthquakes (purple dots) from 1999 to 2006 are plotted. They occur within the caldera and under the Goðabunga bulge (G). Black triangles represent SIL stations and blue triangles mark temporary seismic stations. The locations of the Jökulsá á Sólheimasandi river (JS), the seismic station at Eystri Skógar (ES) and the weather station in Vík í Mýrdal (black dot) are marked. Central volcanoes are outlined (oval black lines), fissure swarms are shaded brown (from Reference Einarsson, Sæmundsson and SigfússonEinarsson and Sæmundsson, 1987) and caldera rims are indicated by hatched lines (from Reference Jóhannesson, Jakobsson and SæmundssonJóhannesson and others, 1990). The white areas are glaciers. The approximate locations of the South Iceland seismic zone (SISZ) faults are marked with thick brown lines. The prominent rectangle defines the tomographic study area of this paper and it encloses the tomography profile used in later figures, depicted by a thick black line. The smaller inset shows the locations of the northern (NVZ), eastern (EVZ) and western (WVZ) volcanic zones.

Radio-echo soundings have revealed an oval (9×14 km), 600m deep caldera with a northwest–southeast major axis (Reference Björnsson, Pálsson and GuðmundssonBjörnsson and others, 2000). Based on data from a 2D seismic profile over the Katla volcano, Reference Guðmundsson, Brandsdóttir, Menke and SigvaldasonGuðmundsson and others (1994) interpreted a shallow low-velocity anomaly beneath the caldera as a magma chamber, 5 km wide, with a bottom at 3 km below the ice surface. Aeromagnetic measurements by Reference Jónsson and KristjánssonJónsson and Kristjánsson (2000) revealed a negative magnetic anomaly inside the caldera, which they interpreted as being related to a thermal anomaly or the presence of advanced geothermal alteration.
Seventeen surface depressions (cauldrons) are known in Mýrdalsjökull glacier. They are thought to be caused by subglacial geothermal melting and involve water concentrations beneath the ice sheet (Reference Björnsson, Pálsson and GuðmundssonBjörnsson and others, 2000). Most of the cauldrons are situated above the caldera rim and a few are within the caldera. This is consistent with many volcanoes having geothermal activity within their calderas and on their rims, coinciding with major ring-like faults and dykes (Reference Goff, Janik and SigurdssonGoff and Janik, 2000).
The volcanic history of Katla has been extensively studied (e.g. Reference LarsenLarsen, 2000; Reference Larsen, Newton, Dugmore and VilmundardóttirLarsen and others, 2001; Reference Sigmarsson, Óladóttir, Larsen and ThordarsonSigmarsson and others, 2005) and although these studies indirectly shed light on the magma-plumbing system, the inner structure of the volcano is not well known. Reference Sigmarsson, Óladóttir, Larsen and ThordarsonSigmarsson and others (2005) reported a pattern from a compositional study of tephra layers from Katla, which they divided into three types, each with a different plumbing system behaviour: (1) with simple plumbing (i.e. without a shallow magma chamber); (2) with a dyke and sill complex; and (3) with a closed-system magma chamber. Their interpretation suggests that Katla is now in a period of a simple plumbing system with a relatively low eruption frequency and the absence of a shallow magma chamber. This, however, does not agree with the seismic refraction interpretation of Reference Guðmundsson, Brandsdóttir, Menke and SigvaldasonGuðmundsson and others (1994).
Rifting across Katla is thought to be insignificant today (Reference LaFemina, Dixon, Malservisi, Ánadóttir, Sturkell and SigmundssonLaFemina and others, 2005) although the elongated shape of the caldera is distinct, with its longest axis in the direction of plate spreading. The age of the Katla volcano is estimated to be 220 kyr (Reference GuðmundssonGuðmundsson, 2001). If we hypothesize that the elongation of the caldera is simply due to rifting we get a very high minimal rifting rate of 23 mma–1 (by assuming the caldera has the same age as the volcano). Reference GuðmundssonGuðmundsson (2001) estimated the age of the caldera to be 75 kyr, but this would probably mean that the oval shape has to be explained by something other than a rifting process. It is unlikely that a magma chamber would be elongated in the spreading direction but would rather be parallel to the direction of the volcanic zone.
A period of unrest began in 1999 when a sudden jökulhlaup occurred on July in the river Jökulsá á Sólheimasandi in southwest Mýrdalsjökull. The flood was followed by a burst of seismic tremors, increased geothermal activity and the formation of a cauldron (Reference Guðmundsson, Högnadóttir, Kristinsson and GuðbjörnssonGuðmundsson and others, 2007). Geodetic observations at Katla between 1993 and 2000 indicate a total uplift of 12 cm. Between 2000 and 2003, 6 cm uplift is attributed to an inflation period occurring at a few kilometres depth within the caldera (Reference Sturkell, Sigmundsson and EinarssonSturkell and others, 2003). The seismicity also increased during this 3 year period, but the GPS measurements of the inflation centre do not coincide with the seismic hypocentres. Reference Soosalu, Jónsdóttir and EinarssonSoosalu and others (2006) interpreted the consistent activity of low-frequency earthquakes at Goðabunga as indications of an intruding cryptodome. To support their suggestion, they presented examples of earlier dome-forming activity around the Katla caldera and examples of cryptodomes that have been shown to have very limited deformation fields.
It is evident that significant questions about the structure and mechanisms of the glacier-overlain Katla volcano remain to be answered. In this paper we will address the question regarding annual variations in the seismicity by modelling annual changes in ice thickness and investigating various correlations. The structure of the volcano is also investigated by performing a 3D local earthquake tomography inversion.
Seismicity
The Katla volcano has been monitored by seismometers since the beginning of seismic monitoring in Iceland (Reference TryggvasonTryggvason, 1973). In 1989 the South Iceland Lowland (SIL) seismic network started recording earthquakes in southwest Iceland (Reference Böðvarsson, Rögnvaldsson, Slunga and KjartanssonBöðvarsson and others, 1999). In November 1993 three stations were in operation: west of Eyjafjallajökull and east and south of Mýrdalsjökull. A fourth station was added in October 2001, southwest of Mýrdalsjökull, which has significantly improved earthquake detection in the Katla volcano. The seismicity shows peculiar behaviour in many aspects as do the waveform recordings. Since 1991, the earthquakes are mainly observed to occur in two distinct areas: within and around the oval caldera, and in the region of Goðabunga. The Goðabunga activity occurs in swarms and forms a cluster with an epicentral area well restricted within 10km2. The seismicity shows a clear seasonal variation, i.e. the number of events increases towards the autumn, usually with October being the most active month, and decreases during the winter. Events occurring outside the Goðabunga cluster are less common. They show a weaker component of seasonality and their epicentres are more scattered. The regions discussed are the whole area of the Mýrdalsjökull glacier overlying Katla volcano, the area within the oval caldera and the area of the epicentre cluster in the southwest flank of the volcano. These will be referred to as the Katla volcano, the Katla caldera and Goðabunga, respectively.
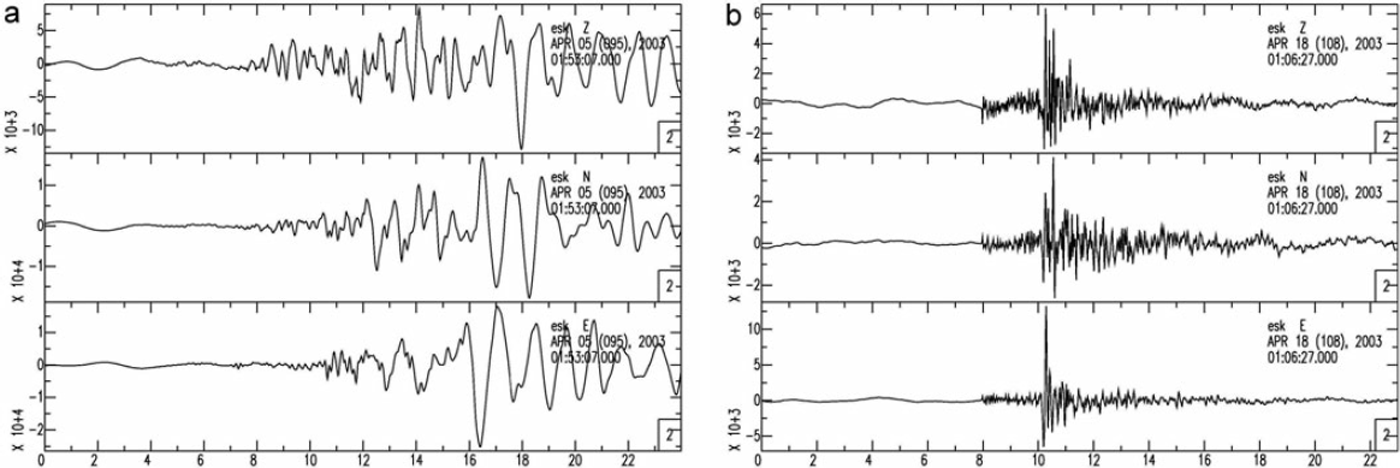
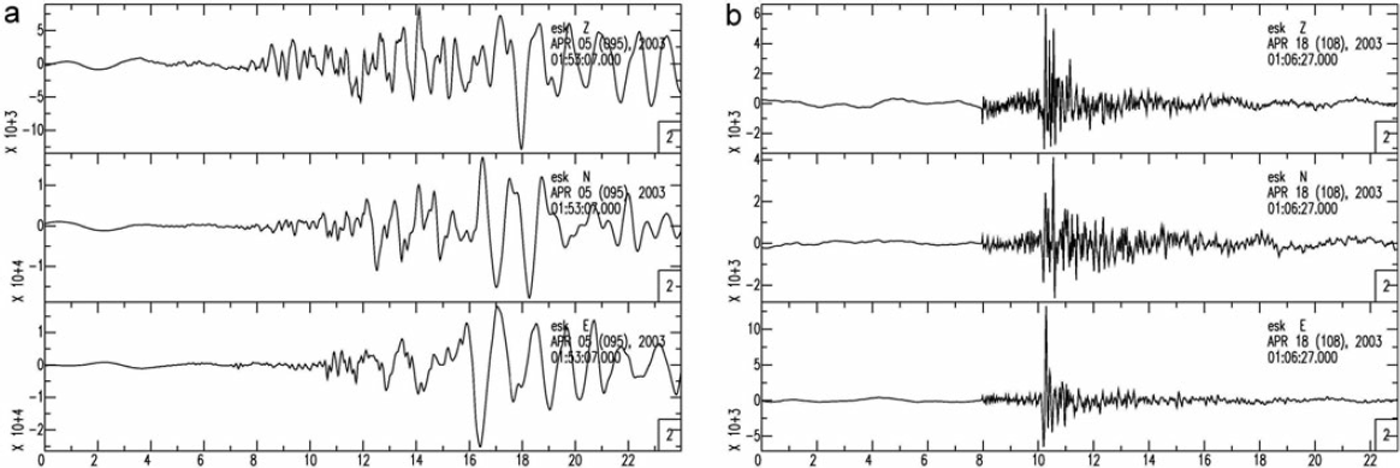
The earthquakes belonging to the Goðabunga cluster show unusual waveforms (Fig. 2). The P-wave is emergent and the signal is complex with an unusually long low-frequency (0.5–3 Hz) wave train. The emergent arrival of the P-waves and the complex low-frequency coda make routine analysis by the Icelandic Meteorological office difficult, including the estimation of source depths. The event detection of the SIL network has been adjusted to the emergent onset. The physical origin of these events is not well understood. Possible explanations include: ice motion; magma, fluid or gas movements; and slow slip movements in the hot volcanic environment. Low-frequency events also occur outside the Goðabunga cluster and similar events are even observed at other glaciated volcanic areas in Iceland. Volcano-tectonic events, with clear phases and high frequencies, are only detected outside Goðabunga. These have much better hypocentral locations and are in general located at greater depths than the Goðabunga events (Fig. 2).
Two examples of waveforms recorded at Eystri Skógar (ES) southwest of Mýrdalsjökull (Fig.1). Seconds are displayed on the x axis and the amplitude scale is arbitrary. All three components are shown, from top: vertical, north and east. (a) A typical low-frequency event with an epicentral location at Goðabunga. (b) A typical volcano-tectonic event from the Katla caldera.
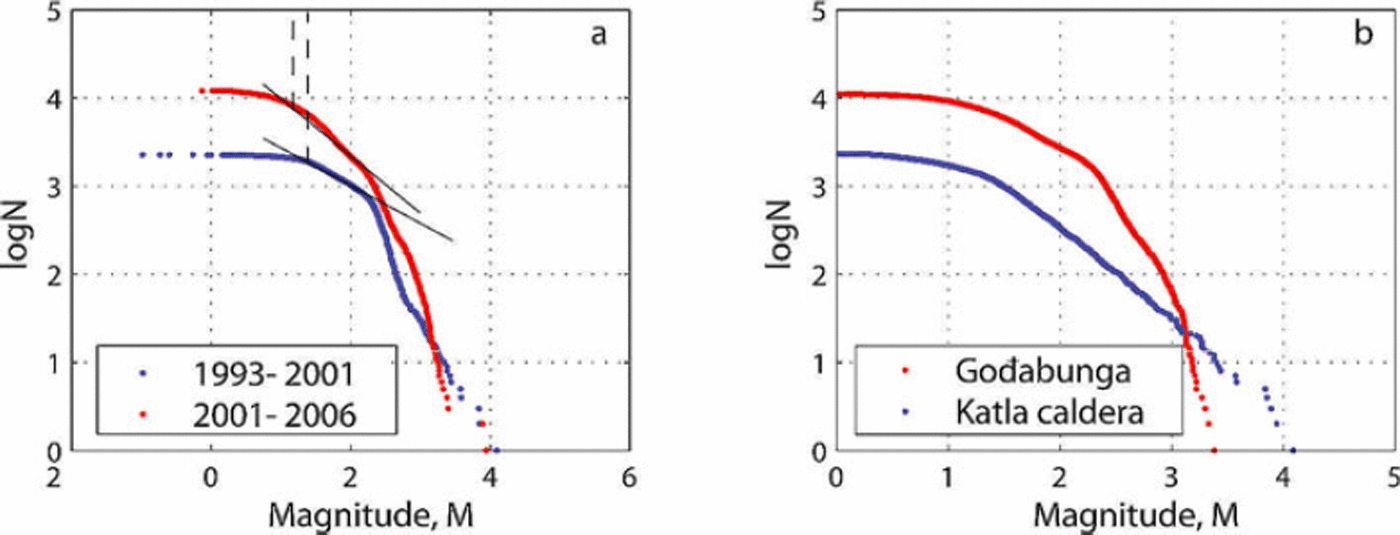
The magnitude distribution of the Goðabunga events does not seem to follow the empirical relation known as the Gutenberg-Richter law, which describes the correlation between the magnitude M of earthquakes and their relative numbers N, logN = a - bM, where a and b are constants. Normally, when plotted in a logN vs M graph, a constant gradient of b ∽ 1 is observed for magnitudes >M c, sometimes referred to as the magnitude of completeness. This indicates at which magnitude the dataset is complete (see Reference Wyss and StefánssonWyss and Stefánsson, 2006, for a recent study in southwest Iceland completeness magnitudes and b-values for the SIL catalogue).
From November 1993 until October 2001, the SIL catalogue is complete down to magnitude M c = 1.7±0.2 in the Katla volcano. From that time until March 2006, it is complete to M c = 1.5±0.2 (Fig. 3). Interestingly, the events occurring within the Goðabunga cluster seem to have an upper limit of the event size at magnitude M = 3.5. It follows that the b-value plot for this dataset does not show a straight line, but rather a soft bulge with no apparent sudden changes (Fig. 3). The dataset from within the Katla caldera shows a straight line and a b-value close to 1. It is thus not surprising that when a dataset including both areas is used to plot the frequency–magnitude distribution we get (at least) two slopes in the b-value graph representing the two populations.
(a) The b-value for the Katla volcano for two time periods having different magnitude of completeness M c. The dataset from November 1993 to October 2001 (blue) has M c = 1.7 and from October 2001 to February 2006 (red) has M c = 1.5. The sloping straight lines mark the region of constant b-value and the vertical lines M c. (b) The b-value plots for the two seismically active regions in the Katla volcano, in Goðabunga (red) and within the caldera (blue).

In the SIL network, local magnitudes are estimated based on the scalar seismic moment. The scalar seismic moment is calculated for every event, as a part of the routine analysis at the Icelandic Meteorological office. While this method works well for tectonic events, it may underestimate the low frequencies of the Goðabunga events, leading to an underestimation of the magnitude.
Another peculiarity in the statistics of the dataset is observed when the time distribution is studied. The seismic activity at Goðabunga appears to consist only of mainshocks. This can be demonstrated with the waiting time, sometimes referred to as delay time, recurrence time, or inter-event time, which is defined as the time between any two successive events (Reference Lindman, Jónsdóttir, Roberts, Lund and BödvarssonLindman and others, 2005, Reference Lindman, Jónsdóttir, Roberts, Lund and Böðvarsson2006; Reference Jónsdóttir, Lindman, Roberts, Lund and BöðvarssonJónsdóttir and others, 2006). A common null hypothesis for a waiting time distribution is that it consists of mainshock occurrences, described by the homogeneous Poisson model, and aftershock sequences following the modified Omori law:
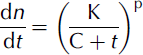
where n is the number of events (aftershocks) following the main shock, K, C and p are empirical constants and t is the time since the main shock (Reference UtsuUtsu, 1961). Since aftershocks are far more common than main shocks in tectonic regions, the corresponding waiting time distribution can usually be well described with the Omori law alone (Reference Jónsdóttir, Lindman, Roberts, Lund and BöðvarssonJónsdóttir and others, 2006). The Goðabunga dataset, however, shows quite different behaviour, with the waiting time distribution for the years 2002 and 2003 resembling a homogeneous Poissonian probability distribution, i.e. that of a random series of constant rate (Reference Jónsdóttir, Lindman, Roberts, Lund and BöðvarssonJónsdóttir and others, 2006). This observation suggests that the process responsible for the Goðabunga cluster is not a typical diffusion process as often seen in tectonic environments (e.g. Reference Lindman, Jónsdóttir, Roberts, Lund and BöðvarssonLindman and others, 2006).
Seasonal Earthquake Activity
The seasonality of the earthquake occurrences was first reported by Reference TryggvasonTryggvason (1973) for the period 1952–58 and confirmed by Reference Einarsson and BrandsdóttirEinarsson and Brandsdóttir (2000). The number of events usually increases at the beginning of summer and reaches its maximum in the autumn, when it begins to decrease again. Seasonal behaviour of this kind is most likely a consequence of changes in the hydraulic system, i.e. the hydraulic cycle of the glacier and the related stress variations.
To examine the actual unloading of the glacier over the summer as a potential factor for increasing the seismic activity, we calculated the ice load changes from November 1993 to February 2006 using a method described by Reference Sigurðsson and JónssonSigurðsson and Jónsson (1995). The glacier mass-balance model is based on temperature and precipitation data and will be referred to as the snow budget model. The snow budget model, describing changes in the volume of the ice sheet, is derived from monthly precipitation and temperature records provided by the Icelandic Meteorological office from a nearby weather station (Vík í Mýrdal). The ice topography of Mýrdalsjökull was adapted from Reference Björnsson, Pálsson and GuðmundssonBjörnsson and others (2000). Obviously, local climatic conditions will be different on the high glacier and at the coast but such models have been shown to predict measured mass balance with a fair degree of accuracy.
To quantify the annual coherency, we calculated the cross-correlation coefficient between the result from the snow budget model and the number of earthquakes recorded in Goðabunga and within the caldera. In order to focus on the annual variations, the strong long-term trends in the data were removed prior to the correlation analyses presented in Figures 4e and 4f by subtraction of a 1 year running average. All of the data are clearly internally correlated in time (i.e. the series show cyclical behaviour) and the earthquake data are non-stationary in a statistical sense (i.e. the rate varies dramatically over time). Cross-correlation of such data may be misleading as results may be dominated by limited periods of large activity. Therefore, before correlation analysis the data series were amplitude-normalized using a 1 year running window and inverted in order to show the annual coherency with the snow budget more clearly. These data are presented in Figures 4b and 4c. The inversion means that the calculated coherence close to zero lag is positive, even though the raw earthquake data are in anti-phase to the snow budget data.
(a) Monthly number of events from Goðabunga (red) and from within the Katla caldera (blue) plotted against time, from November 1993 to February 2006. (b) Snow budget model (red) plotted with the inverse of a filtered version of the Goðabunga seismicity (blue), from November 1993 to February 2006. (c) Snow budget model (red) plotted with an inverse filtered version of the Katla caldera seismicity (blue), from November 1993 to February 2006. Y-axis scale in (b) and (c) is arbitrary. (d) Normalized cross-correlation between the Goðabunga seismicity and the Katla caldera seismicity (monthly number of events). (e) Normalized cross-correlation between the snow budget model and a filtered version of the Goðabunga seismicity (b). (f) Normalized cross-correlation between the snow budget model and a filtered version of the Katla caldera seismicity (c).

The time series so produced clearly show a strong correlation with the snow budget model, especially the Goðabunga data (normalized cross-correlation or coherence R ∽ 0:8) (see Figs 4e and 4f). The internal correlation of the data and our data normalization procedure mean that this coefficient together with the number of data cannot be directly converted to a confidence level using standard methods. However, we can note that if the earthquake data were a random series, then for our procedure the expectation of coherence at the 99% level is well below 0.2, i.e. much smaller than the observed peak values. A time lag of 0.9 months is observed between Goðabunga seismicity and the snow budget (Fig. 4e), consistent with the visual observation that the Goðabunga seismicity has a maximum in October and the snow budget a minimum in September.
When the Katla caldera data are cross-correlated with the snow budget model, the correlation coefficient is 0.4 and the observed lag –1.6 months, which means that the caldera seismicity has an annual maximum in July/August (Figs 4c and 4f). Also shown in Figures 4a and 4d are the raw earthquake data series from Goðabunga and the Katla caldera and their corresponding coherence. As these data are consistent in character, the data presented here are not de-trended nor amplitude normalized. Again, a very high correlation coefficient (0.85) is observed at a time lag of 2.4 months. This lag, which can also be clearly seen in the time series (Fig. 4a), is consistent with the combined lags from Figures 4e and 4f, implying that the de-trending and amplitude normalization procedures do not bias the results.
Reference Einarsson and BrandsdóttirEinarsson and Brandsdóttir (2000) proposed that the annual cycle of the seismicity can be explained by the combined triggering effects of reduced ice load after the summertime melting and elevated pore-fluid pressure in the underlying crust while the continuous stress load of plate movements maintains the seismicity. They pointed out that changes in pore-fluid pressure are significant compared to the ice load reduction in order to induce seismicity. In our analysis we discuss induced pore-fluid pressure, hydraulic fracturing and changes in glacial load as possible mechanisms for triggering the events.
The water flux in glacier outlet rivers in Iceland usually reaches its maximum in July and August after the summer thaw. A possible mechanism is that the induced pore-fluid pressure is triggering events, decreasing the normal stress to let the shear stress move the fractures, and that the water flux can be directly interpreted to reveal pore pressure changes. We follow Reference Townend and ZobackTownend and Zoback (2000) in order to quantify the characteristic time for a diffusive process. Using permeability values from Reference ArnórssonArnórsson (1995) of 2×10–15, 3×10–14, 1.3×10⁻¹³m2 (typical values for the Icelandic geothermal areas Krafla, Nesjavellir and Svartsengi, respectively) we get a diffusion time of 77 days, 5 days and 1 day, respectively (using porosity of 10%, characteristic length of 1 km and other parameters from Reference Townend and ZobackTownend and Zoback, 2000). These different delay times indicate that it is difficult to draw any conclusions about the diffusion time without detailed permeability and porosity data from the Katla volcano. However, as Katla has high topography and is situated in the rift zone, it seems likely that the uppermost kilometres are highly permeable and thus the time to pore pressure equilibrium should be rapid, at least near the surface.
Hydraulic fracturing, i.e. the opening and propagation of new fractures due to over-pressure, is thought to be responsible for reservoir-induced seismicity and for volcano-tectonic events where the fluid is magma. Studies of reservoir-induced seismicity suggest that it can be explained by a coupled poro-elastic rebound effect, including an instantaneous component and components of diffusive origin (Reference TalwaniTalwani, 1997). In addition, earthquakes caused by hydraulic fracturing, even at volcanoes, are volcano-tectonic, i.e. they produce clear P- and S-phases and have a high-frequency component (Reference Lahr, Chouet, Stephens, Power and PageLahr and others, 1994; Reference Savin, Grasso and BachelerySavin and others, 2005). Moreover, hydraulic fracturing is unlikely in a fractured rock mass and is therefore probably not the responsible mechanism for the annual seismicity at the Katla volcano.
Since the variation in ice load is only of the order of a few metres, the changes in pressure load is only of the order of 10 kPa. According to Reference ScandoneScandone (1996) such a small pressure change will, however, lead to an almost immediate decompression response. The seismicity within the caldera could be explained by an increased pore-fluid pressure after the summer melting, assuming a highly permeable rock. It is, however, more difficult to explain the Goðabunga seismicity.
The Goðabunga seismicity consists of low-frequency events of quite different character when compared to ordinary volcano-tectonic events, without the normal aftershock behaviour. In addition, they occur at shallow depths (0–2 km) beneath a pronounced topography assumed to be heavily fractured. Due to the observed time lag between maximum river discharge and the peak in seismicity, we conclude that events are not caused by hydraulic fracturing due to fluid overpressure, and are unlikely to be induced by pore fluid pressure triggering shear motion. Because of the expected high permeability of the volcano, we find it unlikely that the 2–3 months delay between the maximum discharge and seismicity peak can be explained by triggering due to diffusion of a hydraulic head. Conversely, in the Katla caldera, it is not unlikely that increased pore-fluid pressure after the summer melting is indeed a triggering mechanism for earthquakes.
Another factor that we need to fit to our conceptual model is that the whole glacier-covered area is experiencing annual variations in the glacier. Thus the conditions at Goðabunga have to be different from the rest of the glaciated area in order to trigger such intensive seismicity exclusively within that region. We consider a pressure-sensitive volume beneath Goðabunga. This could be a magma intrusion (as Reference Soosalu, Jónsdóttir and EinarssonSoosalu and others, 2006, suggest), which is sensitive to changes in lithostatic pressure, especially if it contains gas, or a gas reservoir. The magma responds to depressurization by growing gas bubbles, increasing its volume and attempting to re-establish the pressure. Excitation of volcanic low-frequency earthquakes is sometimes attributed to rapid bubble growth in magma (Reference Shimomura, Nishimura and SatoShimomura and others, 2006). However, simulations of gas volume expansion in a reservoir, caused by unloading, indicate that this should occur within seconds to a few hours at the most (Reference Shimomura, Nishimura and SatoShimomura and others, 2006) and thus the mechanism probably cannot explain the delay between the minimum in the snow budget model and the peak in the seismicity rate at Goðabunga.
Simulations demonstrate that pressure recovery from bubble growth can even exceed the initial pressure drop by nearly an order of magnitude (Reference NishimuraNishimura, 2004). The bubble growth would lead to stress changes in the surrounding rock that might induce seismicity, probably with an instantaneous as well as a diffusive time component. However, such a model appears to be inconsistent with the observed time delay between the loading and the seismicity, and induced seismicity of this sort would probably consist of volcano-tectonic earthquakes.
Annual variation is also evident in GPS data from stations on nunataks at Mýrdalsjökull. Reference PinelPinel and others (2007) model the elastic response due to changes in glacial load and compare with GPS data. They get a minimum in vertical load in October while the vertical component on the GPS has a maximum in November/December.
It is apparent that annual variations appear in various types of data but it is non-trivial to make them all agree with one physical model.
Tomography
A common and efficient way of obtaining subsurface information of seismically active regions is by means of local earthquake (LE) tomography. Despite the size and potential hazard of the Katla volcano, there are very few seismic stations in its vicinity (Fig. 1). The present SIL seismic network is able to determine the epicentral parameters of the Katla seismicity fairly well. However, the depth is poorly constrained due to the large distance to the nearest station. In the spring of 2003, four broadband seismometers were installed on Mýrdalsjökull, two on nunataks on the caldera rim and two at the edge of the glacier (described in detail in Reference Soosalu, Jónsdóttir and EinarssonSoosalu and others, 2006). These recorded continuously for several months. We complement the SIL data (5000 events) with these recordings (100 events) in our tomography study. Although the temporary stations are placed close to the activity at Goðabunga, they also show emergent onsets and complex low-frequency coda, making the precise picking of the P- and the S-arrivals for the tomography more difficult than for tectonic earthquakes. The recalculated hypocentral depths for the Goðabunga events were shallower than the depths from the SIL catalogue, which suggests that SIL catalogue depths for other events in this area may be overestimated. Tests were carried out, investigating the possible significance for the inversion. No indications of significant artefacts in the results could be found.
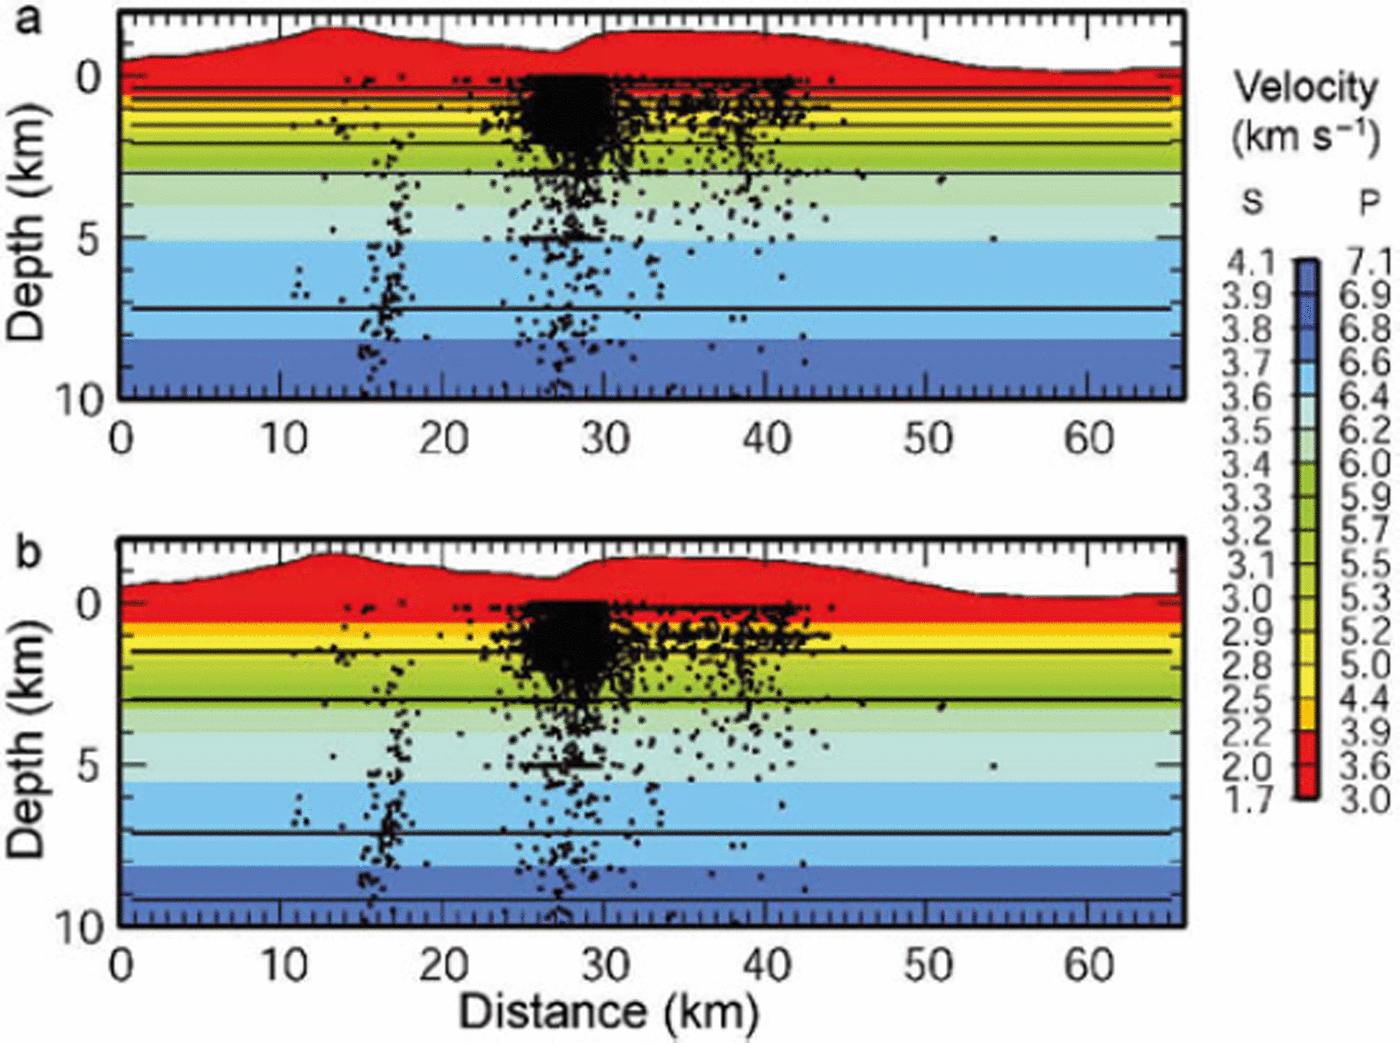
The seismicity located using the SIL seismic network between January 1999 and February 2006 is shown in Figure 1. In total, more than 11 000 events were recorded within the rectangular area shown. A selection of 5100 events was made for a tomographic investigation of the 3D seismic velocity structure. A maximum azimuthal gap of 1808 between the recording stations and a minimum of seven recorded phases was used as event selection criteria. About 22 000 P- and 23 000 S-wave recordings were used with a typical reading uncertainty of 0.001–0.05 s. A cross-section through the selected seismicity is shown in Figure 5, revealing the bulk of the seismicity to be very shallow (within the top 4 km of the crust). This depth distribution agrees with the seismicity relocated by the temporary network above the Goðabunga seismicity. It is evident from Figure 5 that some earthquakes from the catalogue data are locked on 0, 3 and 5 km, presumably when depth could not be reliably determined.
Cross-sections through the 1D (a) P- and (b) S-velocity models, along the profile shown in Figure 1. East is to the right in all figures. The seismicity from the routine locations of the events recorded by the SIL seismic network in a ±3 km corridor across the profile is shown.

We used the PStomo_eq tomography algorithm described in detail in Reference Tryggvason, Rögnvaldsson and FlóvenzTryggvason and others (2002) and in Reference Tryggvason and LindeTryggvason and Linde (2006). PStomo_eq allows for simultaneous inversion for both P- and S-wave velocity structure as well as hypocentral relocation. Regularization to control the degree of model artefacts and ‘wild’ V p /V s ratio variations is by standard Laplacian smoothing constraints, damping of V p /V s ratios and requiring that the cross-gradients of the P- and S-velocity model is everywhere zero. Due to limited control of the hypocentral depths, we demanded smooth velocity models, in order to derive the first order structure beneath the volcanic systems. The starting models are shown in colour coding in Figure 5, which are the same as those used by Reference Tryggvason, Rögnvaldsson and FlóvenzTryggvason and others (2002) and considered the minimum starting models (Reference KisslingKissling, 1988) for southwest Iceland. A uniform V p /V s ratio of 1.78 normal for Iceland (Reference StefánssonStefánsson and others, 1993) was used for the starting models.
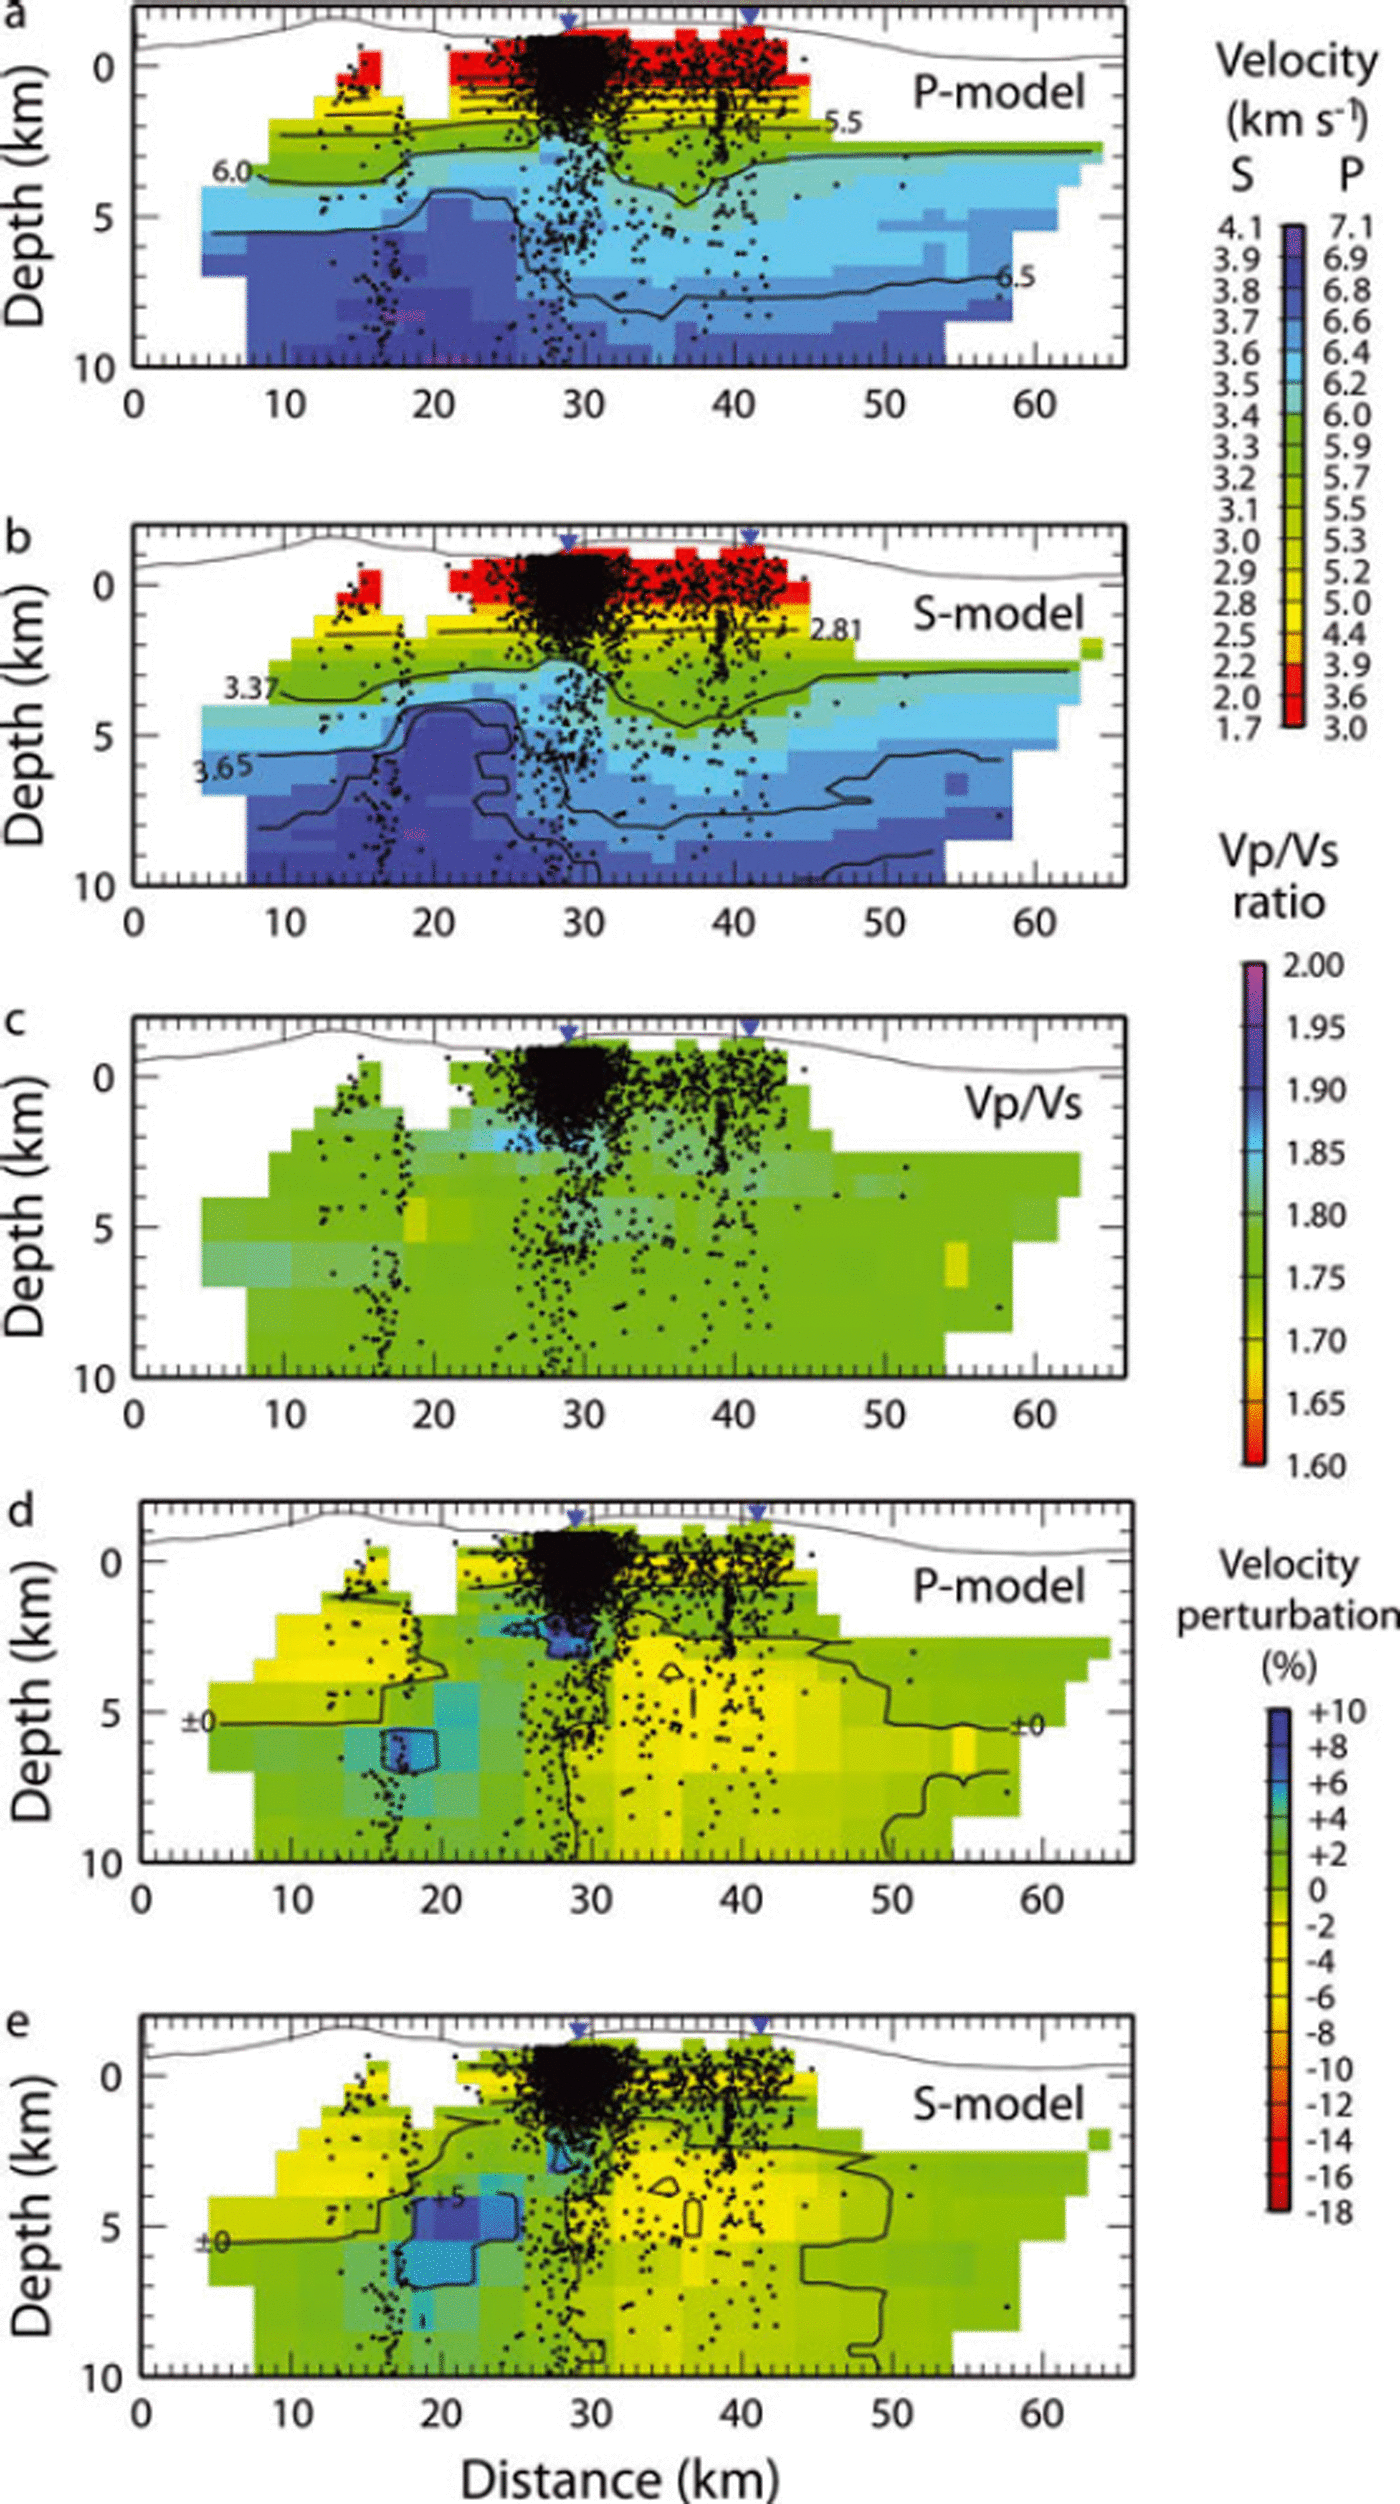
The tomography is performed iteratively, with large values of the smoothness damping used in the earlier iterations and lower values used subsequently. In the first iteration, a damping of the V p /V s ratio is also used. This is replaced in the following iterations with the requirement that the cross-gradients function is zero, implying that the P- and S-wave models should be structurally similar (cf. Reference Tryggvason and LindeTryggvason and Linde, 2006). The root mean square (RMS) data fit reduction for the final models compared to the starting models are 48% and 60% for the P- and S-waves, respectively. Reducing the smoothness damping even further did not improve the data fit, indicating that we have reached the resolution limit for the data and station configuration. Cross-sections through the final 3D models are shown in Figure 6 along with the relocated seismicity. The seismicity beneath Eyjafjallajökull and Mýrdalsjökull is very differently distributed. Beneath Eyjafjallajökull the seismicity prevails along a pipe-like structure from depths of ∽2 kmto >10 km. These earthquakes have been related to an intrusive episode in 1999 at 6 km depth in the southern flank of the Eyjafjallajökull volcano (Reference Pedersen and SigmundssonPedersen and Sigmundsson, 2006). In general, the inversion relocates the seismicity beneath Goðabunga to shallower depths. Beneath the eastern rim of the Katla caldera the relocated seismicity is focused in a vertical structure at a depth of 1–3 km depth. This feature is much clearer in the relocated seismicity than in the catalogue locations.
Cross-sections through the final models and the relocated seismicity. (a) P-velocities, (b) S-velocities, (c) V p /V s ratio, (d) velocity perturbation in % relative to P-model and (e) the velocity perturbation in % relative to the S-model. Only cells with rays travelling through them are shown, and only seismicity within ±3 km from the profile is shown.
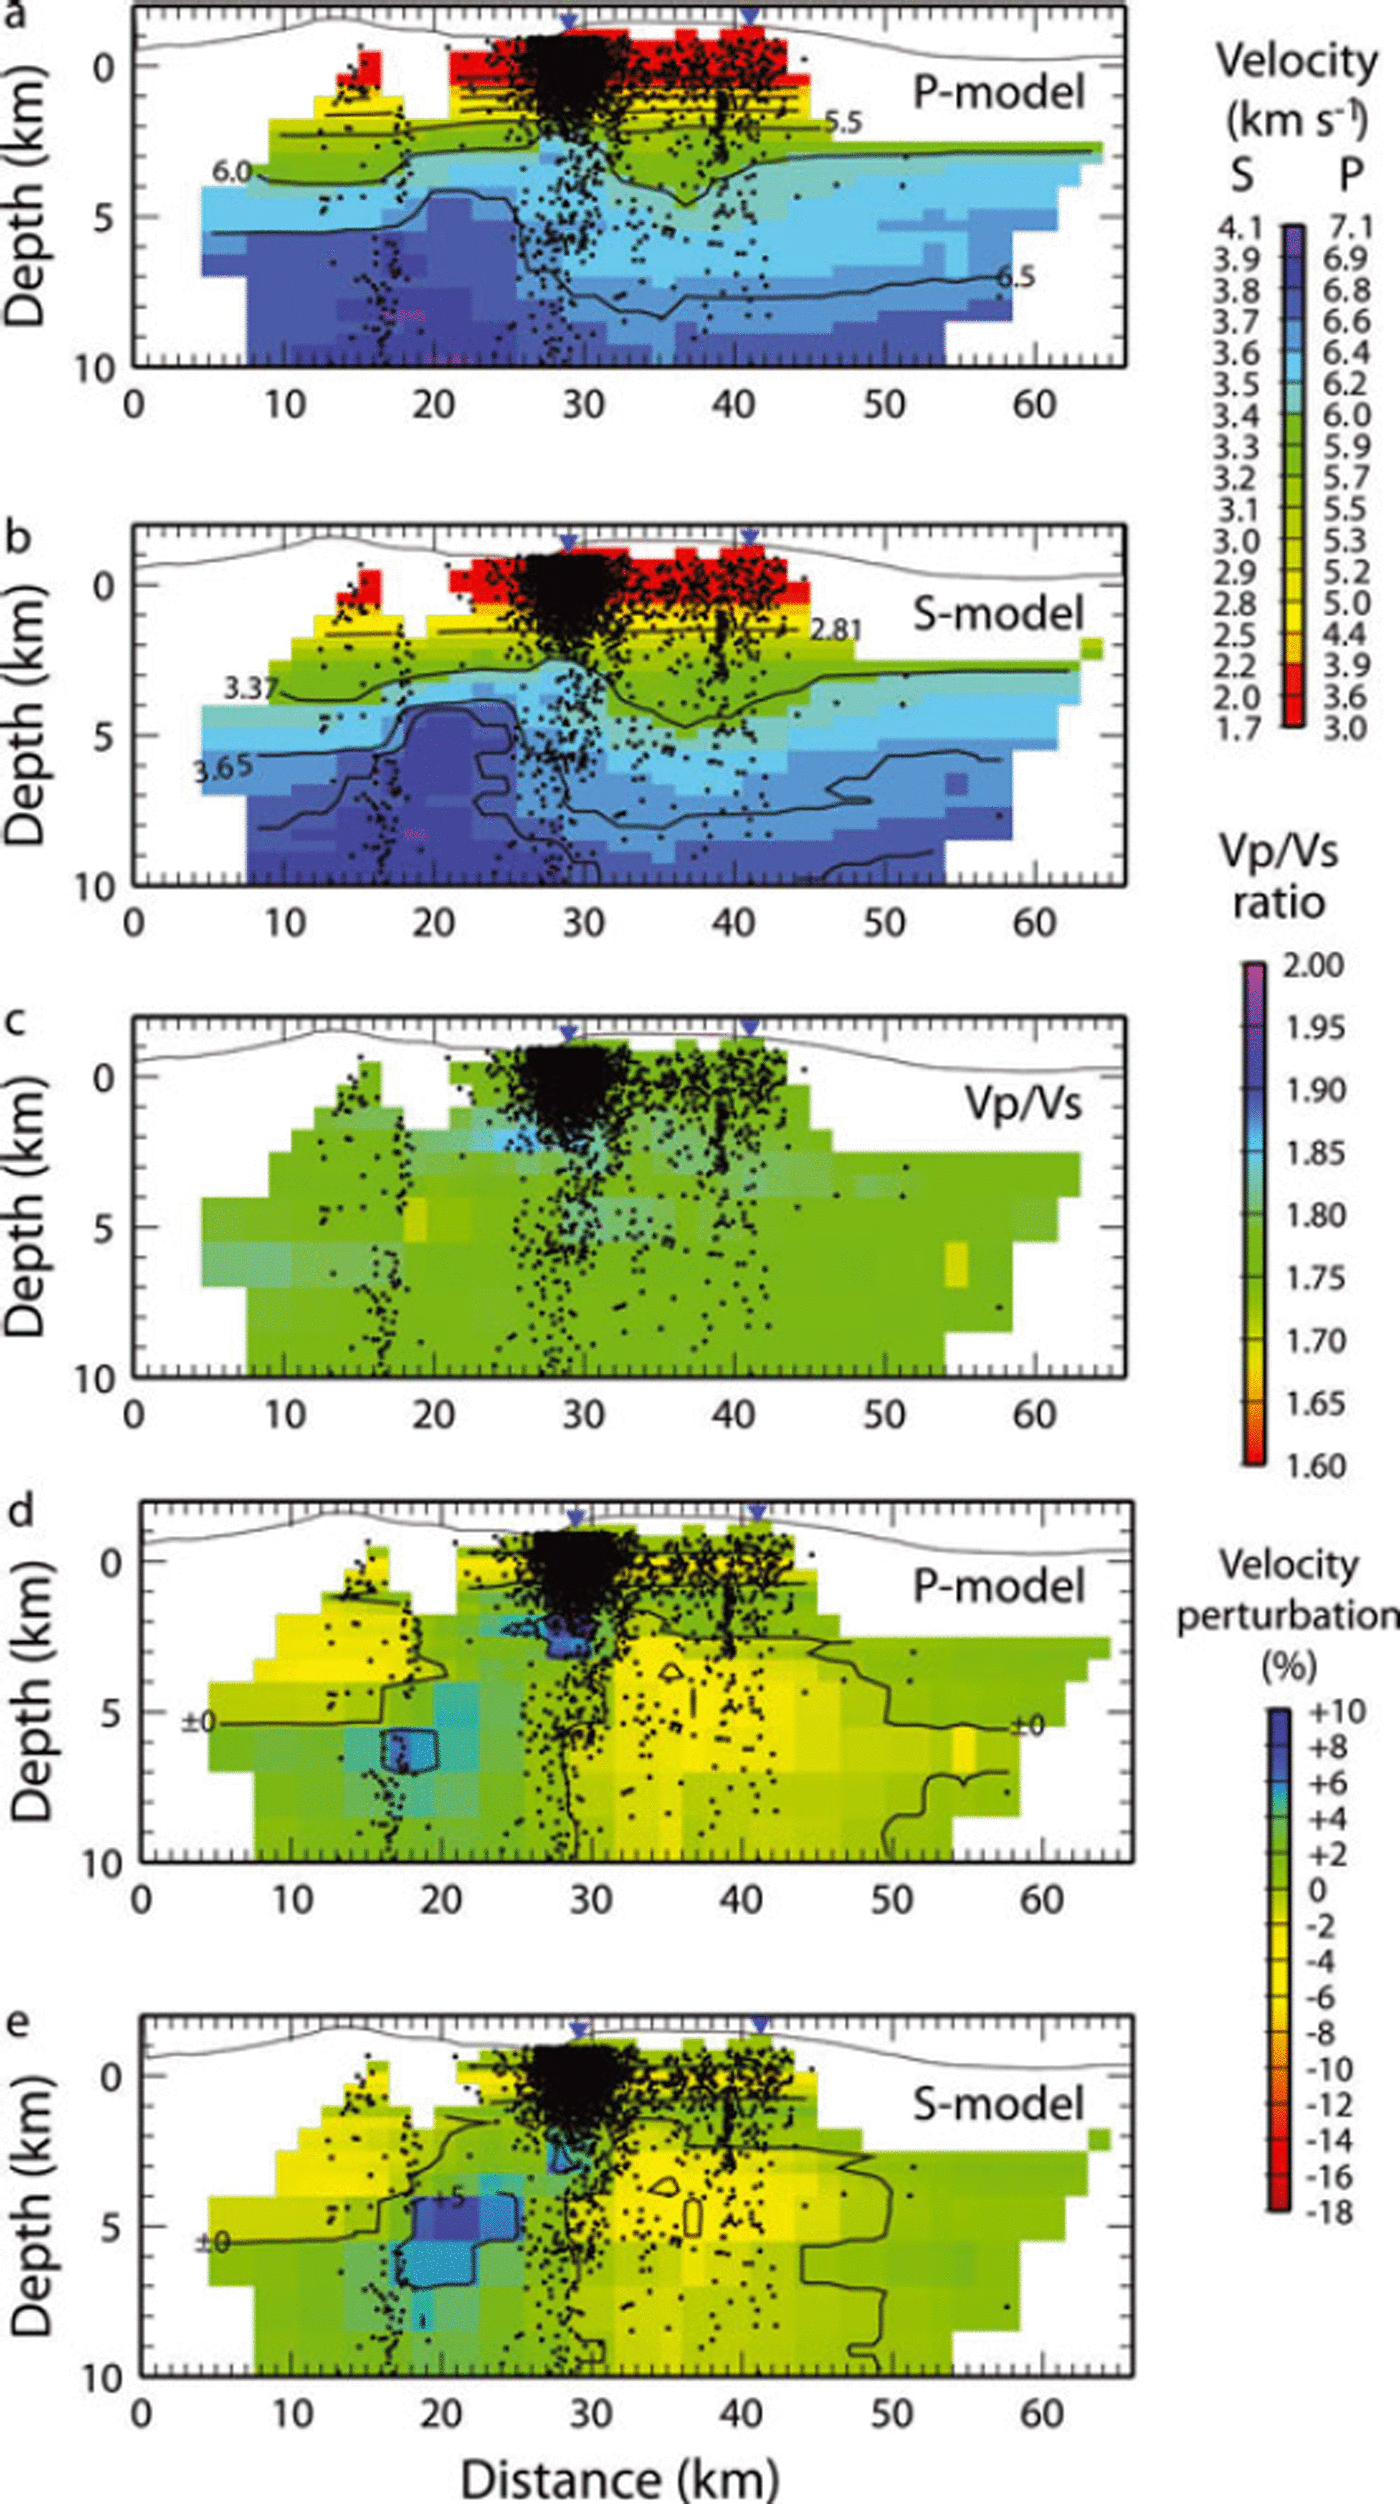
The velocity models show that higher velocities are observed between Eyjafjallajökull and Mýrdalsjökull. This region is almost completely aseismic. Lower velocities are observed beneath the Katla caldera. These velocities are up to 5% slower than the velocities at the flanks (Figs 6d and e). Estimates of the effects of temperature on seismic velocities are of the order of a 1% reduction for every 1008C of temperature elevation (Reference Christensen and MooneyChristensen and Mooney, 1995). This implies a temperature anomaly of a few hundred degrees centigrade may be associated with the volcanic system, assuming that intense fracturing causes part of the velocity reduction. Although the inversion is performed without V p /V s ratio damping (except in the very first iteration), there is very little anomaly in the V p /V s ratio model (Fig. 6c). This indicates that it is reasonable to assume that temperature alone is not causing the low velocities below Katla caldera, but also intense fracturing and possibly circulating hydrothermal fluids.
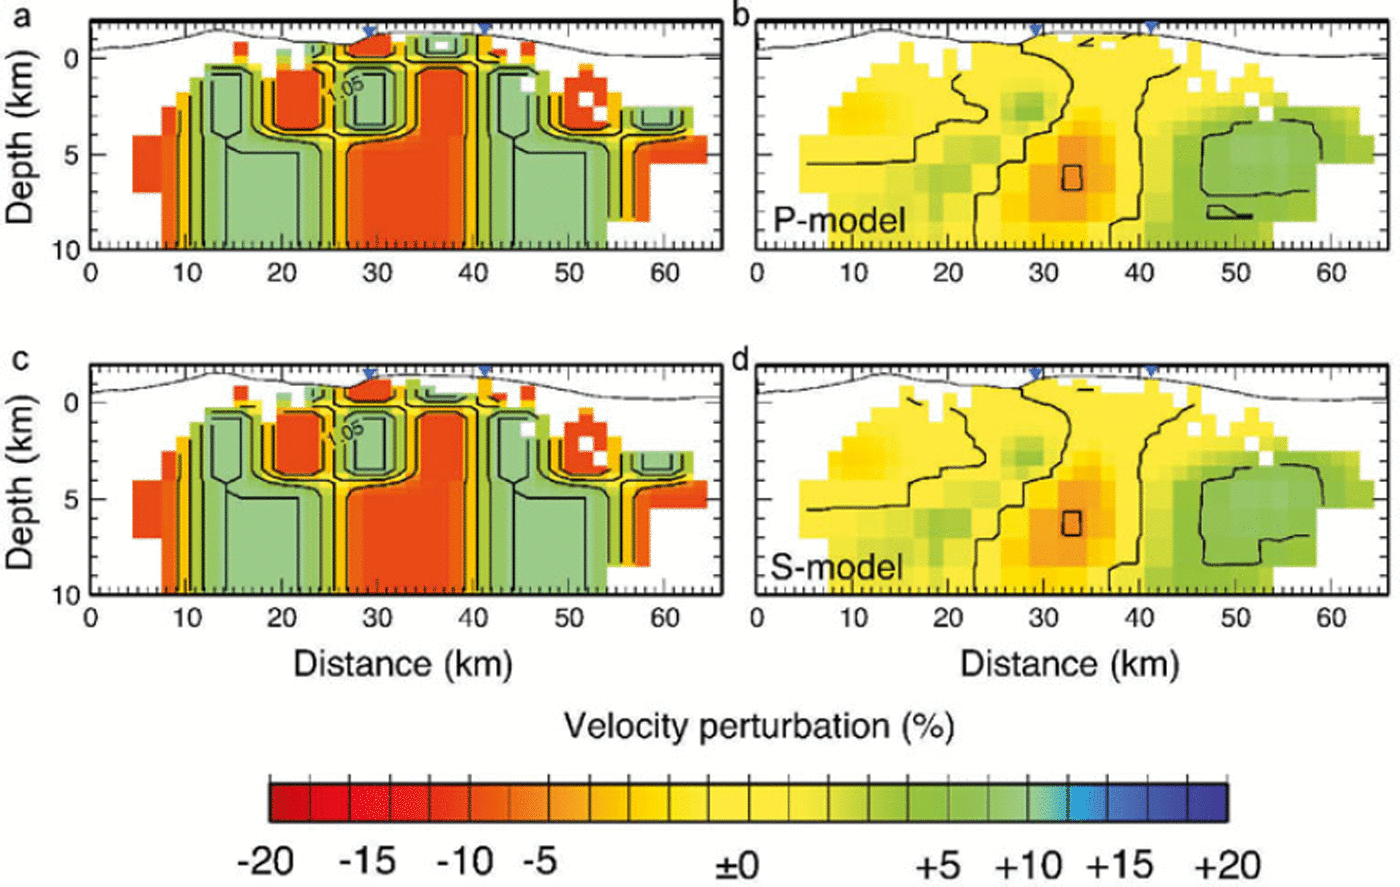
Our results agree with the results from aeromagnetic measurements of Reference Jónsson and KristjánssonJónsson and Kristjánsson (2000), who found a negative magnetic anomaly inside the caldera that they interpreted as being related to a thermal anomaly or the presence of advanced geothermal alteration. To evaluate our model robustness and resolution, a characteristic model test is performed. The test model (Figs 7a and 7c) shows a structure of large wavelength (of the order 15 km horizontally) below 4km depth along the profile, similar to that observed in the final models. Above this depth, the models contain a 7.5 km wavelength checkerboard structure with alternating high and low velocities. The reconstructed images reveal that the main features of the synthetic models are recreated in the centre of the model, although they are lower in amplitude than the original test models. The synthetic models also reveal that structures smaller than 7.5 km across are poorly resolved in the tomography, and that above 2km the models lack resolution due to the shortage of crossing ray paths, a consequence of the poor station coverage. Judging from the synthetic tests (Fig. 6), resolution falls off beneath 8–9 km depth.
Results of resolution tests for the P- and S-wave velocities. The original test model is shown in (a) and (c) (identical in percentage perturbation) and the results in (b) and (d) using our model for the P-wave and S-wave velocities respectively. Stations from the temporary network are marked with blue triangles.

The magma chamber postulated by Reference Guðmundsson, Brandsdóttir, Menke and SigvaldasonGuðmundsson and others (1994) to exist beneath the Katla caldera at 1.5 km depth can therefore neither be confirmed nor discarded by this tomographic study. Since the tomography presents an average and smooth picture, the resulting low-velocity field does not rule out the possibility of a complex constituted of thin dykes and sills.
Conclusions
The seismicity of the Katla volcano is unusual in many ways. The caldera data show characteristics similar to many volcanic areas, but data from the Goðabunga area are highly anomalous. The seismicity in both areas, but especially Goðabunga, is clearly modulated by an outside factor, most likely the annual variations in the glacier. The seismicity increases in the autumn and reaches its maximum in July/August within the Katla caldera and in October at Goðabunga, which is 2–3 months after the summer melt peak. This time delay, along with the temporal seismicity pattern, the low-frequency waveforms of the earthquakes at Goðabunga and the inferred high permeability in the uppermost crust, suggest that neither hydraulic fracturing (from opening of new fractures) nor induced pore-fluid pressure (from melt-water, causing shear motion of existing fractures), are the mechanisms causing the excess seismicity in the autumn. However, the latter model might explain the induced seismicity within the caldera.
Our results show a good correlation between the modelled snow loading/unloading, but with a time lag since the minimum load occurs in September. The mechanism explaining the relationship between the annual variations in the Goðabunga seismicity and the variations of the ice sheet remains unclear.
The seismicity beneath the Katla volcanic area and Eyjafjallajökull has been used in a tomographic inversion for P- and S-wave velocities and earthquake relocations. The velocity images reveal an aseismic high-velocity cone between the Katla caldera and Eyjafjallajökull. A broad structure of low velocity coincides with the structure of the caldera. The fairly constant V p /V s ratio in the low-velocity region does not suggest a molten structure of this size. The low-velocity structure is instead interpreted as a temperature anomaly of a few hundred degrees, in combination with intense fracturing and possibly also hydrothermal circulation. Relocated seismicity generally shows clearer vertical structures but the Goðabunga cluster locates to even shallower depths. Due to the relatively poor station distribution for seismic tomography in the area, the derived tomographic images are fairly low in resolution and do not reveal any structures less than about 7.5 km across, such as a shallow magma chamber reported beneath the caldera (Reference Guðmundsson, Brandsdóttir, Menke and SigvaldasonGuðmundsson and others, 1994) or the hypothesized 1 km wide cryptodome beneath Goðabunga (Reference Soosalu, Jónsdóttir and EinarssonSoosalu and others, 2006).
Additional data collected on and within the vicinity of the volcano are desirable for better understanding of the many outstanding issues. Proposed further work includes an analysis of the low-frequency waveforms registered at Goðabunga in order to investigate the unusual source mechanisms of these events.
Acknowledgements
We thank the Icelandic Meteorological office for providing seismic data and for making its meteorological database available. We also thank H. Björnsson who kindly provided the ice topography of Mýrdalsjökull for our snow-budget calculations.