Introduction
The Appalachian region of the United States is home to the Earth’s largest temperate deciduous forest, housing some of the most biologically diverse forest systems in nontropical regions (Ricketts et al. Reference Ricketts, Dinerstein, Olson, Loucks, Eichbaum, DellaSala, Kavanagh, Hedao, Hurley, Carney, Abell and Walters1999). Appalachian forests provide many ecosystem services, such as water-quality protection, carbon sequestration, and wildlife habitat, and economic benefits, such as timber production. Surface mining for coal, however, has caused large-scale disturbances, net loss of productive forests, and forest fragmentation (Drummond and Loveland Reference Drummond and Loveland2010; Wickham et al. Reference Wickham, Riitters, Wade, Coan and Homer2007). Coal mining in particular has affected >600,000 ha in Appalachia, the majority of which has not been returned to forests or any other type of productive land use, often resulting in unmanaged lands that are invaded by nonnative plants (Zipper et al. Reference Zipper, Burger, McGrath, Rodrigue and Holtzman2011a).
Severe erosion, sedimentation, and landslides were significant concerns for Appalachian coal surface mines before 1977 (Skousen and Zipper Reference Skousen and Zipper2014). As a result, the U.S. Congress passed the Surface Mining Control and Reclamation Act (SMCRA, Public Law 95-8) to standardize and mandate reclamation practices. SMCRA required coal-mining companies to obtain a permit and a performance bond before mining to ensure land reclamation adequate to restore an area to its original use or a use of higher value [Sect. 515(b)(2)]. In Appalachia, common ways of meeting SMCRA reclamation requirements are reestablishment of native hardwood forest or creation of livestock pasture (Skousen and Zipper Reference Skousen and Zipper2014).
Management Implications
Surface mining is widespread globally and represents a severe and often long-term disturbance. Following mining, as with most disturbed sites, these lands are colonized by exotic plants. However, in the United States, mining companies are required to reclaim former coalfields to specific standards—often to native forests. Thus, rapidly colonizing exotic invasive plants often interfere with reclamation goals; such interference can include competing with planted tree seedlings. Autumn-olive (Elaeagnus umbellata Thunb.) is one of the most common invasive plants on former coalfields in the eastern United States. This fast-growing, nitrogen-fixing shrub tolerates poor soils and is readily dispersed by animals. Land managers often find it necessary to remove E. umbellata before establishing native trees but lack efficacious management practices.
This study was designed to remove mature E. umbellata and establish native tree seedlings. We evaluated two common management practices, cutting and cut stump herbicide application, for their efficacy in managing E. umbellata, as well as how they compared with no E. umbellata removal and an E. umbellata–free area for native tree sapling establishment. After 2 yr, the cutting plus herbicide treatment resulted in complete E. umbellata control and had the highest native tree seedling survival and growth. However, the more cost-effective cutting-only treatment provided only slightly poorer performance and may be the preferred choice for reclamation of large, heavily infested areas.
However, under SMCRA, reclamation assessment may occur only 5 yr after reclamation has been completed. Historically, this resulted in many projects focusing on short-term mitigation and not on restoration of native forest ecosystems (Angel et al. Reference Angel, Davis, Burger, Graves and Zipper2005). In recent years, landowners and mine operators have been embracing mine reclamation using the Forestry Reclamation Approach that attempts to restore native forest trees (Burger et al. Reference Burger, Graves, Angel, Davis and Zipper2005). However, these techniques use herbaceous plants that minimize competition with native trees and may leave the mine sites more vulnerable to invasion by exotic plants (Fields-Johnson et al. Reference Fields-Johnson, Zipper, Burger and Evans2012). As such, invasive exotic plants have become a primary concern for those responsible for reclamation. Furthermore, exotic plants have become widespread and are implicated in a variety of negative ecosystem impacts, including acting as impediments to reclamation success (Barney et al. Reference Barney, Tekiela, Dollete and Tomasek2013).
On former coal mines in the Appalachian region, autumn-olive (Elaeagnus umbellata Thunb.) is one of the most common invasive exotic plants (Lemke et al. Reference Lemke, Schweitzer, Tadesse, Wang and Brown2013; Oliphant et al. Reference Oliphant, Wynne, Zipper, Ford and Donovan2017; Zipper et al. Reference Zipper, Burger, Skousen, Angel, Barton, Davis and Franklin2011b). Elaeagnus umbellata was brought to the United States in 1830 and is native to Pakistan, China, and eastern Asia (Ahmad et al. Reference Ahmad, Sabir and Zubair2006). In the 1960s, it was intentionally planted for erosion control, as a nurse species for tree plantations, and to provide wildlife habitat and food on disturbed lands (Fowler and Fowler Reference Fowler and Fowler1987; Lemke et al. Reference Lemke, Schweitzer, Tadesse, Wang and Brown2013). These factors, and ease of establishment, resulted in widespread planting of E. umbellata on reclaimed mine sites. Although it is no longer commonly planted today, E. umbellata is widespread and continues to invade and proliferate on former Appalachian mine sites (Lemke et al. Reference Lemke, Schweitzer, Tadesse, Wang and Brown2013; Oliphant et al. Reference Oliphant, Wynne, Zipper, Ford and Donovan2017; Zipper et al. Reference Zipper, Burger, Skousen, Angel, Barton, Davis and Franklin2011b).
Elaeagnus umbellata has many traits that contribute to its success on reclaimed mine sites, including the ability to fix atmospheric nitrogen, produce numerous drupes, and grow in acidic, loamy soils (Ahmad et al. Reference Ahmad, Sabir and Zubair2006). This large shrub has the potential to produce multiple stems from the main root (Moore et al. Reference Moore, Buckley, Klingeman and Saxton2013) and quickly forms a broad, dense crown (Evans et al. Reference Evans, Zipper, Burger, Strahm and Villamagna2013) that suppresses native species through intense shade (Lemke et al. Reference Lemke, Schweitzer, Tadesse, Wang and Brown2013) and formation of dense patches (Catling et al. Reference Catling, Oldham, Sutherland, Brownell and Larson1997). Elaeagnus umbellata establishment and proliferation on mine sites interferes with forest restoration (Evans et al. Reference Evans, Zipper, Burger, Strahm and Villamagna2013) and can be expensive and time-consuming to remove. It can be managed on reclamation sites by physical cutting with large equipment, but little information exists regarding management efficacy or the subsequent effects on planted native trees.
We investigated the consequences of the presence and management of E. umbellata on native hardwood tree seedling establishment and growth. Specifically, we had the following objectives: (1) compare hardwood seedling survival and growth over 2 yr in reclaimed areas where mature E. umbellata was left unmanaged, reclaimed areas where E. umbellata was never present, and reclaimed areas where E. umbellata was managed in two different ways: mechanical removal alone and mechanical removal plus cut stump herbicide application; (2) evaluate whether E. umbellata changes plant-available soil nitrogen, which may affect tree growth; (3) identify which scenario achieves the best, most effective approach for native tree seedling growth. This study is intended to inform both management and reclamation practices and to improve understanding of basic ecological interactions among invasive and native woody plants.
Materials and Methods
The following experiments were carried out at the Powell River Project, a 445-ha area located in Wise County, VA, and used cooperatively by Virginia Tech, natural resource industries, and other educational institutions to conduct mine-reclamation research.
To meet our objectives, we conducted an experiment to investigate hardwood tree seedling growth on reclaimed lands in response to four different E. umbellata treatments. All E. umbellata used in this study were large, mature, multistemmed shrubs, approximately 3- to 4-m tall with dense canopies. The study area was a previously reclaimed mine area that included dense patches of mature E. umbellata interspersed with areas with no known presence or history of E. umbellata. Each 8 by 8 m block was 75% covered with E. umbellata and 25% open area. Eight blocks were randomly located within the same 1-ha area described above. Each block was subdivided into four 3 by 3 m plots with 2-m buffers between plots within each block.
We set up the following four treatments in fall 2014 in a randomized complete block design:
1. Elaeagnus umbellata unmanaged;
2. mechanical control of E. umbellata (cut only);
3. mechanical control of E. umbellata followed by cut stump herbicide application (cut and sprayed); and
4. Elaeagnus umbellata never present (no E. umbellata).
Treatments 1 to 3 were sited within the 75% of the block that was covered by E. umbellata. Treatment 4 was in the 25% of the block where E. umbellata was never present. To simulate how E. umbellata could be managed on a large scale, we cut E. umbellata with a chainsaw at 10 to 15 cm above the soil surface for Treatments 2 and 3, and the biomass was removed from the site. For Treatment 3, we also applied triclopyr (Garlon® 4 Ultra, 480 g ae L−1, Dow AgroSciences, Indianapolis, IN) at 20% v/v in basal oil (Alligare, Opelika, AL) to the cut stumps. The ground cover in Treatments 1 to 3 was bare ground throughout the experiment, while all blocks in Treatment 4 were 80% to 90% sericea lespedeza [Lespedeza cuneata (Dum. Cours.) G. Don] and tall fescue [Lolium arundinaceum (Schreb.) Darbysh.], which commonly occur on reclaimed mines throughout Virginia coal-mined areas, with the remaining 10% to 20% being bare ground. The ground cover composition did not change over the course of the experiment. Due to restrictions of the location where the experiment was conducted, we were unable to replicate the experiment in space. This is an active mine site with a variety of restrictions on what can be done. Thus, we were limited to a single site-year.
Reclamation specialists typically hand transplant 1-yr-old bare-rootstock seedlings in late winter. Therefore, we used 1-yr-old bare-rootstock seedlings of three native species, pin oak (Quercus palustris Münchh.), red maple (Acer rubrum L.), and black cherry (Prunus serotina Ehrh.), which were chosen for their local use and rapid growth rate on reclaimed mine sites (Davis et al. Reference Davis, Burger, Rathfon, Zipper and Miller2012). Three individuals of each species were planted haphazardly into each treatment in each block in mid-March 2015, spaced 0.5 to 1 m apart. For Treatment 1, tree seedlings were planted under the existing E. umbellata canopy. All trees were obtained from the same supplier and were of similar size: P. serotina mean height was 43 cm, Q. palustris mean height was 44 cm, and A. rubrum mean height was 15 cm. Within each plot, we monitored survival in October 2015 and 2016 for each native tree seedling. In October 2016 (the end of the second growing season), we recorded native tree seedling height and stem diameter at ground level, and all surviving planted hardwoods were excavated, separated into above- and belowground sections, and dried at 70 C until constant weight. Basal tree diameter was strongly correlated (r2 = 0.76) with tree height and biomass and was therefore not analyzed. We also recorded whether E. umbellata regrew (for Treatments 2 and 3) in October 2015 and 2016. In all blocks, Treatment 2 (cut-only) E. umbellata regrew, and in Treatment 3 (cut stump) we observed no regrowth. We did not record additional measures, as the treatment effect was absolute.
Elaeagnus umbellata is a nitrogen fixer and has the potential to alter nutrient cycles, which may affect tree seedling growth differently across treatments. Therefore, in each plot, ionic exchange membranes (IEMs; GE Osmonics, Trevose, PA) were used to measure soil nitrate (NO3 −) and ammonium (NH4 +) (Bowatte et al. Reference Bowatte, Tillman, Carran, Gillingham and Scotter2008; Duran et al. Reference Duran, Delgado-Baquerizo, Rodriguez, Covelo and Gallardo2013; Subler et al. Reference Subler, Blair and Edwards1995). All IEMs were cut into 5 by 10 cm rectangles and hole-punched at the top. IEMs were immersed in a 1 M solution of sodium chloride (NaCl), which allows either sodium (Na+) or chloride (Cl−) ions to fill all exchange sites. Anion and cation membranes were stored in the 1 M NaCl at 4 C in separate containers until put into the field. Before being placed in the field, membranes were rinsed with deionized (DI) H2O. Within each plot, two IEMs (anion and cation) were installed at a 45° angle in the soil, ensuring no overlaps or wrinkles. After 30 d in the field during the month of August 2015, each membrane was placed into its own plastic bag, transported on ice back to the lab, and then stored at 4 C for <7 d. For the extraction of inorganic nitrogen, soil particles were rinsed off the membrane surface using DI H2O, and then the IEMs were individually submerged in 1 M potassium chloride (KCl). They were then placed for 1 h on a reciprocal shaker at 22 rpm (Hangs et al. Reference Hangs, Greer and Sulewski2004; Subler et al. Reference Subler, Blair and Edwards1995). A TrAAcs 2000 Analytical Console (Bran + Luebbe, Analyser Division, Norderstedt, Germany) that was connected to an XY2 Auto sampler (SEAL Analytical, Mequan, WI) was used for the analysis of extracts for nitrate (NO3 −) and ammonium (NH4 +).
Data Analysis
To test for treatment effects on hardwood tree seedling survival, we conducted a logistic regression with tree species, treatment, and their interaction as fixed effects. To test for treatment effects on final height and total biomass of hardwood tree seedlings, we conducted a mixed model with blocks as a random effect; tree height at planting as a covariate (to account for tree species size differences); and tree species, treatment, and their interaction as fixed effects. In both cases, the interaction between treatment and tree species was not significant (P > 0.05) and was removed from the final model. A one-way ANOVA was conducted to test for the effect of E. umbellata control treatments on quantities of NO3 − and NH4 +. Means were separated using Tukey-Kramer honestly significant difference post hoc tests. All statistical analyses were conducted using JMP Pro 13.
Results and Discussion
Native Tree Survival
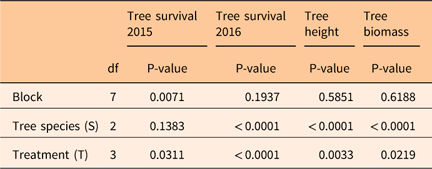
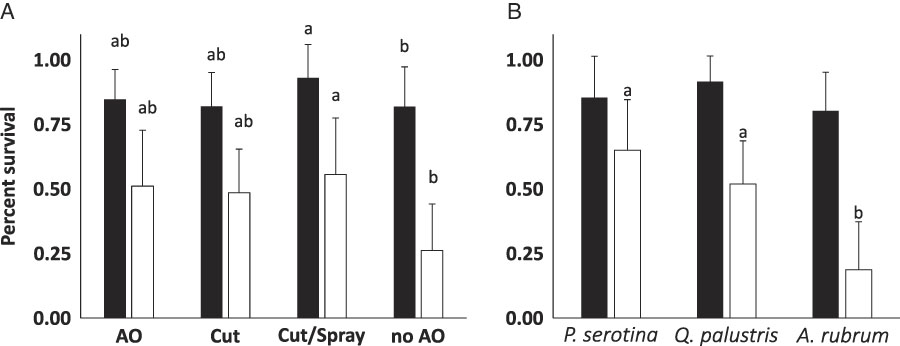
Survival was high (>80%) the first year and did not differ among the three native tree species, but survival did vary among treatments (Table 1). Hardwood tree seedlings had the highest survival in the E. umbellata cut-and-spray treatment compared with the no E. umbellata treatment (Figure 1A). By the second year, survival dropped precipitously for all three native tree species (Figure 1) and differed among treatments and among tree species (Table 1) with the smaller A. rubrum having the highest mortality rate. Survival was the same in all treatments that had E. umbellata, but higher when E. umbellata was cut and sprayed (>60%) than in the no E. umbellata treatment (~23%).
Logistic regression for tree survival and mixed-model analyses of tree height and total biomass at the end of the second growing season.

Percent survival of hardwood tree seedlings across the four treatments (A) and by species across all treatments (B) at the end of the first (filled bars) and second (open bars) growing season. In year 1, survival varied among treatments (P = 0.031) but not trees (P > 0.05), and in year 2 percent survival varied among treatments (P < 0.0001) and trees (P < 0.0001). Bars with different letters are significantly different (P < 0.05).

Hardwood Performance
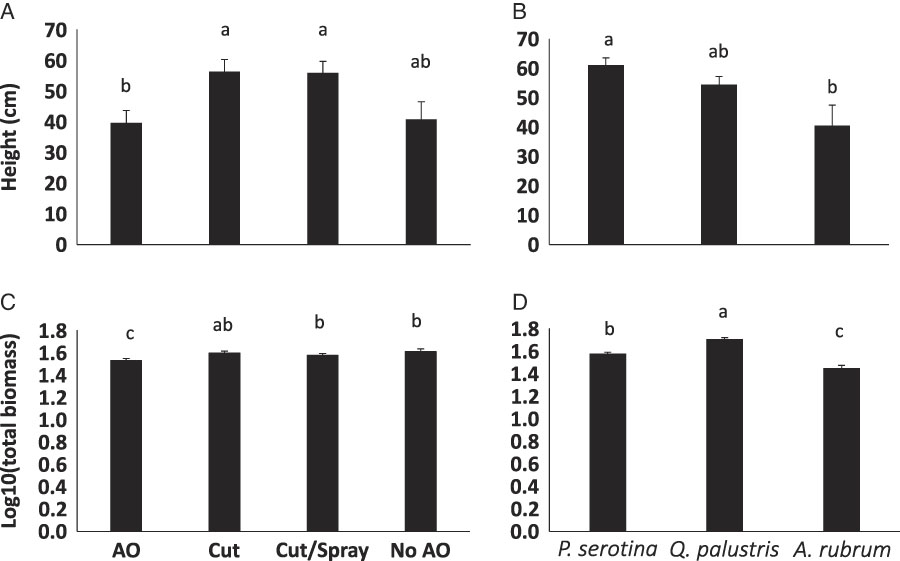
Hardwood tree seedlings grew taller in plots where E. umbellata had been managed (both cut only and cut and spray) than in the unmanaged E. umbellata plots (Table 1; Figure 2A). With a somewhat different pattern, total biomass was greater in the cut-only and the no E. umbellata treatments than in the unmanaged E. umbellata treatment (Figure 2C). Prunus serotina and Q. palustris heights did not differ from one another, and P. serotina was taller than A. rubrum across all treatments (Figure 2B). Quercus palustris had the most total biomass, and P. serotina had more biomass than A. rubrum (Figure 2D). Interestingly, root biomass was 10% higher in plots with E. umbellata than in plots with no E. umbellata (P = 0.03, unpublished data).
Mean height and total biomass (aboveground + belowground, log10 transformed) after two growing seasons of the planted native trees across treatments (A, C) and by tree species (B, D). Bars with different letters are significantly different (P < 0.05).

IEMs
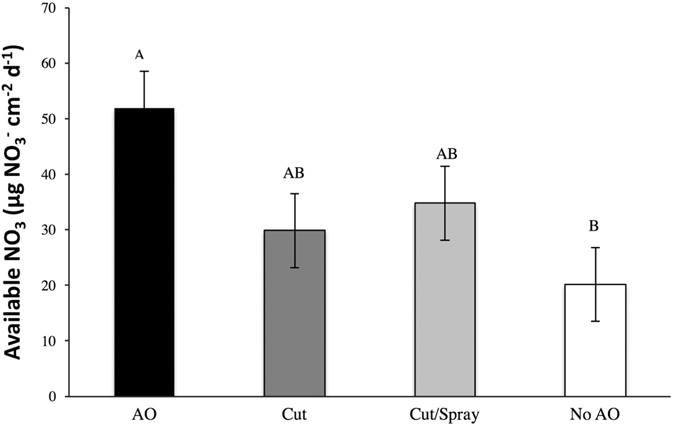
Plant-available soil nitrogen as nitrate (nitrate-N) was more than two times greater where E. umbellata was still intact (unmanaged E. umbellata treatment) than in the no E. umbellata treatment (P = 0.0202; Figure 3), but soil nitrate-N levels in the cut-only and cut-and-spray treatments did not differ statistically from those of other treatments. There was no significant difference among treatments in plant-available soil ammonium N (NH4 + -N) (P = 0.9351, unpublished data). Overall, we found that a single management activity of the invasive E. umbellata resulted in improved performance of transplanted native tree seedlings in a reclaimed coal mine. However, contrary to our expectations, we did not see clear soil nitrogen contributions from E. umbellata, a nitrogen fixer, that we expected to benefit tree performance. Native tree seedlings performed as well in plots following E. umbellata management as in plots that had no history of E. umbellata, though long-term performance would be impacted by potential E. umbellata regrowth, particularly in plots where no herbicide treatment was applied.
Plant-available soil nitrogen as nitrate (NO3 −) (mg N cm−2 d−1) within each management plot with SE.

In line with our results for E. umbellata management, Byrd et al. (Reference Byrd, Cavender, Peugh and Bauman2012) found that mechanical removal with herbicide treatment of stumps provided greater E. umbellata control on mined lands than did mechanical removal alone. Evans et al. (Reference Evans, Zipper, Burger, Strahm and Villamagna2013) also found that physical removal of E. umbellata without accompanying herbicide treatment failed to provide effective control. After four growing seasons, vigorous regrowth of E. umbellata, apparently from living rootstock as well as from seed, threatened survival of planted trees in some reforestation areas, as the E. umbellata had overtopped some of the planted trees with a spreading canopy (Evans et al. Reference Evans, Zipper, Burger, Strahm and Villamagna2013).
Overall, native tree survival was initially high, but declined to 20% to 60% by the end of the second growing season. Planted tree survival appeared to be strongly reduced by competitive plant communities, whether E. umbellata was always present or regrown (cut-only treatment), as well as in the dense communities that lacked E. umbellata. Competitive herbaceous and forb communities are known to cause reduced survival and growth of trees planted on coal surface mines (Franklin et al. Reference Franklin, Zipper, Burger, Skousen and Jacobs2012). When reforesting former coal mines that have well-established vegetation, control of competing herbaceous vegetation is recommended until planted tree canopies are able to emerge from the competition (Burger et al. Reference Burger, Zipper, Angel, Hall, Skousen, Barton and Eggerud2013).
The larger P. serotina and Q. palustris species responded similarly across the treatments, though the smaller A. rubrum had much lower survival across all treatments. Although not compared statistically, mean growth by A. rubrum (approximately 25 cm, on average, computed as change in height relative to average height for seedlings) was greater than for the other two species (<20 cm). We have reported height as our primary metric, however, because the planted trees’ extension of canopy above competing vegetation is essential to persistence over longer terms. While hardwood seedling survival was highest when E. umbellata was cut and sprayed, there were no differences in seedling height or biomass among the E. umbellata management plots at the end of the second growing season. Though native tree seedlings were tallest in E. umbellata managed plots, they had more biomass in any treatment where E. umbellata was managed or never existed.
Elaeagnus umbellata creates root nodules that have a symbiosis with soil actinomycetes (Frankia spp.), giving them the ability to fix and use atmospheric nitrogen (Paschke et al. Reference Paschke, Dawson and David1989). This symbiosis, combined with rapid growth rates and endozoochory, has allowed E. umbellata to thrive on degraded lands. In fact, there is evidence that in soils underneath E. umbellata, there are higher nitrification rates, and nitrate leaching underneath E. umbellata can be comparable to a fertilized cornfield (Baer et al. Reference Baer, Church, Williard and Groninger2006). Nitrogen is one of the most important components of ecosystems worldwide, influencing ecosystem function (e.g., nutrient cycling) and structure (e.g., diversity) (Vitousek et al. Reference Vitousek, Cassman, Cleveland, Crews, Field, Grimm, Howarth, Marino, Martinelli, Rastetter and Sprent2002). Disturbance can often lead to pulses in plant nutrients, which can lead to invasion and change successional trajectories (Davis et al. Reference Davis, Grime and Thompson2000). However, in highly disturbed sites such as coal mines, which commonly use fractured bedrock as the growing medium, plant-available soil nitrogen is often lacking (Li and Daniels Reference Li and Daniels1994). In many cases, disturbed nutrient-poor terrestrial ecosystems are commonly colonized by nitrogen-fixing exotic plants (Vitousek and Walker Reference Vitousek and Walker1989; Vitousek et al. Reference Vitousek, Walker, Whiteaker, Mueller-Dombois and Matson1987).
Therefore, we expected the tree seedlings to grow better in plots with E. umbellata, managed or unmanaged, than in the plots where there is no E. umbellata present due to the increased concentration of plant-available nitrogen. The higher soil nitrogen under the growing E. umbellata was correlated with higher root production for all trees compared with those growing in plots with no E. umbellata history. This may have resulted from nitrogen foraging but did not translate to overall larger trees. Thus, it appears there is no ecologically relevant short-term effect of E. umbellata management on soil nitrogen. While nitrogen availability did not appear to affect tree seedling growth, as mentioned above, competition from other species appeared to have strong effects on tree performance. Additionally, in all cases where E. umbellata was only cut, it regrew the following year. Vigorous root suckering by E. umbellata following cutting appeared to reduce planted trees’ survival, but had no effect on surviving trees’ biomass over the first 2 yr.
The reduced size of planted trees in the unmanaged E. umbellata plots, relative to one (biomass) or both (height) management treatments and despite those soil nitrogen levels, may be evidence of competitive effects by the standing E. umbellata on the ability of planted tree seedlings to access essential resources such as sunlight. An ability to achieve rapid height growth is essential if planted tree seedlings are to successfully replace E. umbellata, given the capability of E. umbellata to reestablish, even if controlled initially, and to achieve rapid height growth and canopy cover once reestablished. Planted trees’ survival on such mine sites will be affected negatively if they are overtopped by regenerating E. umbellata, as demonstrated by Evans et al. (Reference Evans, Zipper, Burger, Strahm and Villamagna2013), who found progressive declines of surviving planted tree numbers occurring over the second, third, and fourth growing seasons in association with rapidly expanding canopy cover by E. umbellata that had regenerated following mechanical removal with no herbicide treatment.
Once E. umbellata becomes established, eradication requires tremendous effort and expense. In fact, for most invasive species, eradication, or the complete elimination of the species in the area, scales exponentially with the size of the invasion (Rejmánek and Pitcairn Reference Rejmánek and Pitcairn2002). The difficulties of E. umbellata eradication stem from prolific seed production, dispersal via wildlife, and the ability to resprout after cutting or damage (Kohri et al. Reference Kohri, Kamada, Yuuki, Okabe and Nakagoshi2002), resulting in aggressive colonization that hinders native woody species dispersal on reclaimed mine areas. Often, a single mechanical removal is used to control dense groves of E. umbellata on former coalfields that are hindering the establishment and growth of hardwood tree species (Byrd et al. Reference Byrd, Cavender, Peugh and Bauman2012). However, mature E. umbellata is known to aggressively resprout when cut (Campbell et al. Reference Campbell, Dawson and Gregory1989), which is what we observed here—vigorous stand development from root suckers in the second year. Elaeagnus umbellata did not resprout when cut stumps were treated with herbicide, thus reducing competition with native trees. Though the similar responses of the native tree seedlings in the two E. umbellata management plots, whether sprayed or not, suggest that short-term survival and growth were similarly affected by competition with resprouting E. umbellata and other standing vegetation, long-term performance may change as the plant communities change with time. Cutting alone is more cost-effective than cutting and treating with herbicide, especially for managing large tracts of land with widespread invasions.
Elaeagnus umbellata also has the potential to impact ecosystem processes through nitrogen fixation and alteration of nutrient cycling (Schlesinger and Williams Reference Schlesinger and Williams1984), giving it the potential to impact the long-term development of forests (Moore et al. Reference Moore, Buckley, Klingeman and Saxton2013). Successful management of E. umbellata with all techniques requires continual management (Byrd et al. Reference Byrd, Cavender, Peugh and Bauman2012). Despite the known effects of E. umbellata, our results suggest that planted tree seedling survival and performance is highest when E. umbellata is cut and herbicide treated, although surviving tree seedling size is equivalent with cutting alone. It is unlikely that trees planted in mature E. umbellata stands will establish. In addition to its capacity for rapid proliferation and rapid growth and the dense shading produced by its canopy, E. umbellata can also suppress native plant establishment through allelopathic mechanisms (Orr et al. Reference Orr, Rudgers and Clay2005). Thus, managers should prioritize preventing E. umbellata establishment when possible. Otherwise, cutting E. umbellata alone can appear as a cost-effective and practical management choice when attempting to establish native trees. However, prolific growth by E. umbellata resprouts from intact roots was observed in the cut-only management treatment, and prior research has demonstrated that E. umbellata can grow more rapidly than planted hardwood trees on coal surface mines, suggesting that survival may have been further impaired had we left the planted trees in place for longer than 2 yr. The cutting and herbicide treatment resulted in less E. umbellata resprouting and appears to provide a higher probability, relative to the cut-only treatment, that planted trees would be able to establish and persist successfully in the long term. Our results provide useful information for short-term E. umbellata management, but longer-term studies are needed to fully realize their ramifications on native tree growth and performance.
Acknowledgments
We would like to thank the Powell River Project for funding, and Ali McClung, Dan Atwater, Eugene Dollete, Stacy Fanning, Alyssa Smith, and Dan Tekiela for help with data collection. The authors declare no conflict of interests.