


Do citizens hold government accountable for disasters that occur under their watch? Abundant research in political science has explored whether voters respond to negative shocks that are within the realm of policymakers’ responsibilities (Healy and Malhotra Reference Healy and Malhotra2013).Footnote 1 Most of the research in this area suggests that citizens hold elected officials accountable when things go wrong. For instance, there is evidence that voters respond to spikes in crime (Arnold and Carnes Reference Arnold and Carnes2012; Bateson Reference Bateson2012), negative economic shocks (Fiorina Reference Fiorina1978; Healy and Lenz Reference Healy and Lenz2014, Reference Healy and Lenz2017), failing schools (e.g., Berry and Howell Reference Berry and Howell2007; Holbein Reference Holbein2016; Holbein and Hassell Reference Holbein and Hassell2019), battlefield deaths (Grose and Oppenheimer Reference Grose and Oppenheimer2007; Karol and Miguel Reference Karol and Miguel2007; Kriner and Shen Reference Kriner and Shen2007; Mueller Reference Mueller1973), and even other unanticipated negative events (Fair et al. Reference Fair, Kuhn, Malhotra and Shapiro2017; Gasper and Reeves Reference Gasper and Reeves2011; Healy and Malhotra Reference Healy and Malhotra2009; Heersink, Peterson, and Jenkins Reference Heersink, Peterson and Jenkins2017). (For a more thorough overview of this literature, see Table A1 and Section 1d in the Online Appendix.) In reading this literature, this much seems clear: disasters that are within the realm of policymakers’ responsibility and that citizens notice and care about are likely to promote democratic accountability.
But is this uniformly true? Are voters really responsive or are there important instances when citizens are attentive and governments are responsible, but accountability responses do not occur? At present, we have a large body of studies that tell us that accountability responses will usually occur, but few outlining when (and why) accountability responses fail to arise. While studies in public opinion have highlighted focusing events as incidences that advance issues to the top of the political agenda but not necessarily prompt retrospective voting (Birkhead Reference Birkhead1998; Kingdon Reference Kingdon1984), we need to know more about the core conditions that might cause events to drive citizen retrospection rather than to act merely as an event that draws the public’s attention for a short period of time but then fades into the background.
In this paper, we begin to fill this gap by providing a prominent example of a negative shock that meets the (loose) criteria for a retrospective response laid out in previous literature, but that fails to elicit an accountability-enhancing electoral response. Specifically, we test whether school shootings—which, as we argue below, are connected to policymakers’ responsibilitiesFootnote 2 and attract citizens’ attention—affect (validated) behavioral measures of electoral participation and vote choice. Though some work has examined mass shootings’ effects on citizen attitudes, we explore whether shootings have a causal effect on validated electoral behavior.Footnote 3 Our work is important given that electoral effects are more consequential to democratic accountability than attitudinal effects alone.Footnote 4
Using a unique combination of datasets and several methods for causal inference, we find that school shootings have little to no effect on validated voter registration rates; validated voter registration patterns across important demographics; validated voter turnout; incumbency reelection rates; rates of candidates running unchallenged; and, ultimately, election results at the local, state, and federal levels. This finding holds true across numerous subgroups and using a variety of robustness checks. Simply put, despite having favorable conditions for a response, little to no retrospective voting (or even mobilization) occurs when it comes to school shootings.
In providing a prominent case where retrospective voting does not occur, our paper illuminates further what types of conditions are important for electoral accountability. Our work shows that sometimes even when negative shocks are connected to government action, action is supported by a majority of the public, issues have a high degrees of salience, negative shocks are highly covered by the media, and citizens notice, care about, and are (perhaps) transformed attitudinally by these events—conditions theorized to be necessary and sufficient to create an electoral response—this may still not be enough to elicit electoral accountability. After detailing our results, in the conclusion we highlight potential additional factors that may shapewhether events prompt retrospective responses.
Our work sheds light on why gun violence has not prompted more policy action from public officials in the United States. Absent systematic electoral pressure from citizens, elected officials have little incentive to change gun policy in the United States.
Background and Conceptual Framework
What conditions promote electoral accountability? Though there exists a rich literature on when retrospective voting occurs, we lack sufficient knowledge about why it happens. Research on this topic has generally been underdeveloped, in part, because most studies published on retrospective voting tend to focus on instances where retrospective voting does occur. Without core instances where retrospective voting does not happen, we have only a partial understanding of the forces that drive democratic accountability.
That said, from the (predominantly successful) instances of voter retrospection in the published literature, there appear to be a few conditions theorized to promote accountability. First and foremost, though some have argued that citizens sometimes respond to irrelevant events (e.g., Achen and Bartels Reference Achen and Bartels2017; Healy, Malhotra, and Mo Reference Healy, Malhotra and Mo2010; Sances Reference Sances2017), problems that government has control over are more likely to promote retrospection (Achen and Bartels Reference Achen and Bartels2017; Ashworth Reference Ashworth2012; Dynes and Holbein Reference Dynes and Holbein2020; Healy and Malhotra Reference Healy and Malhotra2013). Second, the literature has suggested that when citizens are affected by negative events and are able to trace them to a set of responsible decision-makers, retrospective voting is likely to occur (Ashworth Reference Ashworth2012; Berry and Howell Reference Berry and Howell2007; Healy and Malhotra Reference Healy and Malhotra2013; Mettler Reference Mettler2011; Pierson Reference Pierson1993). Third, research has suggested when negative events promote civic behaviors outside of elections—for example, protests in the streets—electoral responses are likely to follow (e.g., Madestam et al. Reference Madestam, Shoag, Veuger and Yanagizawa-Drott2013).
These three core conditions are met in the case of gun violence in American schools. First, gun violence is clearly connected to what government does. Protecting citizens from violence is one of the most basic responsibilities of governments (Heyman Reference Heyman1991), governments have many tools at their disposal to try to stem gun violence (e.g., Cook and Ludwig Reference Cook and Ludwig2000), and a dominant majority of citizens favor some form of government action in this policy domain (Gallup 2019; Goss Reference Goss2010). Second, because the media covers these crises extensively, citizens are aware of school shootings and care about addressing these crises (e.g., Burns and Crawford Reference Burns and Crawford1999; Chyi and McCombs Reference Chyi and McCombs2004; Duwe Reference Duwe2000; Hawon et al. Reference Hawon, Räsänen, Oksanen and Ryan2012; Maguire, Weatherby, and Mathers Reference Maguire, Weatherby and Mathers2002; Muschert and Carr Reference Muschert and Carr2006; Nass Reference Nass2018; Park, Holody, and Zhang Reference Park, Holody and Zhang2012). As we show in the Online Appendix, after school shootings occur, citizens become much more interested in the topic of guns and gun control (see Figure A1). Further, though the literature is somewhat divided on this point, at least some studies have shown that school shootings may shift public opinion about gun control.Footnote 5 Third, school shootings appear to (sometimes) spark forms of non-electoral civic behavior that may simultaneously promote electoral behavior. Increased protests that resulted after the shooting at Marjory Stoneman Douglas High School in early 2018, along with evidence from increases in online discussions that follow school shootings (Demszky et al. Reference Demszky, Garg, Voigt, Zou, Gentzkow, Shapiro and Jurafsky2019), suggests these events may activate the knowledge, skills, and behaviors likely to promote voting.
Data
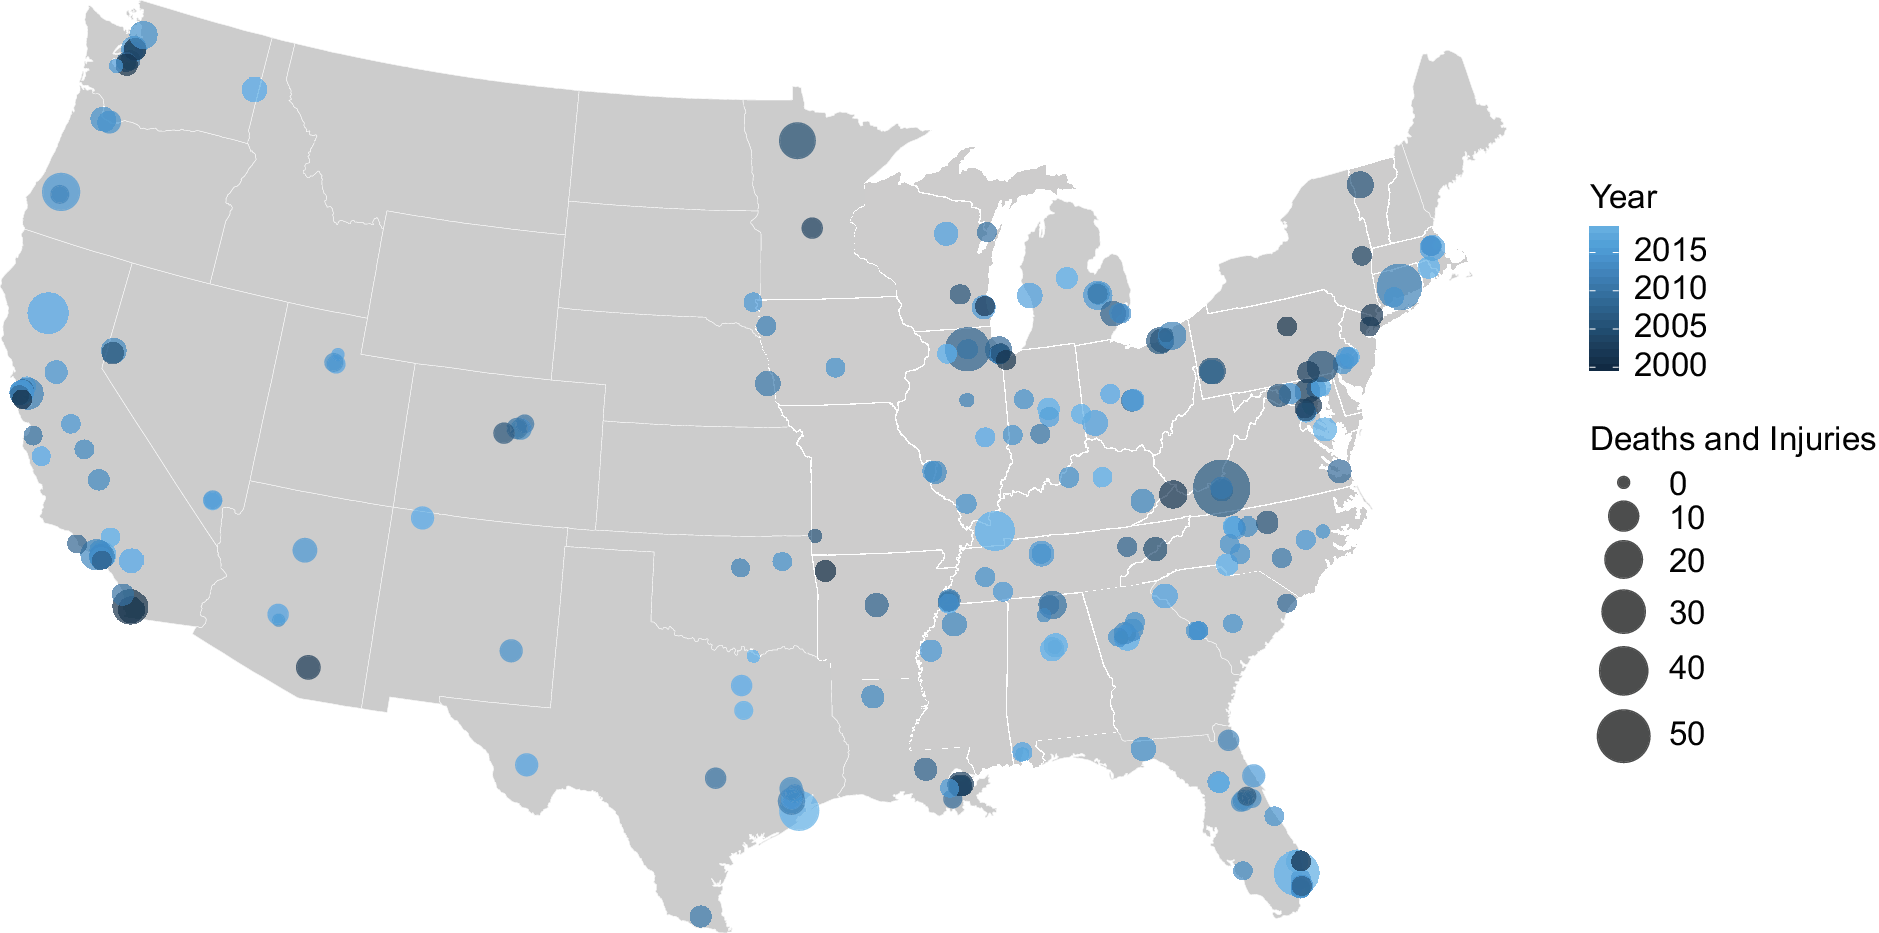
Since a gunman entered Sandy Hook Elementary School in Newtown, Connecticut in 2012 and killed 27 children and public school employees, there have been a staggering 1,600 mass shootings in America—or (roughly) 350 incidents a year.Footnote 6 Many of these tragedies have occurred in the halls of America’s schools—with prominent examples across the country. To be as comprehensive as possible in our analyses, we compiled data on school shootings from the Stanford Mass Shootings of America (MSA) data project, Wikipedia (which maintains a thorough list of all school shootings), and verified media reports. These sources are commonly used in the literature on school shooting on non-electoral outcomes (e.g., Barney and Schaffner Reference Barney and Schaffner2019; Kwon and Cabrera Reference Kwon and Cabrera2019a, Reference Kwon and Cabrera2019b; Luca, Malhotra, and Poliquin Reference Luca, Malhotra and Poliquin2020; Newman and Hartman Reference Newman and Hartman2017, Reference Newman and Hartman2019; Zhang et al. Reference Zhang, Wang, Foley, Suk and Conathan2017). Figure 1 plots where and when these tragedies occurred and how many people were injured/died. Table A2 in the Appendix (and its surrounding discussion) provides additional details about these shootings.
Map of School Shootings in the United States over the Past Two Decades

In considering the effect of school shootings, there are several ways that we could conceptualize what it means to be exposed to treatment. First, we could treat individuals before a shooting as not being exposed, but those after the shooting occurred as being exposed. Second, we could treat individuals who live in the same geographic area (e.g., the same county) as where a shooting occurs as being exposed, but everyone else not being exposed. Third, recognizing that adjacent communities may also be affected, we could code individuals in nearby areas as being a part of the treatment group, but those who are not as part of the control group. Fourth, instead of coding treatment as dichotomous, we could think of it as continuous—being a function of how many people are injured/killed. Fifth, we could conceptualize treatment as being a continuous function of how close to the shooting one lives. As in other studies that have looked for whether shootings influence public opinion, this approach makes the implicit assumption that physical proximity is a good proxy for psychological proximity—that people closer to shootings will be more affected by things that happened closer to them than those that are far away (Barney and Schaffner Reference Barney and Schaffner2019; Newman and Hartman Reference Newman and Hartman2017, Reference Newman and Hartman2019; Rogowski and Tucker Reference Rogowski and Tucker2019).Footnote 7 Sixth, we could consider individuals exposed to shootings that are closer (in time) to elections as being exposed at a greater dosage than those who were exposed further away from elections (assuming that the effect fades after a shooting).Footnote 8 None of these approaches is perfect; all come with assumptions about how school shootings affect the electorate. Hence, we use all of these approaches in our paper and sometimes (in our difference-in-differences and differences-in-discontinuities designs) simultaneously in the same specification, thus providing a layer of robustness that using only one of these approaches would not allow. (Ultimately, all of these approaches end up pointing in the same direction).
We link our data on school shootings with seven outcomes that measure various aspects of the U.S. electoral process. Our outcome measures include validated voter registration; validated voter turnout; incumbency reelection rates across political parties; rates of unchallenged candidates across political parties; and election outcomes at the local, state, and federal levels. These measures allow us to examine a range of potential electoral responses to school shootings and to trace citizens’ possible retrospective responses from the (arguable) beginning to the (arguable) end. They also allow us to see whether any accountability-enhancing responses occur at different levels of government—a vitally important task given that voters sometimes struggle to know what level of government to target their efforts (e.g., Mettler Reference Mettler2011; Pierson Reference Pierson1993; Sances Reference Sances2017).
Our outcomes come from two primary sources. First, to see whether school shootings encourage citizens to register to vote, we use data from a nationwide voter file. The voter file is from the Data Trust—an analytics firm that obtains state voter files in the same way as other voter firms (e.g., Catalist). This file contains registration histories of approximately 200 million individuals in the United States. Whereas other firms share 1% samples of their voter files, we have the entire Data Trust file for all 200 million individuals. This data benchmarks well to measures from official sources on a number of dimensions (Fraga, Holbein, and Skovron Reference Fraga, Holbein and Skovron2018).Footnote 9 With this dataset, our dependent variable is registrations per county day. We collapse to this level because we do not observe all nonregistrants, making an analysis at the individual-day level not possible. Our voter file contains voter daily registration records for 45 states (plus D.C.) from the beginning of 2006 to the beginning of 2016.Footnote 10
Second, we use data on rates of voter turnout and electoral results at the county and Congressional District level. Dave Leip’s atlas of county-level electoral results for general elections allows us to analyze county-level turnout, county-level two-party vote share in Gubernatorial (i.e., state) and House (i.e., federal) elections, and rates of unchallenged candidates across political parties. In another dataset, we look at incumbency reelection rates. In this sample, our unit of analysis is the Congressional District-year. Finally, to test whether school shootings’ potential effects occur at the local level, we use data collected on local legislative elections collected by de Benedictis-Kessner and Warshaw (Reference de Benedictis-Kessner and WarshawForthcoming). Though local elections data is notoriously hard to collect at scale, this dataset provides us with a large sample of the fraction of local seats that are controlled by Democrats in a particular county after an election.
Methods
To evaluate the effect of school shootings on patterns of citizen information acquisition and voter registration, we use regression discontinuity (in time) and panel methods. Our first identification strategy leverages the timing of school shootings. This is possible given that we have daily measures of registration counts in our samples, as well as the exact date school shootings happened. This methodological approach employs a regression discontinuity design. As has been well established, regression discontinuity designs (RDDs) leverage as-good-as-random variation and continuity in potential outcomes around an arbitrary cutoff (e.g., Calonico, Cattaneo, and Titiunik Reference Calonico, Cattaneo and Titiunik2014). The RDD that we use in this paper rests on the assumption that the precise timing of shootings is arbitrarily defined and determined orthogonal to individuals’ registration patterns within a narrow bandwidth of days around the shooting. Given that school shootings are unanticipated by the public, we think this is a reasonable theoretical assumption.Footnote 11 In some model specifications, we look for effects nationwide, in others we look only close to the shooting itself. To control for potential seasonality in patterns of voter registration, we control for the lag number of registrations. This makes our estimates equivalent to a differences-in-discontinuities design (e.g., Millán-Quijano Reference Millán-QuijanoForthcoming). In our models, we look for effects among all citizens and then break our estimates by political party and age.Footnote 12 We do so because of the aged-based dynamics of protest-led movements related to gun control (e.g., March for Our Lives) and given that downstream electoral effects hinge (perhaps in-part) on differential patterns of registration. (Effects on vote share could also come because of persuasive effects.)
With our other datasets, we employ a difference-in-differences design.Footnote 13 In our base specifications, we include county and year fixed effects (i.e., the canonical “two-way fixed effects” design). These allow us to absorb difficult-to-observe factors that remain constant within counties over time and are shared within electoral cycles. Though this is the most common approach to estimating a difference-in-differences model, there are econometric reasons why a two-way fixed effects design may be insufficient for identifying the causal effect of school shootings. After all, scholars have recently used proofs, simulations, and applied examples to show that two-way fixed effects often struggle to obtain causal effects of interest (Goodman-Bacon Reference Goodman-Bacon2018; Imai and Kim Reference Imai and Kim2019; Kropko and Kubinec Reference Kropko and Kubinec2020; Wing, Simon, and Bello-Gomez Reference Wing, Simon and Bello-Gomez2018). Given this, our preferred difference-in-differences models include county, year, and individual time trends for each county.Footnote 14 This is a standard recommendation in the difference-in-difference literature (Angrist and Pischke Reference Angrist and Pischke2008, 204; Wing, Simon, and Bello-Gomez Reference Wing, Simon and Bello-Gomez2018). It controls for differential trends across counties over time. This approach allows us to relax the tenuous parallel trends assumption key to difference-in-differences specifications. Here our identifying assumption is that our outcomes deviate from county-year effects by following the trend captured by the interaction of time with each county. Under this assumption, identification comes from sharp deviations from otherwise smooth county-specific trends. As was mentioned in the last section, in our difference-in-differences models we code treatment in several ways that take into account the timing and location of school shootings and look at exposure to these tragedies in several different ways.
In addition to this approach, we run numerous robustness checks that, for the sake of space, we provide in the Online Appendix. These include restricting our models to include control counties that are closer to treatment (to make the comparison group even more similar to the treatment group; see Figures A5 and A6), taking into account the timing of shootings relative to Election Day (Figure A7), shifting the range of years included in estimation (Figure A11), shifting the shootings included in our estimation process (i.e., including odd-year shootings along with shootings that occur during the same calendar year as the even-year elections in our sample; Figures A15 and A16), and looking for polarizing effects rather than just average treatment effects (Figure A12). These all point in the same direction (i.e., towards null effects).
Results: Voter Registration
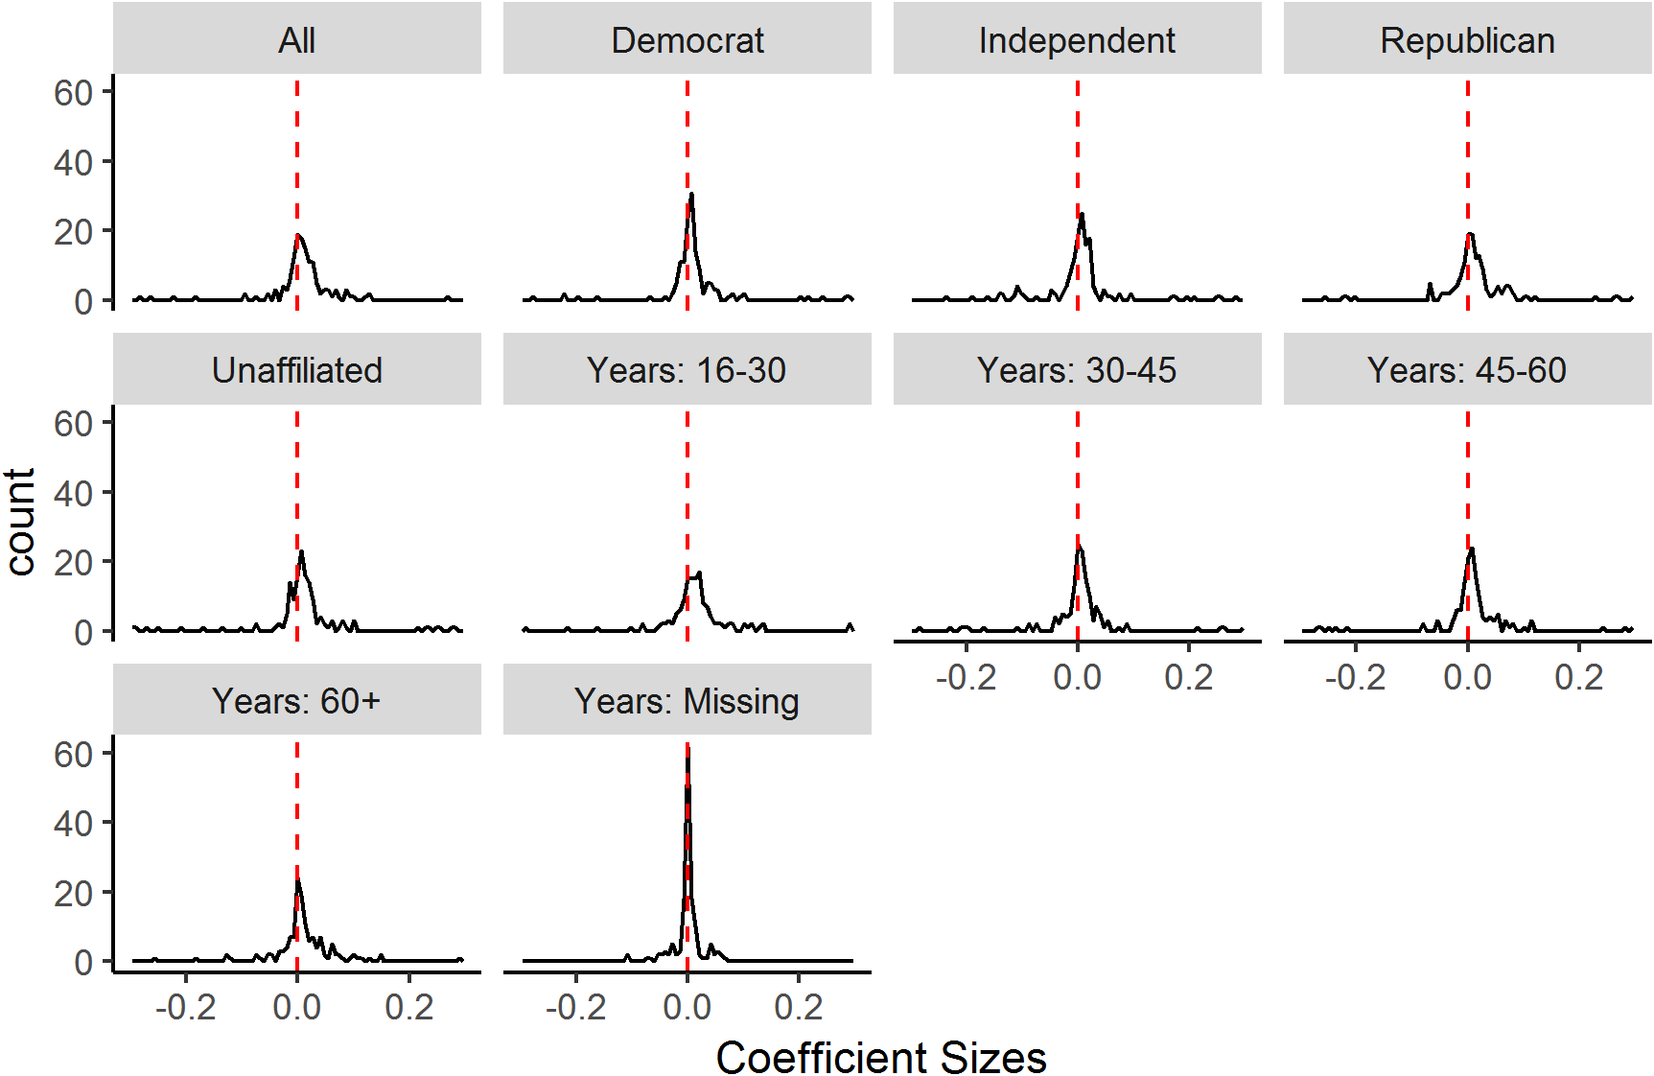
We first examine the effect of school shootings on voter registration from our nationwide single-cutoff RDD models. We note that we have an abundance of statistical power in this analysis. As a result, we focus on the substantive significance of our estimates. In addition, because presenting 147 coefficients (i.e., one for each shooting in our time frame) is unwieldy, we present our results with kernel densities while also providing details on these distributions.
In Figure 2, we plot the distribution of (standardized) effect sizes across our 147 single-cutoff RDD models. Each facet focuses on a different subgroup, with the “All” panel showing the distribution of coefficients among the pooled sample. The distribution of effect sizes is spiked and centered at zero. When looking at all individuals, the median effect size is a paltry 0.7% of a standard deviation (mean effect = 1.5% of a SD). Figure 2 also shows another illuminating point; the effects are tightly centered around and roughly evenly balanced around zero for the full sample and the various subgroups. The largest effect is among young people—perhaps as we would expect given that school shootings most directly affect young people among these subgroups and the youth-driven nature of recent gun control discussions. However, even this median effect is very small (1.1% of a standard deviation). Moreover, the distribution of effects for Republicans (median = 0.7% of a standard deviation) and Democrats (median = 0.5% of a standard deviation) are similar.
RDD Estimates of the Effect of School Shootings on Voter Registration

Further, using equivalence testing (Hartman and Hidalgo Reference Hartman and Hidalgo2018), we can rule out meaningful effects. By Cohen’s (Reference Cohen1969) rule of thumb (20% of a standard deviation of an effect is small, 50% is medium, and 80% is large), 91.1% of our estimates are small and the rest are medium in size (none are large). By more recent standards—which use 36% of a standard deviation (Hartman and Hidalgo Reference Hartman and Hidalgo2018)—98% of our estimates qualify as not being substantively meaningful (pooled sample). These vary some, but not much, across our subgroups, with all groups having somewhere between 91% and 96% (Cohen’s standard) and 95–100%—Hartman and Hidalgo’s (Reference Hartman and Hidalgo2018) small or nonsubstantive effect sizes. Given that most of the theories revolving around the effect of shootings anticipate a mobilizing/positive effect, it is also important to note that only 2/147 effects (1.4%) clear the (adjusted) significance levels, are positive, and are substantively meaningful (by Hartman and Hidalgo’s [Reference Hartman and Hidalgo2018] standard).Footnote 15 Finally, larger tragedies with more fatalities are just as likely to elicit negative effects as positive effects. In short, these results suggest that school shootings have—if anything—very small to nonexistent effects on voter registration.
Results: Voter Turnout
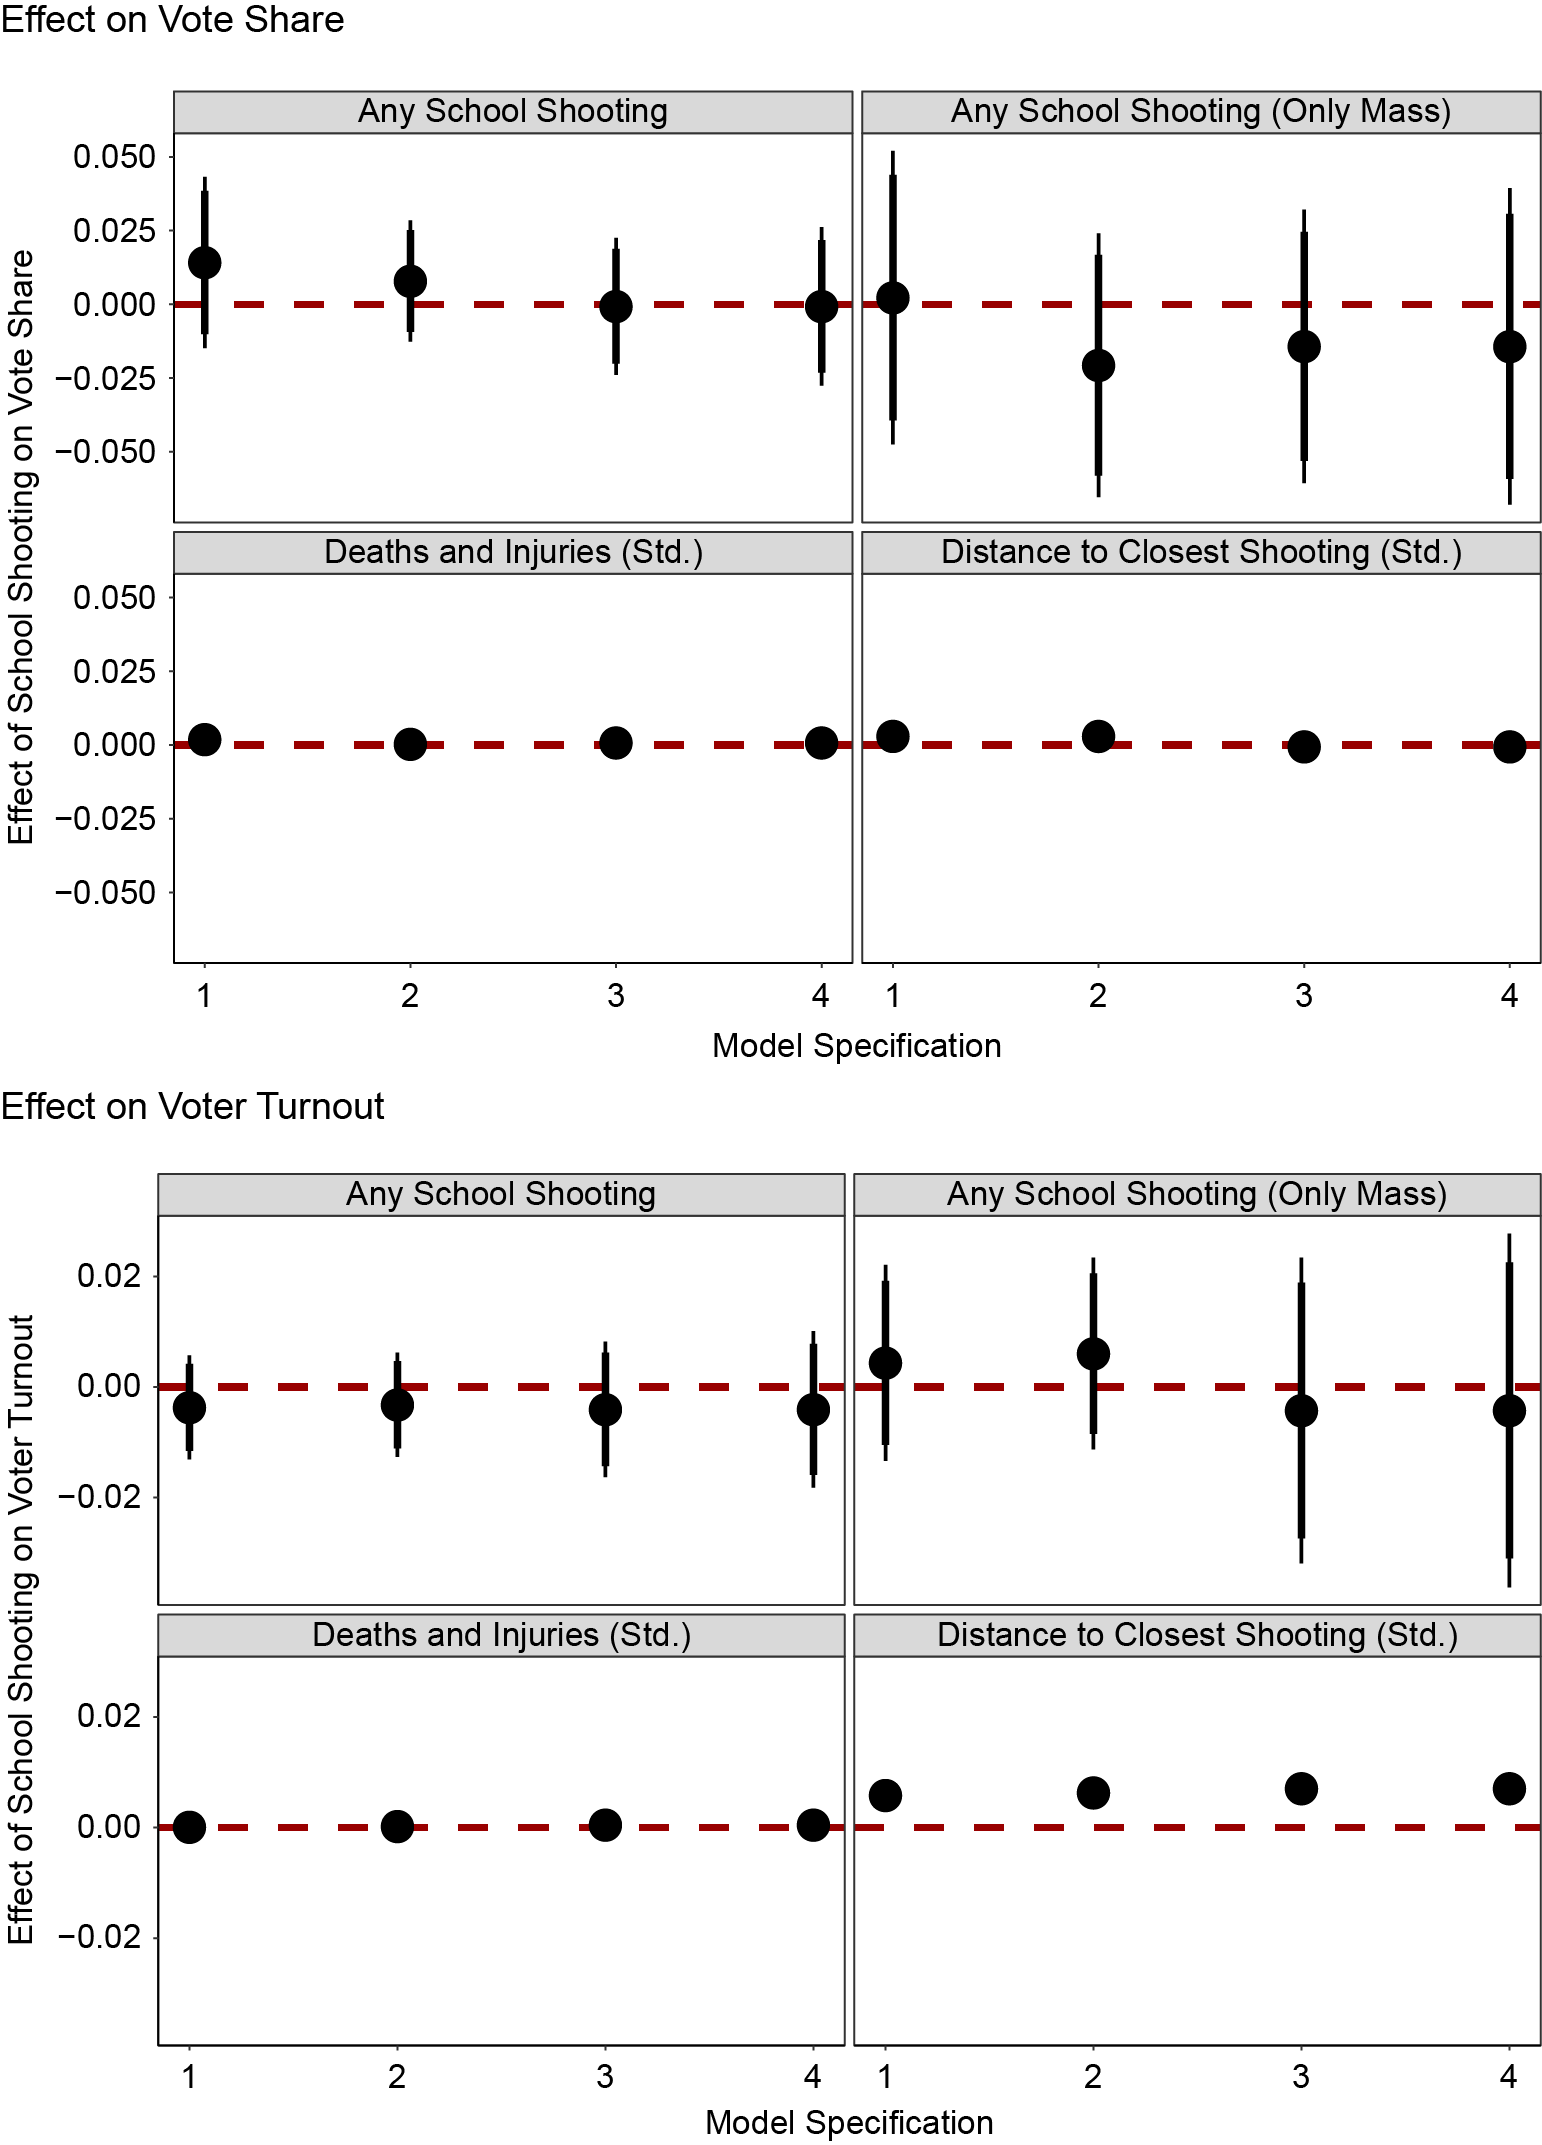
Despite not registering new voters immediately after a shooting, shootings could mobilize individuals who are already registered to show up and vote. Panel [A] of Figure 3 shows the results from difference-in-differences models on voter turnout. It shows that school shootings exhibit little to no effect on the fraction of individuals voting. Across the 16 model specifications (four different treatments by four difference-in-differences specifications), four (25%) are significant. These are all with the distance to closest shooting (standardized) variable. This is more than we would expect by random chance; however, the turnout effects are small and, because of our large sample, allow us to rule out large substantive effects. The estimates from our difference-in-differences model specifications are also equally balanced around zero. (This variation in effect directions/sizes illustrates the importance of running various (standard) robustness checks when one uses a difference-in-differences to study the effect of shootings on the electorate.) The median estimate indicates that school shootings right before the election increase turnout by only 0.04 percentage points. To put this into perspective, this effect is only 25% the size of a standard get-out-the vote mailer—one of the least effective voter mobilization techniques (see Green, McGrath, and Aronow Reference Green, McGrath and Aronow2013; they estimate a standard mailer increases turnout by a mere 0.162 percentage points).Footnote 16 Using equivalence testing, we can confidently rule out effects as small as 3 percentage points in all specifications (and in most specifications we can rule out effects smaller than that). Figure A14 shows that our models are able to rule out Hartman and Hidalgo’s (Reference Hartman and Hidalgo2018) meaningful effect sizes in all cases. In short, school shootings have (at best) small/nonconsequential positive effects on voter turnout, but more than likely school shootings have no effect at all.
Effect of School Shootings on Voter Turnout and Vote Share

Results: Vote Share (Federal Elections)
The second panel in Figure 3 shows that effects on vote shares (at the Federal level) are also unlikely. Across the 16 model specifications (four different treatments by four difference-in-differences specifications) shown in Panel [B], only 1 (6.3%) is significant. Moreover, the effects on Democratic Party vote share are small and we can rule out any substantive effects because of the large sample (especially when considering our continuous treatment measures). The coefficient estimates are equally distributed around zero. The average estimate indicates that school shootings decrease Democratic vote share by a paltry 0.1 percentage points. To put this into perspective, only 26 total counties (0.2%) in the sample period had an election within this margin. Figure A13 shows that our models are able to rule out Hartman and Hidalgo’s (Reference Hartman and Hidalgo2018) meaningful effect sizes in all cases. For almost all elections, school shootings’ effects are totally inconsequential in determining the election, if they have any effect at all.
Our robustness checks found in the Appendix corroborate this conclusion. Though some model specifications indicate that school shootings have a noticeable effect on Democratic vote share, these effects are the exception rather than the rule, appear most often in the weakest model specifications (i.e., those with two-way fixed effects but nothing else), and disappear with standard robustness checks. School shootings have little to no effect on federal election outcomes.
Results: Vote Share (State and Local Elections)
However, readers might wonder whether school shootings affect state and local, instead of federal, elections. After all, which elected officials (if any) citizens should hold accountable for school shootings is ambiguous—though the federal government exerts substantial control over gun policy (Goss Reference Goss2010), state and local governments have substantial control over school policies specifically and citizens often respond as such (Holbein Reference Holbein2016; Holbein and Hassell Reference Holbein and Hassell2019)
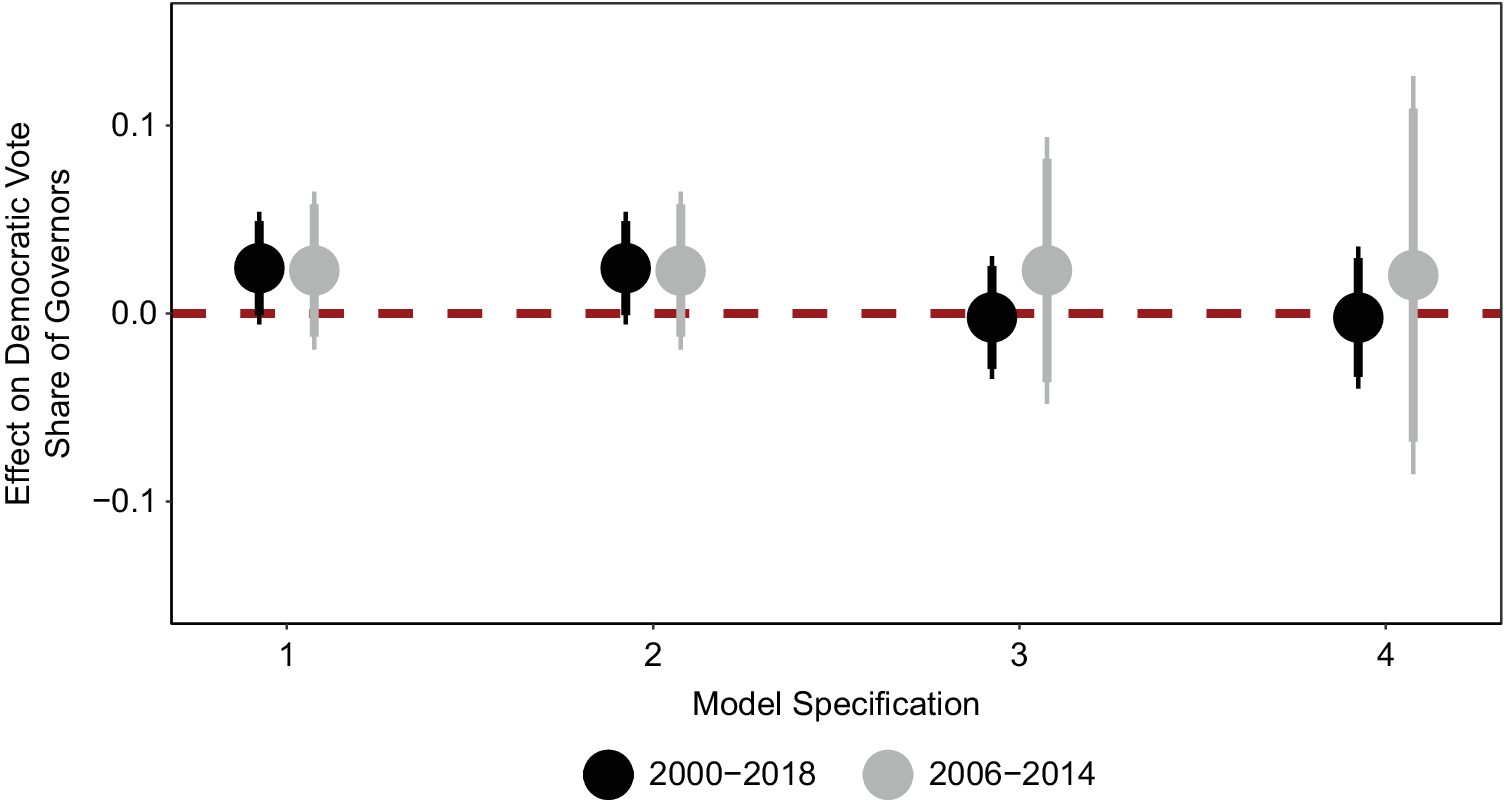
At first blush, the first two estimates on the left of Figure 4 (i.e., the ones with two-way fixed effects and various controls) suggest that shootings may have an effect on gubernatorial elections.Footnote 17 These effects are not quite significant at traditional levels, but they are close (t = 1.6), are positive, and are modest in size (equivalent to a 2.4 percentage point gain for Democrats). However, these effects disappear once we add time trends to our models. The results in models 3 and 4 (linear and quadratic time trends) are less than 10% the size of those in models 1 and 2 (two-way fixed effects) and are no longer close to statistically significant (t = –0.1).
Effect of School Shootings on State Government Elections

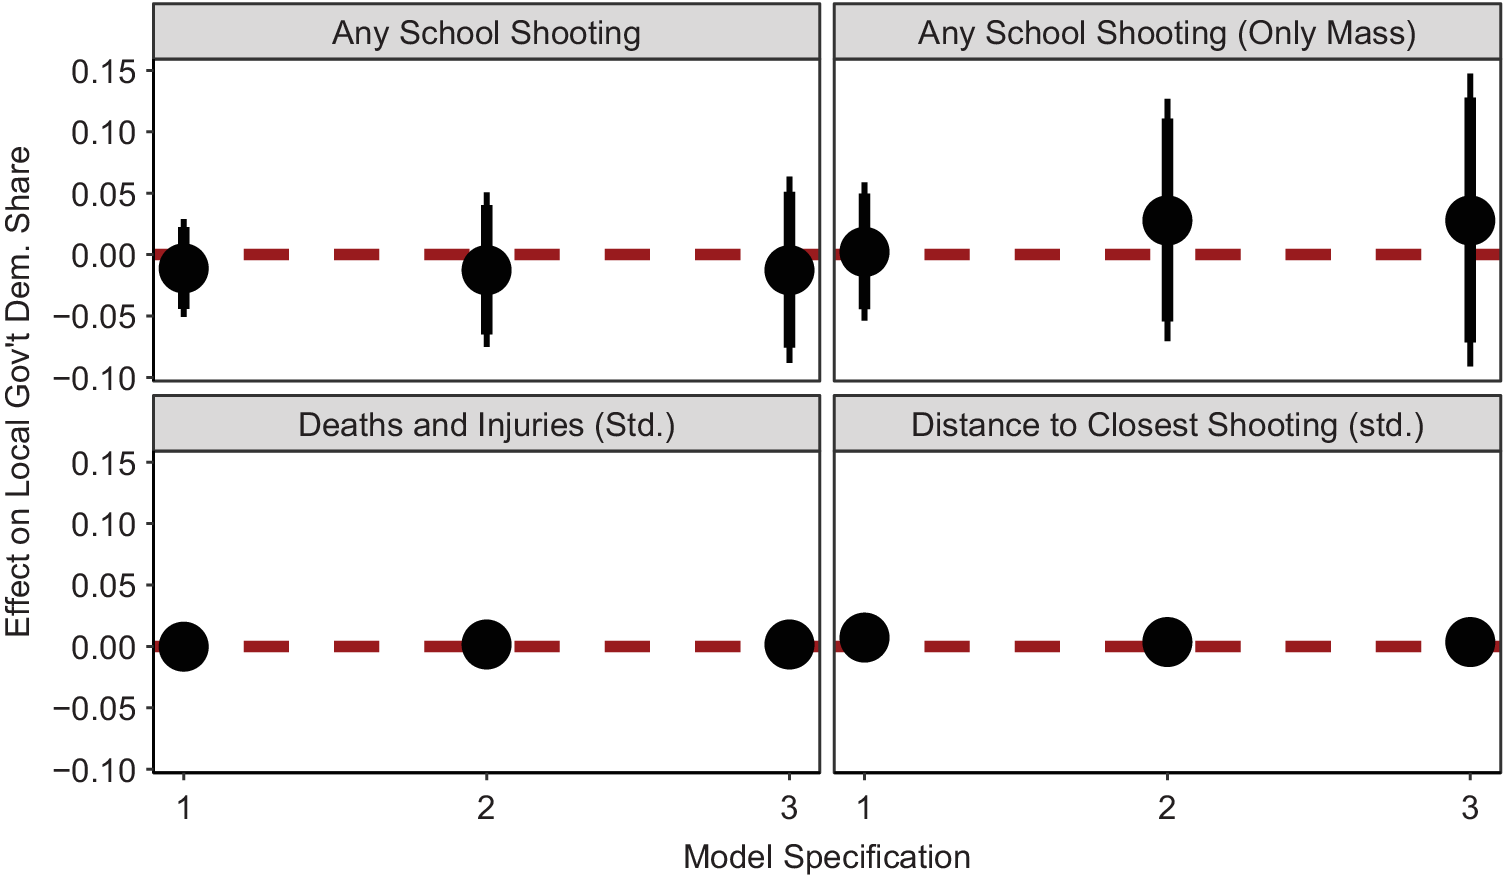
Figure 5 shows likewise that there is no effect on the dynamics of local elections. None of the effects are significant, and all allow us to rule out any substantial effects. As best we can tell, school shootings have no effect on local or state elections either.
Effect of School Shootings on Local Government Elections

Results: Candidates Running and Incumbent Reelection Rates
Some may wonder—despite having no effect on registration, turnout, and vote share (across local, state, and federal levels)—whether shootings have any effect on other dynamics of elections, such as the number of candidates who run unchallenged in races or incumbents’ chances of being reelected. Perhaps school shootings cause candidates—as a whole or of one political party or the other individually—to be more or less likely to challenge and defeat incumbents. Or perhaps voters punish incumbents across the board for school shootings.
Figures A8–10 and A18 in the Online Appendix show that this, too, is not the case. In all cases, the effects are small, not significant, and not robust to standard changes in model specification, and equivalence testing allows us to rule out meaningful effects.
School shootings, despite their salience to the public and their connection to the acts of government, have little to no effect on patterns of voter registration, turnout, election outcomes, or the other dynamics of elections. Simply put, school shootings do not affect elections in the U.S.
Conclusion
Our results suggest that school shootings alone (at least those in recent memory) do not place electoral pressure on elected officials. Shootings also have little to no systematic, or heterogeneous, effect on voter registration; voter turnout; or the dynamics of local, state, or federal elections. While school shootings are tragedies that that appear to act as focusing events (Kingdon Reference Kingdon1984) that spark interest in gun control (see Figure A1) and (perhaps) shift public opinion, they are not sufficient to change electoral behavioral to pressure elected officials via elections.
That shootings have small to nonexistent effects does not diminish the substantive importance of our findings. Our estimates come in an area that has broad theoretical and policy interest and that has been, to this point, unanswered. Our estimates are well powered, which allows us to draw clear conclusions. Our results help to show, on a more micro level than previously possible, that there are not electoral implications for gun violence. Our results provide a potential answer for why school shootings have not resulted in a change in gun legislation (either for more or for less control) and, perhaps by extension, why elected officials have not been legislatively responsive to gun violence—that is, because they face minimal electoral backlash.
More broadly, our work adds to our understanding of what sparks electoral accountability. For all their implications for policy and citizen well-being, school shootings do not affect vote choice or electoral outcomes. This is a substantial theoretical contribution given the state of the retrospective voting literature, which has up to this point been dominated by successful instances of negative events sparking retrospective voting. In providing an empirical example of an instance when retrospective voting does not occur—in spite of having the conditions that many have theorized will be sufficient to spark retrospective voting—we help push forward our understanding of what factors encourage accountability responses from the public. In this paper, we provided an example that showed that sometimes even when events are profoundly tragic, are highly-covered by the media, have high degrees of issue salience, spark citizen interest in the given policy domain, generate a public outcry, are clearly connected to government action, and (perhaps) shift public opinion (conditions long thought to be sufficient), these favorable conditions may still not be enough to elicit electoral accountability.
If these conditions are insufficient to alone generate retrospective voting, what boxes must one check to ensure an accountability response from citizens? While answering this question definitively here is not possible, we do think it is important to note that there are some obvious first-order candidates. First, in understanding whether retrospective responses are likely to occur it is important to consider non-citizen actors and the broader political climate, specifically the role of interest groups. Taking gun violence as an example, it’s impossible to ignore the potential role of large-scale organizations that fight over the direction of policy around gun control and pour millions of dollars each year into shaping the narrative that comes out of mass shootings and into ensuring electoral outcomes occur that favor their cause. In focusing on citizen capacity, the retrospective voting literature has spent less time studying the organizations and institutions that constrain what citizens can and will do. Perhaps interest groups fundamentally shape retrospective responses.
Second, the retrospective voting literature would do well to think more about the connection between potential attitudinal shifts and behavioral shifts. Public opinion research has played a key role in teaching us how citizens respond to information signals, especially in contexts (like school shootings) where there is often cross-pressured messaging (e.g., Chong and Druckman Reference Chong and Druckman2007a, Reference Chong and Druckman2007b, Reference Chong and Druckman2007c). Retrospective voting studies should build more from public opinion research. Drawing on public opinion research, perhaps retrospective voting is more likely to occur when messaging is clearly aligned and cross-pressures are minimized.
Our work does have important limitations. While we are able to look for effects by various relevant subgroups, it is possible that our effects are masking variation by important previously unconsidered subdimensions that we cannot observe in the voter files and our election outcomes panel. Our work also cannot rule out the possibility of an effect in a shooting on a scale larger than what we have observed over the covered period (30 deaths). Finally, we have not explored non-electoral forms of civic participation (e.g., donations and online discussions). However, any effects in these domains should be viewed understanding that any effects do not trickle downstream to election results.
Future work should explore why shootings elicit small to nonexistent effects on elections. There remains much work to understand whether the non-effects of school shootings on elections are due to citizen apathy, mobilization and demobilization of both sides of the gun control debate, shortness of the issue-attention cycle, the sheer number of mass shootings overwhelming citizens and normalizing this type of violence, cross-cutting media coverage, citizens viewing elected officials as not responsible for school shootings, a combination of these forces, or something else entirely. While the exact mechanisms are not clear, this much is: school shootings do not mobilize the public electorally nor do they shape American electoral outcomes.
Supplementary Materials
To view supplementary material for this article, please visit http://dx.doi.org/10.1017/S0003055420000635.
Replication materials can be found on Dataverse at: https://doi.org/10.7910/DVN/YF761K.




Comments
No Comments have been published for this article.