Introduction
The gadolinite-supergroup includes phosphates, beryllophosphates, berylloarsenates, borosilicates and beryllosilicates (Bačík et al., Reference Bačík, Miyawaki, Atencio, Camara and Fridrichová2017). Beryllosilicates are the most commonly found in Nature (e.g. Grew and Hazen, Reference Grew and Hazen2014), are most numerous within the supergroup (8 out of 14 minerals) and belong to the gadolinite subgroup (Bačík et al., Reference Bačík, Miyawaki, Atencio, Camara and Fridrichová2017). Gadolinite-subgroup minerals (‘gadolinites’) have the general chemical formula of A 2MBe2Si2O8φ2 (Bačík et al., Reference Bačík, Miyawaki, Atencio, Camara and Fridrichová2017), where A = Ca, rare earth elements [Y + lanthanides (Ln) = REE], Bi, etc.; M = Fe, vacancy, Mn, etc.; and φ = O, OH and F. The crystal structure of ‘gadolinites’ (space group P21/c) is usually described as alternating layers of tetrahedra (SiO4 + BeO4) with layers consisting of AO6φ2 tetragonal antiprisms and MO4φ2 octahedra. The tetrahedra form sheets with alternating four- and eight-membered rings, whereas the tetragonal antiprisms and octahedra, connecting to each other, fill the interlayer space (Foit and Gibbs, Reference Foit and Gibbs1975; Bačík et al., Reference Bačík, Miyawaki, Atencio, Camara and Fridrichová2017). It is worth noting that according to the data available, the A site is always fully occupied, whereas the M site could be both occupied or vacant (Bačík et al., Reference Bačík, Miyawaki, Atencio, Camara and Fridrichová2017).
Natural ‘gadolinites’ are typically represented by a complex solid solution, which in most cases precludes unambiguous crystal structure refinement as up to 10 cations could be present at the M and/or A crystallographic site simultaneously (e.g. Demartin et al., Reference Demartin, Pilati, Diella, Gentile and Gramaccioli1993; Cooper et al., Reference Cooper, Hawthorne, Miyawaki and Kristiansen2019). For this reason, a number of synthetic analogues of ‘gadolinites’ have been obtained; they contain REE, Mg, Mn, Ni, Co, Zn, Cu, Cd and Ga (e.g. Ito, Reference Ito1965; Reference Ito1966; Reference Ito1967). Based on the data on natural and synthetic compounds, one can conclude that large cations (e.g. REE ; r i > 1 Å; Shannon, Reference Shannon1976) tend to occupy the A site in the crystal structure, whereas smaller cations (e.g. Fe2+, Mn2+, Mg; r < 1 Å; Shannon, Reference Shannon1976) occupy the M site only (Ito and Hafner, Reference Ito and Hafner1974; Foit and Gibbs, Reference Foit and Gibbs1975). However, there is one exception: according to the Commission on New Minerals, Nomenclature and Classification (CNMNC) of the International Mineralogical Association (IMA), minasgeraisite-(Y) contains a relatively large Ca cation (r = 1 Å; Shannon, Reference Shannon1976) at the M site (Y2CaBe2Si2O8O2; Foord et al., Reference Foord, Gaines, Crock, Simmons and Barbosa1986). As Foord et al. (Reference Foord, Gaines, Crock, Simmons and Barbosa1986) did not conduct a detailed crystallographic investigation, Demartin et al. (Reference Demartin, Minaglia and Gramaccioli2001) and Bačík et al. (Reference Bačík, Fridrichová, Uher, Pršek and Ondrejka2014, Reference Bačík, Miyawaki, Atencio, Camara and Fridrichová2017) have questioned the very existence of minasgeraisite-(Y). Further, the mineral has not been reinvestigated since, which is partly due to its rarity (Cooper and Hawthorne, Reference Cooper and Hawthorne2018).
Minasgeraisite-(Y) was discovered in the Jaguaraçu Pegmatite, Minas Gerais, Brazil (Foord et al., Reference Foord, Gaines, Crock, Simmons and Barbosa1986), and subsequently reported from the Krenn quarry, Matzersdorf/Tittling, Germany (Habel and Habel Reference Habel and Habel2009), Vlastějovice region, Czech Republic (Novák et al. Reference Novák, Kadlec and Gadas2013) and Rigó Hill, Hungary (Zajzon et al., Reference Zajzon, Szakáll, Kristály, Váczi and Fehér2015), but in neither case (except the type locality) does the reported composition correspond to the ideal minasgeraisite-(Y) end-member, and the structural data are not provided. According to Grew and Hazen (Reference Grew and Hazen2014), minasgeraisite-(Y) could be considered as a mineral occurring only at the type locality.
Interestingly, there are two separate publications on Bi-rich ‘gadolinite’ from the Jaguaraçu Pegmatite: the first (Foord et al., Reference Foord, Gaines, Crock, Simmons and Barbosa1986) contains a description of minasgeraisite-(Y) (including inductively coupled plasma atomic emission spectroscopy data of the bulk sample and the unit cell parameters obtained by a Gandolfi camera) and the second (Copper and Hawthorne, 2018) is devoted to the crystal-structure refinement of ‘minasgeraisite-(Y)’ (but no data on crystal chemistry are provided). Cooper and Hawthorne (Reference Cooper and Hawthorne2018) revealed the lowering of the symmetry (from P21/c to P1) of ‘minasgeraisite-(Y)’ and showed no evidence of Ca at the M site. In addition, a discrepancy in the unit cell parameters calculated by Foord et al. (Reference Foord, Gaines, Crock, Simmons and Barbosa1986) and Cooper and Hawthorne (Reference Cooper and Hawthorne2018) was observed.
The high-temperature (HT) behaviour of ‘gadolinites’ could provide information on both their formation conditions (HT stability) and changes caused by the rising temperature (cation order / disorder and / or mineral recrystallisation). It has been shown previously that Th, U-rich metamict ‘gadolinites’ recrystallise under HT conditions, which makes the study of their crystal structure possible (e.g. Gibson and Ehlmann, Reference Gibson and Ehlmann1970; Malczewski and Janeczek, Reference Malczewski and Janeczek2002; Paulmann et al., Reference Paulmann, Zietlow, McCammon, Salje and Bismayer2019). However, gadolinite-(Y) is the only ‘gadolinite’ which has been thoroughly studied in HT conditions (Paulmann et al., Reference Paulmann, Zietlow, McCammon, Salje and Bismayer2019; Gorelova et al., Reference Gorelova, Panikorovskii, Pautov, Vereshchagin, Krzhizhanovskaya and Spiridonova2021a).
The sample used for the current study was given to us (A.V.K.) by Roy Kristiansen (Sellebakk, Norway), who, in turn, had obtained it from R.V. Gaines, the second author of the original article by Foord et al. (Reference Foord, Gaines, Crock, Simmons and Barbosa1986). However, following Cooper and Hawthorne (Reference Cooper and Hawthorne2018) we put minasgeraisite-(Y) in quotation marks, thus indicating that the material under investigation may not be minasgeraisite-(Y).
The aim of the current work was to (1) re-investigate ‘minasgeraisite-(Y)’ from the Jaguaraçu Pegmatite, Minas Gerais, Brazil (type locality) in order to obtain data on both the elemental composition and the crystal structure of the same crystal and (2) study the high-temperature crystal chemistry of ‘minasgeraisite-(Y)’ compared to closely related gadolinite-supergroup minerals.
Materials and methods
Two loose aggregates of ‘minasgeraisite-(Y)’ crystals from the Jaguaraçu Pegmatite, Minas Gerais, Brazil were used for the study. Optically they were euhedral, violet and transparent with an approximate size of <100 μm.
Raman spectra were collected from unpolished crystals using a LabRam HR 800 (Horiba Jobin-Yvon, Kyoto, Japan) spectrometer equipped with a BX-41 (Olympus, Tokyo, Japan) microscope and a back-scattered geometry system in ambient conditions using a 532 nm laser. The confocal hole was 100 μm, and the 1800 gr/mm grating was used. The Raman spectra of the unoriented sample were recorded in the range of 70–4000 cm–1 at a resolution of 2 cm–1 and 30 s acquisition time. The laser power was focused on the point of size ~2 μm2 by 100× objective. To improve the signal-to-noise ratio, the number of acquisitions was set to 5.
The single-crystal X-ray diffraction (SCXRD) analysis was performed using a Rigaku XtaLAB Synergy-S (Rigaku Oxford Diffraction, Japan) diffractometer equipped with a HyPix-6000HE detector with monochromated MoKa radiation (0.71073 Å) at 50 kV and 40 mA. More than a hemisphere of three-dimensional data was collected with the frame widths of 0.5–0.75°, depending on the temperature. For the experiments under ambient conditions, two single crystals with an approximate size of 40 μm × 40 μm × 30 μm were mounted on a polymer loop using Paraton-N. Both crystals under investigation have similar quality and chemical composition (see below), so one of them was chosen for high-temperature studies. The thermal behaviour of the crystal under heating in air was studied in situ by high-temperature SCXRD using the same diffractometer equipped with a high-temperature FMB system (Oxford, UK). For these experiments, the same single crystal was mounted on the quartz glass fibre (for more details see Gorelova et al., Reference Gorelova, Panikorovskii, Pautov, Vereshchagin, Krzhizhanovskaya and Spiridonova2021a). SCXRD data were collected at different temperatures in the range of 27–1000°C with the temperature step 150°C below 600°C and 100°C above 600°C (there were 9 experimental points in total, including ambient temperature), temperature determination errors were ±10°C (see Gorelova et al., Reference Gorelova, Vereshchagin, Aslandukov, Aslandukova, Spiridonova, Krzhizhanovskaya, Kasatkin and Dubrovinsky2022). The data were integrated and corrected for background, Lorentz, and polarisation effects. An empirical absorption correction based on the spherical harmonics implemented in the SCALE3 ABSPACK algorithm was applied in the CrysAlisPRO program (Agilent, 2012). The unit-cell parameters were refined using the least-square techniques. The SHELXL program package (Sheldrick, Reference Sheldrick2015) was used for all structural calculations. The calculation of the thermal-expansion parameters tensor and its visualisation was performed using the TTT program package (Bubnova et al., Reference Bubnova, Firsova and Filatov2013).
The elemental composition of the crystals used for SCXRD was analysed on the epoxy-mounted, polished, and carbon-coated sample by means of a scanning electron microscope (SEM), electron microprobe (EMP), and laser ablation system attached to an inductively coupled plasma-mass spectrometer (LA-ICP-MS). Energy-dispersive X-ray spectroscopy (EDS) analyses were performed on a S–3400 N (Hitachi, Japan) SEM equipped with an AzTec Energy XMax 20 (Oxford, UK) SSD detector with an accelerating voltage of 20 kV, beam current of 1 nA, and 1 μm beam diameter at the sample surface. EDS X-ray maps were obtained using 20 kV accelerating voltage, 1.5 nA beam current and 60 s dwell time.
The analyses in the wavelength-dispersive mode (WDS) were acquired by means of a SX-100 electron microprobe (Cameca, France) at 15 kV, 20 nA and 5 μm of beam diameter. The following natural and synthetic phases were employed for calibration: albite for Si, Al, wollastonite for Ca, fayalite for Fe, rhodonite for Mn, Mg2SiO4 for Mg, UO2 for U, YAG for Y, lammerite for Cu, gahnite for Zn, Ca5(PO4)3F for P, metallic Bi for Bi, and individual LnPO4 for lanthanoids. Peak counting times (CT) were 20 s for major elements and 60 s for minor elements; CT for each background was one-half of the peak time. A thorough WDS angle scan was performed prior to the analysis to inspect spectral interferences and guarantee the proper setting of the background positions. Spectral coincidences among lanthanides and other elements were corrected by empirically determined correction factors (see Škoda et al., Reference Škoda, Plášil, Jonsson, Čopjaková, Langhof and Galiová2015 for details). Raw intensities were converted to concentrations using X-PHI (Merlet, Reference Merlet1994) matrix-correction software.
The Be, B and Li contents were determined using a LA-ICP-MS consisting of a quadrupole based ICP-MS (Agilent 7900) connected to an ArF* excimer laser ablation system Analyte Excite+ (Teledyne CETAC Technologies). The laser ablation system emits a laser beam at a wavelength of 193 nm and is equipped with a 2-Volume Cell HelEx II. The ablated material was carried by He flow (0.5 and 0.3 l min–1) and mixed with Ar (~1 l min–1) prior to entering the ICP mass spectrometer. The sample surface of individual spots was ablated for 30 s per spot by a 25 μm laser beam diameter with the fluence of 5 J cm–2, 10 Hz repetition rate and 60 s washout time. The monitored isotopes are as follows: 7Li+, 9Be+, 10,11B+, 28,29Si+, 43, 44Ca+ and 89Y+.
The ICP-MS was tuned using a SRM NIST 612 with respect to the sensitivity and minimum doubly charged ions (Ce2+/Ce+ < 5%), oxide formation (248ThO+/232Th+ < 0.3%) and mass response 238U+/232Th+ ~ 1. The potential interferences were minimised via a collision cell (He 1 ml min–1). The elemental contents were calibrated using artificial glass standards SRM NIST 610 and 612, and Si as the internal reference element after the baseline correction and the integration of the peak area using HDIP software (Teledyne CETAC Technologies, Omaha, Nebraska, USA). The accuracy of Be and B measurements was controlled using well-defined homogenous internal reference materials and the data obtained by SCXRD data (see above). As the data on light elements (Be, B and Li) were obtained, it was possible to calculate the chemical formulae assuming that the sum of tetrahedral cations (Be+B+Si+Al+P) equals 4 (T+Q = 4). The number of (OH)-groups was charge balanced to keep the empirical formula electroneutral. As the content of Li2O was low (~0.01 wt.%), Li was excluded from the empirical formula calculation.
Results and discussion
Composition of Bi-rich ‘gadolinites’ from the Jaguaraçu Pegmatite
Back-scattered electron (BSE) photography showed that crystal aggregates are rosette-like; they are composed of separate platy crystals with a size 5–10 μm. Exceptionally, the size of the crystals exceeds 50 μm. These crystals are chemically heterogeneous in BSE images (Fig. 1a). The chemical analysis (EDS, WDS) and EDS mapping revealed that such chemical zonation is caused by the variable Bi (most prominent), Ca and Y (as a dominant REE) content (Fig. 1b–d). We have found an inverse correlation between Bi and Y (n = 13, r = –0.95) and Bi and Ca (n = 13, r = –0.72).
Chemical zonation in the studied crystal of ‘minasgeraisite-(Y)’: (a) back-scattered electron (BSE) image; (b) BiKα element-distribution map; (c) YKα element-distribution map; and (d) CaKα element-distribution map.

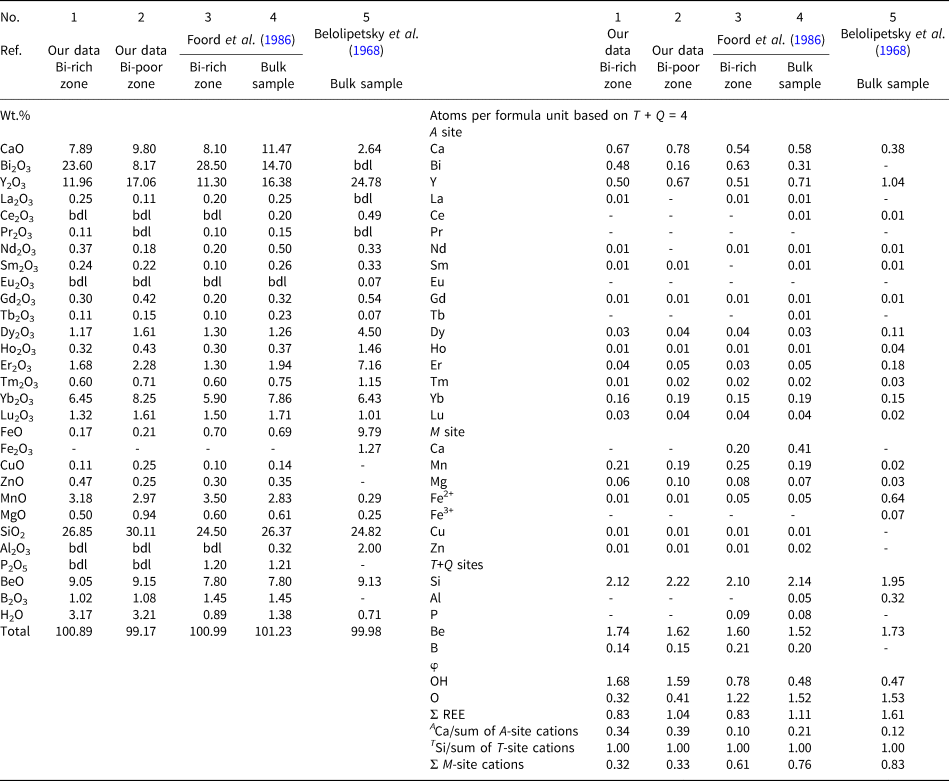
The WDS analysis of Bi-rich and Bi-poor zones of ‘minasgeraisite-(Y)’ from the Jaguaraçu Pegmatite are shown in Table 1. Interestingly, our calculations (Table 1) prove that both zones of the crystal at hand belong to the same mineral species, namely hingganite-(Y) (Fig. 2). The T site is occupied exclusively by Si (Si > 2 atoms per formula unit (apfu); Table 1), the Q site is occupied mainly by Be (Be > 1.62 apfu), the M site is mostly vacant (the sum of M site cations < 0.33), the A site is occupied mainly by Y (ACa/sum of A site cations < 0.39) and the φ site is OH dominant (OH > 1.34).
Selected data on gadolinite-subgroup minerals plotted on classification diagrams of the gadolinite supergroup: (a) for determination of groups and subgroups; and (b) for species determination. The legend for both graphs is given on the (b) graph. Refs: Belilopetsky et al. (Reference Belolipetsky, Pletneva, Denisov, Kulchitskaya and Belkov1968); Foord et al. (Reference Foord, Gaines, Crock, Simmons and Barbosa1968); Gorelova et al. (Reference Gorelova, Vereshchagin, Cuchet, Shilovskikh and Pankin2020), (Reference Gorelova, Panikorovskii, Pautov, Vereshchagin, Krzhizhanovskaya and Spiridonova2021a) Kasatkin et al. (Reference Kasatkin, Nestola, Škoda, Chukanov, Agakhanov, Belakovskiy, Lanza, Holá and Rumsey2020); Lyalina et al. (Reference Lyalina, Selivanova, Savchenko, Zozulya and Kadyrova2014); Škoda et al. (Reference Škoda, Plášil, Čopjaková, Novák, Jonsson, Galiová and Holtstam2018); Voloshin et al. (Reference Voloshin, Pakhomovsky and Sorokhtina2002).

Elemental composition and preliminary crystal-chemical formula for gadolinite-subgroup minerals from the Jaguaraçu pegmatite, Brazil (No 1–4) and Keivy pegmatite, Russia (No 5).

Note: bdl – below detection limit
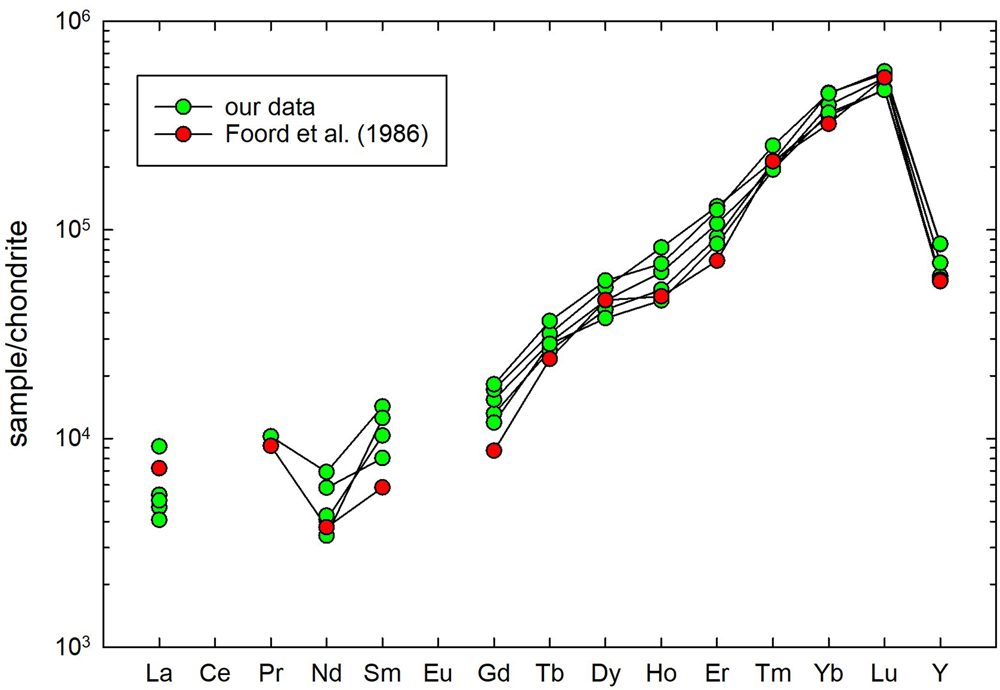
Generally, the sample under study has all the specific features of the composition of minasgeraisite-(Y) reported from the Jaguaraçu Pegmatite, except Ca excess at the M site (Table 1). It has a high Bi (0.16–0.48 apfu) and Mn (0.19–0.21 apfu) content, which is typical for minasgeraisite-(Y) (Foord et al., Reference Foord, Gaines, Crock, Simmons and Barbosa1986) and has not been encountered in any other ‘gadolinite’ localities. It contains a relatively high content of Yb, Er, and Dy and has a very limited amount of lighter lanthanides, which is quite unique and resembles the REE-pattern (Fig. 3) of minasgeraisite-(Y) (Foord et al., Reference Foord, Gaines, Crock, Simmons and Barbosa1986) and ‘gadolinites’ from Kola peninsula (e.g. Belolipetsky et al., Reference Belolipetsky, Pletneva, Denisov, Kulchitskaya and Belkov1968; Table 1). In addition, it has a very low Fe and Mg (both <0.1 apfu) content at the M-site, contains quite a small amount of B (<0.15 apfu) and almost no Li (~ 0.1 wt.% of Li2O) at the Q-site, which is also in accordance with the data of Foord et al. (Reference Foord, Gaines, Crock, Simmons and Barbosa1986).
Comparison of REE patterns of ‘gadolinites’ from Jaguaraçu pegmatite with those of Foord et al. (Reference Foord, Gaines, Crock, Simmons and Barbosa1986).

Raman spectra of ‘minasgeraisite-(Y)’ in comparison with other ‘gadolinites’
The Raman spectrum of ‘minasgeraisite-(Y)’ is shown on Fig. 4. The sample being investigated has a number of bands in the 100–1000 cm–1 region (Fig. 5). The most intense are 140, 179, 243, 350, 446, 519, 559, 625, 902, 973, 3224, 3353, 3532 and 3763 cm–1.
Raman spectrum of ‘minasgeraisite-(Y)’. The black line shows the experimental data, the grey line shows the peak deconvolution and the red line shows the calculated spectra.

Comparison of Raman spectra of gadolinite-subgroup minerals from this work with Kasatkin et al. (Reference Kasatkin, Nestola, Škoda, Chukanov, Agakhanov, Belakovskiy, Lanza, Holá and Rumsey2020) and Gorelova et al. (Reference Gorelova, Vereshchagin, Cuchet, Shilovskikh and Pankin2020).

The Raman bands at 140, 179 and 243 cm–1 are assigned to mixed lattice modes, 350 and 446 cm–1 – stretching vibrations of the AO4(OH)2 tetragonal antiprisms and MO4(OH)2 octahedra, 519 and 559 cm–1 – bending vibrations of the layer constituted by the SiO4 and BeO4 tetrahedra, 625 cm–1 – Be–O stretching vibrations, 902 and 973 cm–1 – Si–O stretching vibrations (Škoda et al., Reference Škoda, Plášil, Čopjaková, Novák, Jonsson, Galiová and Holtstam2018; Gorelova et al., Reference Gorelova, Vereshchagin, Cuchet, Shilovskikh and Pankin2020; Kasatkin et al., Reference Kasatkin, Nestola, Škoda, Chukanov, Agakhanov, Belakovskiy, Lanza, Holá and Rumsey2020). The bands at 3224, 3353, 3532 and 3763 cm–1 are attributed to the stretching vibrations of (OH)-units. Prominent bands related to the (OH)-stretching vibrations are in a good agreement with the chemical formula calculations. No Raman bands were observed in the range from 1000 to 3200 cm–1, which confirms the absence of CO32– and H2O groups.
The Raman spectrum of ‘minasgeraisite-(Y)’ has many similarities with the Raman spectra of other ‘gadolinites’ but is closer to hingganites (Table 2). Gadolinite-(Nd) (Škoda et al., Reference Škoda, Plášil, Čopjaková, Novák, Jonsson, Galiová and Holtstam2018) and -(Y) (Gorelova et al., Reference Gorelova, Panikorovskii, Pautov, Vereshchagin, Krzhizhanovskaya and Spiridonova2021a) have two intense Raman bands at ~900 and ~1000 cm–1, whereas the Raman bands in the spectra of hingganite-(Nd) (Kasatkin et al., Reference Kasatkin, Nestola, Škoda, Chukanov, Agakhanov, Belakovskiy, Lanza, Holá and Rumsey2020) and -(Y) (Gorelova et al., Reference Gorelova, Vereshchagin, Cuchet, Shilovskikh and Pankin2020) have similar intensities in all the range (except the OH region). However, the differences in the intensity of Raman bands can be attributed to the crystal orientation effects.
Main Raman bands (cm–1) in gadolinite-subgroup minerals.

Crystal structure of Bi-rich ‘gadolinites’ from the Jaguaraçu Pegmatite at ambient temperature
Both crystals of ‘minasgeraisite-(Y)’ under study demonstrate the typical features of ‘gadolinites’ and do not have significant differences (Table 1, Supplementary Tables S1, S2, and the crystallographic information files (cif) which have been deposited with the Principal Editor of Mineralogical Magazine and are available with Supplementary material, see below). Unfortunately, it was not possible for us to check the lowering symmetry in ‘minasgeraisite-(Y)’ due to the installed thermal plant and the relatively low quality of the crystals available.
The unit cell parameters of ‘minasgeraisite-(Y)’ studied by us are close to those obtained by Cooper and Hawthorne (Reference Cooper and Hawthorne2018), but higher than those reported by Foord et al. (Reference Foord, Gaines, Crock, Simmons and Barbosa1986). It is worth noting that Foord et al. (Reference Foord, Gaines, Crock, Simmons and Barbosa1986) obtained the unit cell parameters from powder XRD data, so their measurement is inimitable because it is impossible to get a similar ratio of REE and Bi due to the strong zoning. The bismuth content in ‘gadolinites’ from the Jaguaraçu Pegmatite varies from ~8 to ~28 wt.% Bi2O3 (Table 1). An increase in bismuth content is accompanied by yttrium content decrease. This means that the Bi-rich zone would have higher unit-cell parameters compared to the Y-rich zone as the Bi ionic radius is higher than that of Y ([VIII]r Y = 1.02, [VIII]r Bi = 1.17 Å; Shannon, Reference Shannon1976).
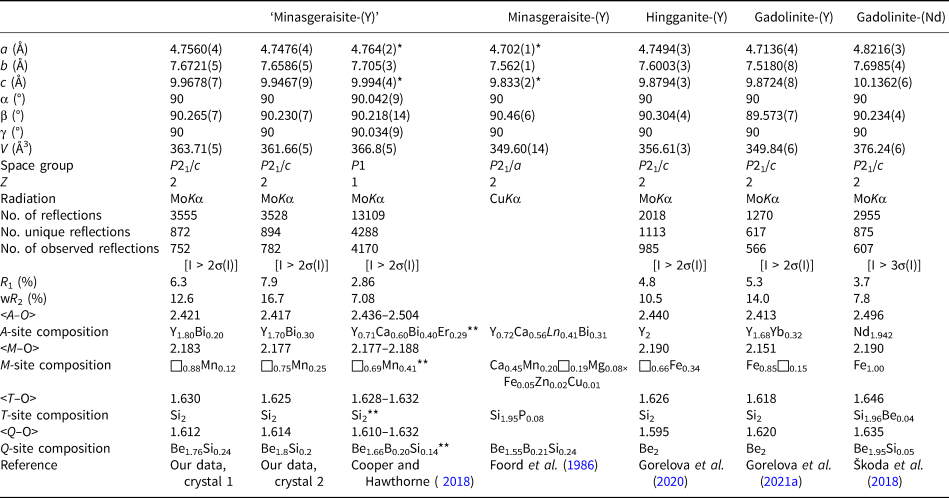
The data obtained on the geometry of the main polyhedra (Supplementary Table S2) clearly indicate the similarities between both our crystals of ‘minasgeraisite-(Y)’ and the crystal of ‘minasgeraisite-(Y)’ studied by Cooper and Hawthorne (Reference Cooper and Hawthorne2018). The mean <A–O> distance varies from 2.436 to 2.504 Å, which is close to the value in the crystal structure of gadolinite-(Nd) (2.496 Å; Škoda et al., Reference Škoda, Plášil, Čopjaková, Novák, Jonsson, Galiová and Holtstam2018). Our data match the observation of Cooper and Hawthorne (Reference Cooper and Hawthorne2018) who discovered that the low site-scattering at the M-site precludes the possibility of the M site to be Ca-dominant in ‘minasgeraisite-(Y)’. The mean <M–O> distance in the crystal structure of ‘minasgeraisite-(Y)’ (according to both our data and those of Cooper and Hawthorne (Reference Cooper and Hawthorne2018)) varies from 2.177 to 2.188 Å and falls within the range 2.151–2.200 Å reported for other ‘gadolinites’ with a variable Fe/Mg/Mn occupancy at the M site (Demartin et al., Reference Demartin, Minaglia and Gramaccioli2001; Gorelova et al., Reference Gorelova, Vereshchagin, Cuchet, Shilovskikh and Pankin2020). Interestingly, our observations indicate a necessary role of Mn (Tables 1, 3) besides the vacancy which dominates at the M site. Synthetic ‘gadolinite’ with the composition Y2MnBe2Si2O8O2 has already been reported (Ito, Reference Ito1965). This means that Mn could be the main cation at the M site and that Mn-dominant ‘gadolinites’ could be found in Nature. We think that detailed data on the crystal structure of synthetic ‘gadolinites’ should solve the issue relating to the M site occupancies by various cations. To date, only information on the crystal structure of Yb2NiBe2Si2O8O2 (Foit and Gibbs, Reference Foit and Gibbs1975) is available, though ‘gadolinites’ with various A- and M-site compositions (e.g. Gd2CdBe2Si2O8O2) have been synthesised (Ito, Reference Ito1965) they have not been studied in detail. As the cadmium ionic radius is very close to that of calcium ([VI]r Cd = 0.95, [VI]r Ca = 1.00 Å; Shannon, Reference Shannon1976) but much greater than the ionic radius of Fe2+ or Ni ([VI]r Ni = 0.78; [VI]r Ni = 0.69 Å; Shannon, Reference Shannon1976), it should be possible to check the interatomic distances and prove such an option (the M site occupied by a relatively large cation) in general.
Miscellaneous crystallographic data for ‘gadolinites’.

Note: * a and с parameters were transformed for comparison, ** A-, M-, Q- and T-site compositions are averaged for comparison.
According to our data and those of Cooper and Hawthorne (Reference Cooper and Hawthorne2018), the Q site demonstrates mixed occupancies, while the T site is fully occupied by Si. The mean <T–O> distances (1.625–1.631 Å) are typical for <Si–O> distances in the tetrahedra of ‘gadolinites’ (e.g. Demartin et al., Reference Demartin, Minaglia and Gramaccioli2001; Gorelova et al., Reference Gorelova, Vereshchagin, Cuchet, Shilovskikh and Pankin2020). Interestingly, the data on ‘minasgeraisite-(Y)’ show the presence of both Be and Si at the Q site, which is evident from the site scattering and the mean <Q–O> distances (1.610–1.632 Å). Previously, Demartin et al. (Reference Demartin, Minaglia and Gramaccioli2001) hesitated as to whether Si could occupy the Q site, however both the elemental composition and the crystal-structure refinement confirm Be for Si substitution (Table 1, 3) and are in agreement with the data of Allaz et al. (Reference Allaz, Smyth, Henry, Stern, Persson, Ma and Raschke2020). This observation indicates that the normalisation of the chemical formula of gadolinite-group minerals assuming Si = 2 apfu can generate false vacancies at the A and M sites and unbalance the OH–O occupation at the φ site.
The A site of gadolinite-group minerals can adopt relatively large cations with variable ionic radius: Ca = 1.12 Å, light Ln3+ = 1.16–1.10 Å, heavy Ln3+ = 1.03–0.98 Å and Y = 1.11 Å. The ionic radius of Bi3+ is 1.17 Å, which is very close to La3+. Due to the same charge of Bi and REE and similar ionic radii, Bi should fit well into the gadolinite structure, however, Bi is not a common element in gadolinite-group minerals. Its elevated content has only been reported from the Jaguaraçu pegmatite. The mineral under investigation exhibits a characteristic heavy-REE-enriched pattern (Fig. 3), nevertheless it contains a high content of large ions (Ca and Bi). Therefore, the <A–O> distance of minasgeraisite-(Y) is similar to that of gadolinite-(Nd) (Škoda et al., Reference Škoda, Plášil, Čopjaková, Novák, Jonsson, Galiová and Holtstam2018) due to the similarities in ionic radius for Bi and Ce with a light REE.
Minasgeraisite-(Y) probably crystallised from the late hydrothermal fluids enriched in heavy Ln3+, Ca, Bi, B, Be and Mn, but poor in Fe2+. The presence of late churchite-(Y), chernovite-(Y), agakhanovite-(Y) and the absence of Ce-dominant secondary minerals in the Jaguaraçu pegmatite testify for the heavy-REE-enriched character of the hydrothermal fluids. The heavy REE can be sourced from an alteration of an early formed magmatic heavy-REE mineral (euxenite-(Y)?). The absence of Fe and Ce in minasgeraisite could indicate an elevated f O2 in the fluids; Ce3+ oxidised to Ce4+, which precipitated before the formation of minasgeraisite-(Y) and Fe2+ oxidised to Fe3+, which rarely concentrates in gadolinite-group minerals.
High-temperature behaviour of ‘minasgeraisite-(Y)’ and other gadolinite-group minerals
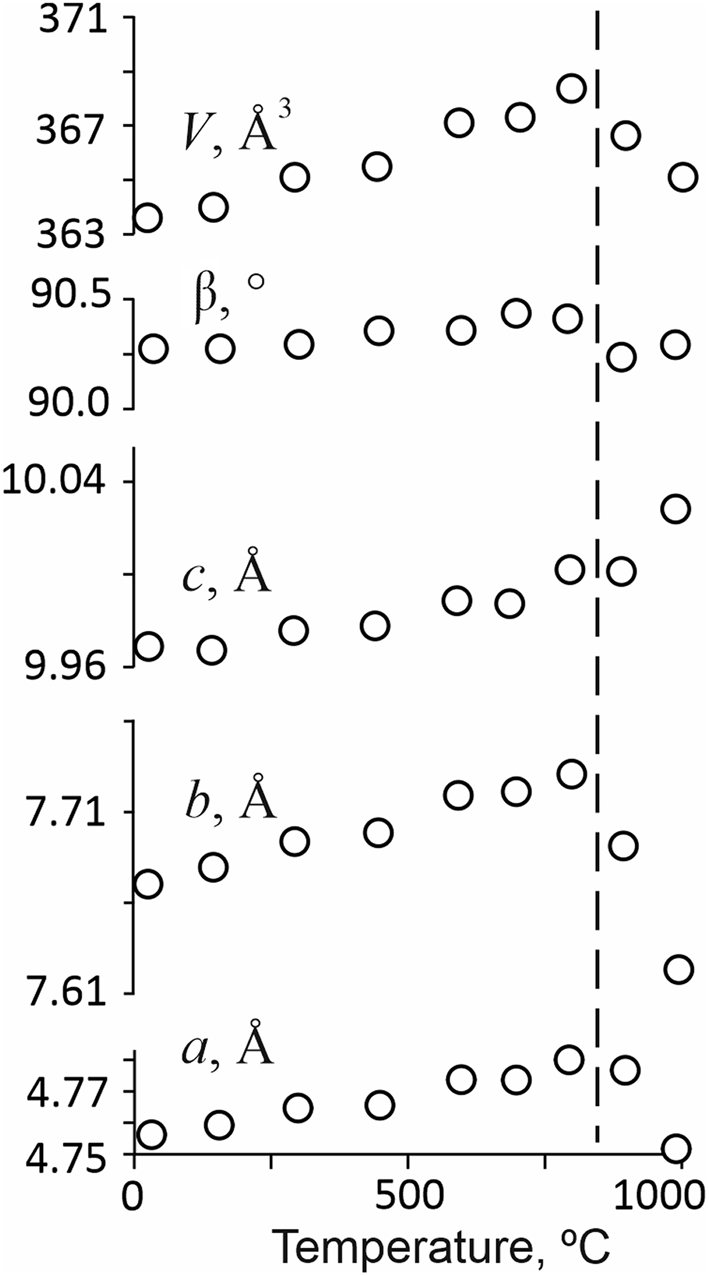
Temperature dependencies for the unit-cell parameters of ‘minasgeraisite-(Y)’ are shown in Fig. 6. Below 900°C all unit-cell parameters undergo continuous expansion, whereas above this temperature, all but c start to decrease. These changes indicate the beginning of the decomposition of ‘minasgeraisite-(Y)’ that is also confirmed by a significant deterioration in quality of SCXRD data (Table S1).
The unit-cell parameters of ‘minasgeraisite-(Y)’ at different temperatures. The errors are smaller than symbols. The broken line demonstrates the start of decomposition process.

There are only seven experimental points for the calculations of thermal expansion coefficients (TECs) as ‘minasgeraisite-(Y)’ starts to decompose at the last two temperatures. Taking this fact into account, the TECs were calculated only with the linear approximation and are the following: α11 = 7.0(5), α33 = 3.0(6), μ(α33^c) = 31.5(4), αa = 5.9(5), αb = α22 = 10.2(5), αc = 4.1(6), αβ = 2.2(4), αV = 20.2(9) × 106 °C–1. The results we obtained demonstrate that the thermal expansion of ‘minasgeraisite-(Y)’ has quite an anisotropic character (αmax / αmin = 3.4), wherein the maximum and minimum expansions are close to the b and c directions, respectively, i.e. within the layer plane (Fig. 7). Generally, such a type of high-temperature deformations is not typical for layered crystal structures, which typically expand more intensely perpendicular to the layer plane; however, it has been observed previously for other gadolinite-supergroup minerals (Krzhizhanovskaya et al., Reference Krzhizhanovskaya, Gorelova, Bubnova, Pekov and Krivovichev2018; Gorelova et al., Reference Gorelova, Vereshchagin, Cuchet, Shilovskikh and Pankin2020; Reference Gorelova, Panikorovskii, Pautov, Vereshchagin, Krzhizhanovskaya and Spiridonova2021a; Reference Gorelova, Vereshchagin, Aslandukov, Aslandukova, Spiridonova, Krzhizhanovskaya, Kasatkin and Dubrovinsky2022) and is usually explained by the shear deformation of the monoclinic plane (Bubnova and Filatov, Reference Bubnova and Filatov2008).
Crystal structure of ‘minasgeraisite-(Y)’ with the section of the averaged thermal expansion. SiO4 and BeO4 tetrahedra are given in orange and blue, respectively. Atoms of A site and H atoms are show as purple and grey spheres, respectively, whereas atoms of M site are shown as white and rose that demonstrates the partial occupancy.

The volume thermal expansion of ‘minasgeraisite-(Y)’ is quite low (αV = 20 × 10–6 °C–1) in comparison with the other gadolinite-supergroup minerals. Hingganite-(Y), which is the closest in composition to ‘minasgeraisite-(Y)’ studied here, has an even lower volume TEC (αV = 9 × 10⁻⁶ °C–1; Gorelova et al., Reference Gorelova, Vereshchagin, Cuchet, Shilovskikh and Pankin2020), but such a comparison is not totally correct, as hingganite-(Y) was only studied at low temperatures (from –173 to +7°C). The third mineral of the gadolinite subgroup, namely gadolinite-(Y), expands at high temperatures one and a half times more intensely (αV = 28 × 10–6 °C–1; Gorelova et al., Reference Gorelova, Panikorovskii, Pautov, Vereshchagin, Krzhizhanovskaya and Spiridonova2021a) than ‘minasgeraisite-(Y)’. It should also be noted that if gadolinite-(Y) starts to decompose at the temperature above 1050°C (Gorelova et al., Reference Gorelova, Panikorovskii, Pautov, Vereshchagin, Krzhizhanovskaya and Spiridonova2021a), ‘minasgeraisite-(Y)’ is less stable and starts to decompose above 800°C.
The results obtained throughout this study imply that beryllosilicate compounds of the gadolinite-supergroup minerals are the most stable compared to borosilicate and beryllophosphate analogues. Datolite, ‘bakerite’ and hydroxylherderite, from previous studies (Krzhizhanovskaya et al., Reference Krzhizhanovskaya, Gorelova, Bubnova, Pekov and Krivovichev2018; Gorelova et al., Reference Gorelova, Vereshchagin, Aslandukov, Aslandukova, Spiridonova, Krzhizhanovskaya, Kasatkin and Dubrovinsky2022), start to decompose at 710, 530 and 720°C, respectively. It is interesting to note that though the high-temperature and high-pressure behaviour have to be similar (antipodal) (Hazen, Finger, Reference Hazen and Finger1982; Filatov, Reference Filatov1990), according to the general principles of comparative crystal chemistry, beryllophosphates are usually more stable compared to beryllo-, boro- and aluminosilicate compounds under high-pressure conditions (Gorelova et al., Reference Gorelova, Pakhomova, Krzhizhanovskaya, Pankin, Krivovichev, Dubrovinsky and Kasatkin2021b; Gorelova et al., Reference Gorelova, Vereshchagin, Aslandukov, Aslandukova, Spiridonova, Krzhizhanovskaya, Kasatkin and Dubrovinsky2022). This difference in the high-temperature and high-pressure behaviour can be explained by the different (OH)-content in the minerals of the gadolinite supergroup. The decomposition at the temperature at ~700°C is typical for (OH)-containing layered minerals and inorganic compounds (e.g. Foeldvari, Reference Földvári2011), whereas (OH) groups do not have such a strong influence on the high-pressure behaviour. It is also worth noting that our data are in line with the previous observations on synthetic ‘gadolinites’ of Ito (Reference Ito1965), who stated that they are stable from 300 to 1200°C.
Conclusion
Minasgeraisite-(Y) is a mineral, whose description lacks structural data but contains information on the presence of a large cation (Ca) at the M site, which is atypical for ‘gadolinites’. Several scientists hesitated about the existence of minasgeraisite-(Y), however due to its rarity in Nature, it has still not been possible to re-investigate minasgeraisite-(Y) or (at least) to reinvestigate ‘gadolinite’ from the minasgeraisite-(Y) type locality.
Our study revealed a significant similarity between the composition of ‘minasgeraisite-(Y)’ studied by us and that of minasgeraisite-(Y) discovered by Foord et al. (Reference Foord, Gaines, Crock, Simmons and Barbosa1986). ‘Minasgeraisite-(Y)’ studied by us has high Bi and Mn content, which is typical for minasgeraisite-(Y) (Foord et al., Reference Foord, Gaines, Crock, Simmons and Barbosa1986) and has not been encountered in any other ‘gadolinite’ localities. Generally, the sample under investigation has all the specific features of the chemical composition of minasgeraisite-(Y) from the Jaguaraçu Pegmatite, except Ca excess at the M site, which implies that it should rather be considered as Bi-rich, Mn-bearing hingganite-(Y) than minasgeraisite-(Y).
Our study also revealed a considerable similarity between the crystal structure of ‘minasgeraisite-(Y)’ studied by us and that of ‘minasgeraisite-(Y)’ studied by Cooper and Hawthorne (Reference Cooper and Hawthorne2018). We have found that the geometry and occupancies of all non-equivalent sites in the crystal structure of ‘minasgeraisite-(Y)’ studied by us are consistent with those in the crystal structure of ‘minasgeraisite-(Y)’ studied by Cooper and Hawthorne (Reference Cooper and Hawthorne2018). Our data match the observation of Cooper and Hawthorne (Reference Cooper and Hawthorne2018), that the low site-scattering at the M site precludes the possibility of the M site to be Ca-dominant in ‘minasgeraisite-(Y)’. However, it is worth noting that we did not observe the lowering of the symmetry of the crystal under investigation (probably due to the relatively low quality and low amount of the data available).
‘Minasgeraisite-(Y)’ (Bi-rich, Mn-bearing hingganite-(Y)) studied by us starts to decompose above 800°C, which shows that it is more stable than borosilicate and beryllophosphate analogues (< 720°C; Krzhizhanovskaya et al., Reference Krzhizhanovskaya, Gorelova, Bubnova, Pekov and Krivovichev2018; Gorelova et al., Reference Gorelova, Vereshchagin, Aslandukov, Aslandukova, Spiridonova, Krzhizhanovskaya, Kasatkin and Dubrovinsky2022) but less stable than another beryllosilicate analogue with the fully occupied M site (~1050°C; Gorelova et al., Reference Gorelova, Panikorovskii, Pautov, Vereshchagin, Krzhizhanovskaya and Spiridonova2021a). We can conclude that beryllosilicates are most stable at high-temperature conditions within the gadolinite supergroup and that the species with a higher M-site occupancy have higher stability upon heating.
Acknowledgements
The authors thank the X-ray Diffraction Centre and Geomodel Center of the Resource Centre of Saint Petersburg State University for providing instrumental and computational resources. We are thankful to Principal Editor Dr. S. Mills for editorial handling of the manuscript and to the Structures Editor for corrections of crystallographic data. The constructive suggestions and invaluable linguistic support of two anonymous reviewers are gratefully acknowledged. This research was funded by the Russian Science Foundation, grant number 22-27-00430.
Supplementary material
The supplementary material for this article can be found at https://doi.org/10.1180/mgm.2023.19.
Competing interests
The authors declare none.