Introduction
For many years manned aircraft have been utilized in agriculture to collect aerial imagery or carry spraying systems over large areas in short periods of time (Huang et al. Reference Huang, Thomson, Hoffmann, Lan and Fritz2013). Aerial pesticide applications are used to prevent pest damage to crops in areas that are inaccessible for ground-based equipment (Bretthauer Reference Bretthauer2015). Manned aircraft require large open areas for safe operation, leaving smaller fields to be sprayed with conventional ground equipment, which now can be managed using smaller unmanned aerial vehicles (UAVs; Huang et al. Reference Huang, Thomson, Hoffmann, Lan and Fritz2013). A UAV is an unpiloted, reusable, aerial vehicle that is controlled remotely, semiautonomously, or autonomously to perform specific tasks (Blyenburgh Reference Blyenburgh1999). Aerial pesticide applications from manned aircraft are considered extremely dangerous due to their high frequency of accidents (Mannarino et al. Reference Mannarino, Langley and Kearney2017). The hazards along with the requirement of expensive equipment and personnel to conduct manned aerial applications makes them an expensive option. Aerial applications with UAVs are considered a safer alternative to manned aircraft due to the lack of an on-board pilot (Faical et al. Reference Faical, Freitas, Gomes, Mano, Pessin, Carvalho, Krishnamachari and Ueyama2017; Giles Reference Giles2016; He Reference He2018).
Precision agriculture is a form of site-specific crop management based on observing, measuring, and responding to interfield and intrafield variability in cropping systems. UAVs have been developed in support of precision agriculture to carry out remote sensing and pesticide spraying missions (Huang et al. Reference Huang, Thomson, Hoffmann, Lan and Fritz2013) with the high temporal (e.g., daily acquisition) and high spatial (e.g., centimeter) resolutions that modern precision agriculture requires (Zhang and Kovacs Reference Zhang and Kovacs2012). These advantages, along with others such as ease of operation and nondestructive data acquisition, have driven research into integrating UAVs with a diversity of remote sensing technologies (Deng et al. Reference Deng, Mao, Xiaojuan, Duan and Yan2018).
Precision agriculture offers an alternative to the overuse of agricultural chemicals via reducing and optimizing the use of broadcast applications common in conventional agriculture (Zhang and Kovacs Reference Zhang and Kovacs2012). Postemergence herbicide applications using site-specific approaches have shown to be a viable option to reduce herbicide usage (Christensen et al. Reference Christensen, Søgaard, Kudsk, Nørremark, Lund, Nadimi and Jørgensen2009; Gerhards and Oebel Reference Gerhards and Oebel2006; San Martín et al. Reference San Martín, Andújar, Barroso, Fernández-Quintanilla and Dorado2016; Wiles Reference Wiles2009). Castaldi et al. (Reference Castaldi, Pelosi, Pascucci and Casa2017) reported 39% reduction in herbicide use in a precision weed management system by combining UAV-generated weed maps and a tractor-based spray system that consisted of 12 independent boom sections, each capable of spraying independently. Huang et al. (Reference Huang, Hoffmann, Fritz and Lan2008) successfully developed an autonomous UAV spray system that could be integrated with remotely sensed data and concluded that UAVs have exceptional potential for precision weed management.
The first pesticide-applying UAV was developed in Japan by Yamaha in 1985 (Xiongkui et al. Reference Xiongkui, Bonds, Herbst and Langenakens2017), but the exportation of Yamaha pesticide-applying UAVs from Japan was banned in 2007 to protect the technology from competitors (Xue et al. Reference Xue, Lan, Zhu, Chun and Hoffman2016). In recent years, China has developed and implemented the use of UAVs for crop protection (Fengbo et al. Reference Fengbo, Xinyu, Zhang and Zhu2017; He Reference He2018; Lan et al. Reference Lan, Shengde and Fritz2017; Meng et al. Reference Meng, Lan, Mei, Guo, Song and Wang2018; Xiongkui et al. Reference Xiongkui, Bonds, Herbst and Langenakens2017; Xue et al. Reference Xue, Lan, Zhu, Chun and Hoffman2016). He (Reference He2018) attributed UAV growth in China to a shortage of agricultural labor and the technology’s versatility for applying pesticides in limited-access areas such as rice paddies and hillsides.
UAV spraying technology and implementation have both advanced in Asia, but the technology and use has been adopted much more slowly by producers in North America and Europe (Giles Reference Giles2016). UAV missions associated with carrying and dispersing pesticides are considered more hazardous than remote sensing missions. The Federal Aviation Administration (FAA) requires all commercial UAV pilots to comply with FAA Part 107, which requires an up-to-date federal license to conduct all missions other than for recreational purposes with drones weighing less than 25 kg. Individual states might have stricter requirements. Giles et al. (Reference Giles, Billing and Singh2016) successfully applied pesticides to a California vineyard using a UAV sprayer and concluded that UAV spray applications are feasible for spraying specialty crops. Due to the scarce experience with these new technologies, there is limited information about potential off-target movement associated with drift resulting from UAV-aerial applications (Brown and Giles Reference Brown and Giles2018).
UAVs apply a lower spray volume of pesticide than conventional aerial or ground-based applications, and at an application height lower than aerial but higher than ground-based applications (He Reference He2018). Therefore, UAV sprayers require proper characterization of application parameters (e.g., spray volume, nozzle selection, wind conditions, application speed) to optimize their use. Furthermore, spray-capable UAVs can differ significantly among manufacturers. During the rapid development of UAV pesticide technology in China, more than 200 manufacturers created more than 169 different types of UAVs (Xiongkui et al. Reference Xiongkui, Bonds, Herbst and Langenakens2017). Optimization of spray patterns based on spray system configurations have yet to be achieved (He Reference He2018). Lan et al. (Reference Lan, Shengde and Fritz2017) compared five aerial pesticide-applying UAVs from the literature and found differences among their optimal operating parameters and needed buffers for application. Similarly, Yongjun et al. (Reference Yongjun, Shenghui, Chunjiang, Liping, Lan and Yu2017) found different optimal operating parameters for UAV applications over different growth stages of corn. Despite previous studies, the accuracy and uniformity of UAV pesticide applications have not been evaluated under different flight configurations and conditions (Faical et al. Reference Faical, Freitas, Gomes, Mano, Pessin, Carvalho, Krishnamachari and Ueyama2017).
The lack of research pertaining to UAV spraying has limited the development of standards to determine recommended guidelines for the effective and safe use of this technology (He Reference He2018). Wind variability and nozzle selection have been documented as two influential parameters on achievable coverage and reduced off-target movement (Hewitt et al. Reference Hewitt, Solomon and Marshall2009). Bode et al. (Reference Bode, Butler and Goering1976) found wind speed to be the most important meteorological factor on spray applications, and that spray coverage decreases as wind speed increases (Grover et al. Reference Grover, Maybank, Caldwell and Wolf1997). Spray drift, deposition, coverage, and efficacy are influenced by the spectra of droplet size, which can be altered by different spray nozzle designs (Bouse et al. Reference Bouse, Kirk and Bode1990; Combellack et al. Reference Combellack, Western and Richardson1996). Smaller sized droplets can increase spray coverage that can potentially improve herbicide efficacy, but they can also increase the risk of spray drift (Knoche Reference Knoche1994). Air-induction drift nozzles produce large droplets that combat spray drift better than the small droplets produced by flat-fan nozzles (Legleiter and Johnson Reference Legleiter and Johnson2016). Therefore, the objectives of the present study were to determine 1) how flying speed and nozzle type affect target coverage; and 2) the effect of nozzle type on potential off-target movement risk under varying perpendicular wind conditions for pesticide applications using a UAV sprayer.
Materials and Methods
Flight speed experiments were conducted at the Lake Wheeler Turfgrass Field Laboratory, Raleigh, NC (35.74°N, 78.68°W). The experimental area was an open sod field, and applications were made during March and April of 2018 when wind speeds were 1 to 4 m s−1. Additionally, another set of outdoor experiments on the influence of perpendicular wind conditions and nozzle type on drift risk were evaluated at the North Carolina State University Weed Control Laboratories in Raleigh, NC (35.79°N, 78.69°W). These experiments were conducted during days with low to no wind in August 2018 at a low elevation in an area surrounded by tree wind-breakers and tall walls to protect the experimental area from unwanted wind.
Application Speed and Nozzle Type
The experiment was conducted as a factorial arrangement of four application speeds and three spray nozzle types, for a total of 12 treatments, in a completely randomized design with four replications, and repeated a month later. Applications were made with a DJI AGRAS MG-1 octocopter sprayer (DJI, Shenzhen, China) at a flying altitude of 3 m over the target area. This height was the minimum-allowed spray height for this drone during autonomous flying operation. For an autonomous application, the pilot is required to set A and B waypoints (i.e., start and end of application path, respectively). The experimental units were centered on the flight path. The A and B points were located 3 m before and after the sampling area, respectively in each experimental unit. This was done to achieve the desired speed and spray coverage over the target area. Autonomous application speeds were 1, 3, 5, and 7 m s−1, and were selected based on the settings for the UAV sprayer. Flow rate remained constant at 680 ml min−1 per nozzle for all applications with four nozzles covering a 3-m swath, creating an inverse relationship between application speeds and application volumes of 151, 50, 30, and 22 L ha−1. Extended-range flat-spray nozzles (XR; TeeJet®, XR11002VS, Spraying Systems Co., Wheaton, IL), air-induction flat-spray nozzles (AIXR; TeeJet®, AIXR 11002VP, Spraying Systems Co., Wheaton, IL), and turbo air–induction flat-spray nozzles (TTI; TeeJet®, TTI 11002VP, Spraying Systems Co., Wheaton, IL) were tested. These nozzles were selected because of their fine, coarse, and ultracourse droplet size profiles, respectively. Experimental units were 30 m2 (10 m by 3 m), and a sampling area of 2.3 m2 (3 m by 0.76 m) was located in the plot center and covered with 0.76-m-wide brown kraft paper (DIY Crew, Seattle, WA). Paper was secured to the ground with rebar and binder clips placed along the edges to maintain a uniform and smooth surface during the application. A solution of Lazer blue concentrated spray pattern indicator (20 ml L−1; Sanco Industries, Inc., Fort Worth, IN) was used to make the droplet distribution pattern visible on the sampling area.
A 0.25-m2 (0.5 m by 0.5 m) frame was used for image collection to evaluate application coverage over the paper. Paper samples were photographed with a digital camera (Canon EOS Rebel T6 EF-S 18-55 mm; Canon U.S.A., Inc., Melville, NY) immediately after each experimental run to obtain a resolution of 100 pixels mm−2. Images were cropped to the inside edge of the frame for image analysis. Image analysis was conducted by supervised classifications using ArcMap 10.5.1 (Esri, Redlands, CA). Image samples were individually subjected to an interactive supervised classification and divided into three classes: sprayed, missed, and undetermined. Classified image files were then transformed to polygon files to create pixel counts for each class. Undetermined pixel counts represented less than 0.02% of each classified image sample. Coverage was determined based on the number of sprayed pixels divided by the sum of sprayed and unsprayed pixels. Statistical analyses were conducted using the GLIMMIX and REG procedures in SAS (9.2; SAS Institute Inc. Cary, NC) with α = 0.05 after confirming normality and homoscedasticity of the data. The ANOVA model included nozzle type, application speed, experimental run, and their interactions as fixed effects and replication as a random effect. In case there were no interactions between experimental run and any other treatment effects, the former was considered random in the model.
Perpendicular Wind Conditions and Nozzle Type
The experiment was conducted as a factorial arrangement of five wind speeds blowing perpendicularly to the flying path of the UAV and four spray nozzle types, for a total of 20 treatments, in a completely randomized design with three replications, and repeated 2 wk later. Perpendicular wind speeds were 0, 2, 4, 7, and 9 m s−1. Wind was generated using a 61-cm Hi-Vol/Hi-Velocity industrial fan (Model 5M170; Dayton Electric Manufacturing Co., Niles, IL) set at different distances from the application target at the center height of 1 m to create varying wind conditions. This setting allowed us to produce a constant perpendicular wind from 0.25-m to 1.75-m height over the target area, and the area of influence was 1.5-m wide. Wind speeds were measured with a precision of ±0.05 m s−1 in multiple points vertically and horizontally over the target area to confirm that the desired speed was uniform over that area. The evaluated nozzles included XR, AIXR, TTI, and a hollow-cone spray (HC) nozzle (TXR8002VK; TeeJet®, Spraying Systems Co., Wheaton, IL). Single 5-cm by 8-cm water-sensitive spray cards (TeeJet®, Spraying Systems Co., Wheaton, IL) were placed horizontally on the ground at 2.5, 5.0, 7.5, 10, and 15 m downwind from the application target. Three spray cards were set in a row on the target area along the flight path of the UAV sprayer and were spaced at 50 cm from one another. Spray cards were held in place by binder clips attached to plywood bases. A UAV sprayer carrying water was flown at an autonomous application speed of 3 m s−1 (50 L ha−1) and a height of 3 m for all experimental runs. This flying speed was selected based on the previous experiment to maximize target coverage and reduce drift due to flying speed. The UAV sprayer flight path started 5 m before the target area and finished 5 m after.
Water-sensitive spray cards were collected immediately after each application, and digital images were recorded and processed using the unsupervised classification in ArcMap 10.5.1 and creating four classes: dark blue, light blue, dark yellow, and light yellow. Classified images were subjected to the methodology previously outlined, with coverage being determined by the sum of the blue pixels divided by the sum of all pixels per spray card. All statistical analyses were conducted using the GLIMMIX procedure in SAS with α = 0.05 after confirming normality and homoscedasticity of the data. The ANOVA model included nozzle type, perpendicular wind speed, distance from target, experimental run, and their interactions as fixed effects and replication as a random effect. In case there were no interactions between experimental run and any other treatment effects, the former was considered random in the model.
Results and Discussion
No significant experimental run-by-treatment interactions were detected (P > 0.05) for either experiment; therefore, data were presented as pooled across runs.
Application Speed and Nozzle Type
Coverage was determined by the interaction between nozzle type and application speed (P = 0.02). There was an inverse relation between coverage and application speed regardless of nozzle type (Figure 1); however, only at the minimum speed of 1 m s−1, coverage differed among nozzles (P < 0.02), with XR nozzles exhibiting higher coverage (61%) than AIXR and TTI nozzles (41% and 31%, respectively). Conversely, at the maximum speed (7 m s−1) all nozzles decreased coverage to similar levels (P > 0.82): 22% for AIXR, 16% for XR, and 13% for TTI nozzles. Coverage observed in the present study was higher than in previous nozzle research. Nansen et al. (Reference Nansen, Ferguson, Moore, Groves, Emery, Garel and Hewitt2015) reported coverage <40% at application volumes of 100 to 140 L ha−1, and no more than 10% coverage with 30 to 40 L ha−1 for both XR and AIXR nozzles. In the present study, UAV sprayer applications provided 31% to 61% coverage at 151 L ha−1 and 13% to 22% at 22 L ha−1. Teske et al. (Reference Teske, Wachspress and Thistle2018) found that rotor downwash can assist directing spray material toward the ground when operating beneath a critical application speed. However, under excessive application speed, the turbulence created could reduce the downward force favoring off-target movement. In this experiment, the UAV’s propellers may have helped force spray solution toward the target, thereby improving coverage.
Target-area coverage resulting from UAV applications with fine (XR; extended-range flat-spray), coarse (AIXR; air-induction flat-spray), and ultra-coarse (TTI; turbo air-induction flat-spray) nozzles at increasing application speeds calibrated to deliver a fixed application output per time unit (680 mL min−1 per nozzle and a total of four nozzles covering a 3-m swath). Application speeds of 1, 3, 5, and 7 m s−1 were equivalent to application volumes of 151, 50, 30, and 22 L ha−1, respectively. Values are averaged over repeated experiments and four replications for each (n = 8). Error bars represent 95% confidence interval. For XR nozzles (orange line), y = 74*exp(−0.22*x), R 2 = 0.97; for AIXR nozzles (blue line), y = 43*exp(−0.12*x), R 2 = 0.73; and for TTI nozzles (black line), y = 36*exp(−0.18*x), R 2 = 0.86, where x represents application speed and y percent coverage.

The volume applied per unit of time stayed constant for all application speeds, so it was expected that coverage would decrease as speed increased due to lower application volume per area unit. However, the rate of decrease in coverage (i.e., b; Figure 1) as speed increased was disproportionally higher for XR nozzles (b = −0.22) when compared with AIXR (b = −0.12) and TTI nozzles (b = −0.18). As application speed increased, coverage created from XR nozzles decreased more rapidly than from AIXR and TTI nozzles. This more rapid decrease in coverage from the XR nozzles may have been the result of increased off-target movement of driftable droplets resulting from the faster flight speed. Because of their design, XR nozzles produce smaller spray droplets than AIXR and TTI nozzles (Creech et al. Reference Creech, Henry, Fritz and Kruger2015). Smaller droplets have been shown to be more susceptible to drift than larger droplets during conventional aerial applications (Bird et al. Reference Bird, Esterly and Perry1996).
Perpendicular Wind Conditions and Nozzle Type
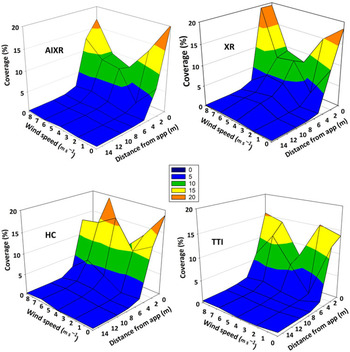
There was a three-factor interaction between nozzle type, distance from the target, and wind speed (P = 0.02); therefore, the analysis was conducted by nozzle type. Among the nozzles tested, TTI nozzles consistently produced the lowest coverage (P = 0.04; Figure 2). This can be appreciated in the coverage obtained on the target area (0 m, distance from application) and with no perpendicular wind (0 m s−1). These results were similar to those found in the application speed and nozzle selection experiment. Coverage produced by TTI nozzles hardly exceeded 15%, whereas other nozzles achieved closer to 20% coverage at the target area with no perpendicular wind.
Spray coverage for air-induction flat spray (AIXR), extended-range flat-spray (XR), hollow-cone (HC), and turbo air–induction flat-spray (TTI) nozzles influenced by perpendicular wind speed at different distances downwind from the target area. The x-axis represents distance downwind from target area (in meters), the y-axis represents perpendicular wind speed (m s−1) over target area, and the z-axis represents coverage (%). Values were averaged over two experimental runs.
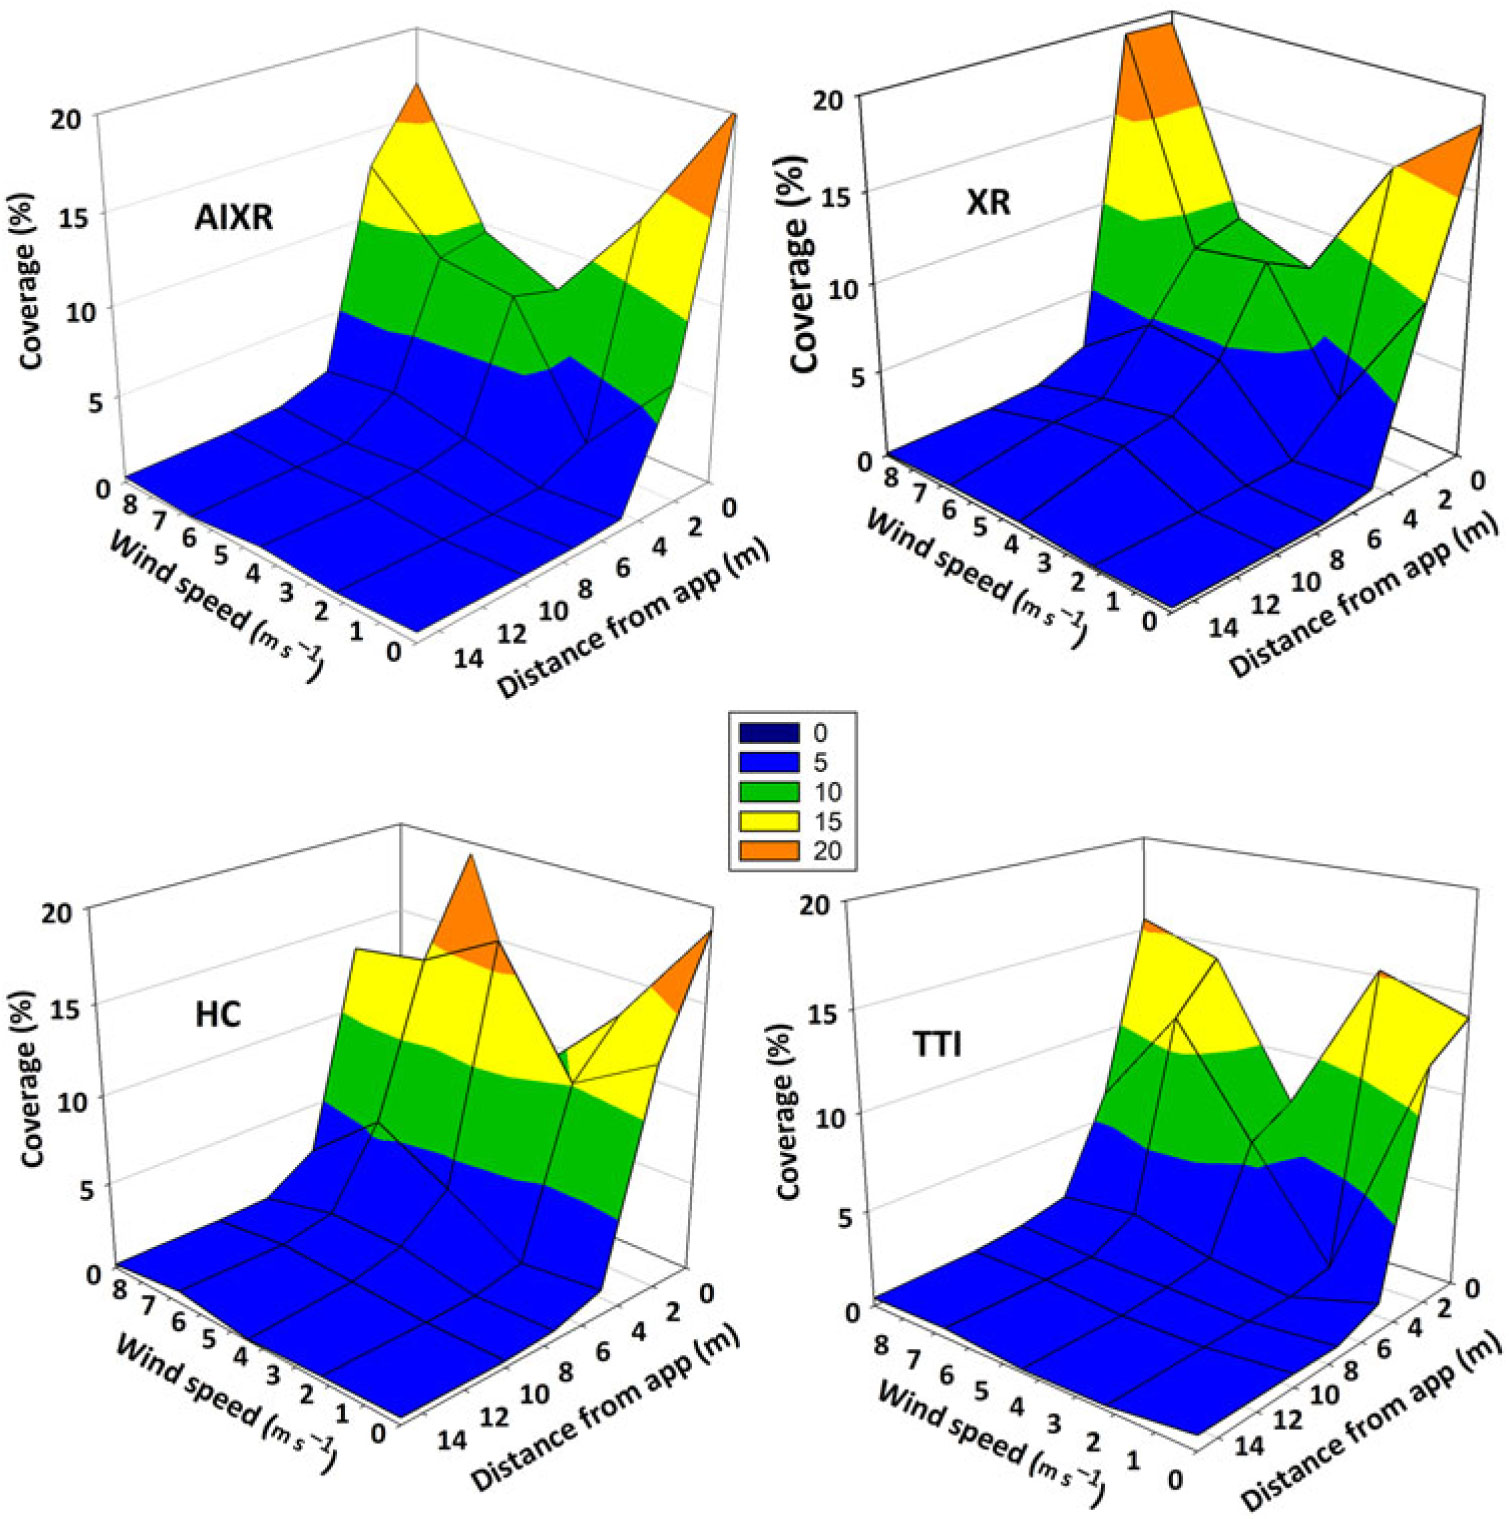
Drift distance was similar for all nozzles (P = 0.17) under all perpendicular wind conditions and was detected up to 5 m downwind from the target (Figure 2). At distances of 7.5 m and greater, coverage created from driftable droplets was close to zero and did not differ among nozzles. It is worth noting that the position of the fan creating the perpendicular wind from 0.25 m to 1.75 m above the target area creates a limitation on measuring the actual drift potential of a UAV sprayer. Air currents and windy conditions can be present at any height above the ground. It is likely a wind current at higher heights than the one studied here could carry driftable spray particles farther than wind currents at lower application heights such as the one tested in the present study. Therefore, the results of the present study are more informative of nozzle type differences than drift distance.
Although we expected a consistent decline in coverage over the target area as perpendicular wind speed increased, coverage exhibited a concave-shaped curve in response to this factor (Figure 2). Thus, the lowest target coverage was achieved at the intermediate perpendicular wind speed (4 m s−1), and the extreme speeds (0 and 9 m s−1) exhibited coverage that was almost twice greater than the former. Droplets sprayed from a UAV are subject to both vertical and horizontal forces once released (Yang et al. Reference Yang, Xue, Cia, Sun and Zhou2018). Therefore, it might be necessary to identify application speeds for UAV sprayers where the downwash from the rotors does not become outwash before reaching the target (Teske et al. Reference Teske, Wachspress and Thistle2018). Otherwise, the interaction between speeds greater than the critical speed and perpendicular wind conditions may increase the likelihood of off-target movement (Teske et al. Reference Teske, Wachspress and Thistle2018). The result of contrasting wind directions and forces lead to observed turbulence, where the droplets could be either forced down toward the target or recirculated upward under high wind conditions in lower layers.
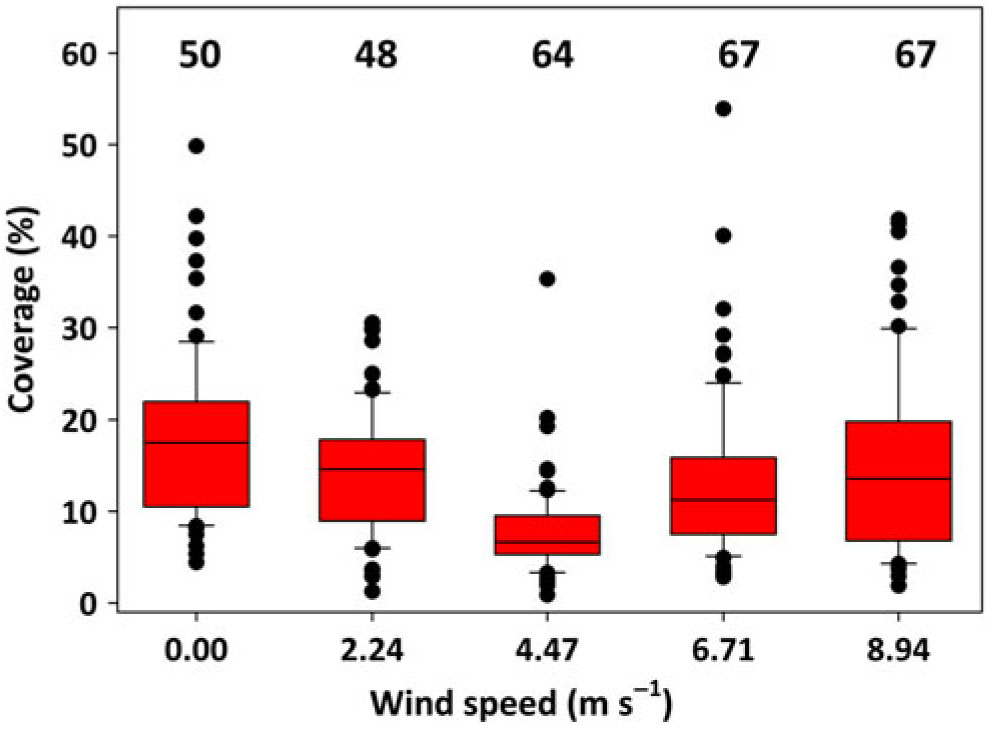
Total coverage alone must not be the only consideration to determine the optimum parameters for UAV applications; uniformity of spray coverage must be considered too. Coverage at the target area varied between wind speeds across all nozzles (Figure 3). Coverage variability was greatest under perpendicular wind speeds ≥4 m s−1 (coefficient of variation [CV] ≥ 64%), and lowest at 2.24 m s−1 (CV = 48%).
Influence of perpendicular wind speed (m s−1) on spray coverage on target area. Values are pooled over four nozzle types, and two experimental runs with three replications each (n = 24). Error bars represent 5th and 95th percentiles, the lines in the box represent the 25th, 50th, and 75th percentiles, and the dots are the observations outside the limits set by the error bars. Values above each perpendicular wind speed box represent the coefficient of variation (%).
Off-target movement of spray droplets is more likely with stability of atmospheric conditions and wind speed. In fact, current pesticide labels for aerial applications usually prohibit spraying during very stable atmospheric conditions (Bird et al. Reference Bird, Esterly and Perry1996). Under extremely stable conditions, temperature inversions in which cold air is closer to the soil or crop surface than the air above can slow down the fall of driftable droplets and even allow them to move off target if retained in the warm temperature air layer. Higher wind speeds have a neutralizing effect on atmospheric stability and higher winds can lessen the effects of extremely stable conditions (Bird et al. Reference Bird, Esterly and Perry1996).
Results from the present study indicate that AIXR nozzles at an application speed of 3 m s−1 provided the best coverage of nozzles tested while reducing the risk of off-target movement. The HC and XR nozzles were more prone to drift than AIXR nozzles, and TTI nozzles provided the lowest coverage. While acceptable coverage can be achieved under extreme perpendicular wind conditions due to turbulence, the potential for off-target movement may represent a serious threat for application efficiency and safety. Future research should continue optimization of application parameters, including application height. Pesticide formulation and adjuvants can have significant impacts on coverage for pesticide applications and should be investigated for UAV-based aerial sprays. Evaluations of larger-scaled application areas are needed to fully understand the potential and limitations of this technology.
Acknowledgments
No conflict of interests are declared. We thank Dr. Joseph Neal for his valuable comments on an early version of the manuscript. This research was funded by the North Carolina Center for Turfgrass and Environmental Research and Education and USDA-NIFA Grant 2017-68005-26807.