INTRODUCTION
Odontocetes produce wide band impulsive sounds that are primarily used for echolocation (Au, Reference Au1993). Sperm whale echolocation clicks have been studied in detail by several authors, who demonstrated that they are adapted to locate medium-sized squids, among other prey (Madsen et al., Reference Madsen, Wahlberg and Møhl2002, Reference Madsen, Wilson, Johnson, Hanlon, Bocconcelli, Aguilar de Soto and Tyack2007; Mohl et al., Reference Mohl, Wahlberg and Madsen2003; André et al., Reference André, Johansson, Delory and Van der Schaar2007). The most common pulsed sound emissions heard during sperm whale deep dives are ‘usual clicks'. They contain spectral energy up to 20 kHz (Madsen et al., Reference Madsen, Wahlberg and Møhl2002) and are repeated fairly regularly every 0.5–2 seconds (Wahlberg, Reference Wahlberg2002). They are produced shortly after the beginning of dives, during the descent phase up until the end of the foraging phase of the dive (Wahlberg, Reference Wahlberg2002). Sperm whales are usually silent during the final ascent to the surface and do not often produce regular clicks during surface intervals (Wahlberg et al., Reference Wahlberg, Frantzis, Alexiadou and Møhl2005). Sperm whale sounds during foraging also include, at least in some areas, pulse trains with higher repetition rate (20–200 pulse/second), which are lower in energy but also highly directional (Madsen et al., Reference Madsen, Wahlberg and Møhl2002). These pulsed trains have been named ‘creaks’ or ‘buzzes’ (Watwood et al., Reference Watwood, Miller, Johnson and Madsen2006), and are thought to be associated with prey capture attempts (Gordon, Reference Gordon1987; Miller et al., Reference Miller, Johnson and Tyack2004a). Sequences of usual clicks and creak emissions can therefore be used to study foraging during a dive.
The north-western Mediterranean basin is an important feeding ground for sperm whales (Gannier et al., Reference Gannier, Drouot and Goold2002). Acoustic size estimates indicate that most individuals recorded in summer in this area were longer than 12 m (Drouot et al., Reference Drouot, Gannier and Goold2004a), a size generally only attained by mature males (Rice, Reference Rice, Ridgway and Harrison1989). In the Mediterranean Sea, sperm whale vocalizations during foraging dives have been studied by Drouot et al. (Reference Drouot, Gannier and Goold2004b): a mean of 25 creaks per dive were emitted during 17 dives lasting on average 45 minutes each, and they were produced at a higher rate by larger whales. Teloni (Reference Teloni2005) reported creak production at lower and more variable rates with 5 to 21 creaks/dive recorded during 28 dives. Watwood et al. (Reference Watwood, Miller, Johnson and Madsen2006) compared dive cycles and pulse emissions in the western Mediterranean Sea, in the Gulf of Mexico and in the western Atlantic Ocean: they found an average of 18.5 creaks per dive emitted by 12 sperm whales tagged in the Ligurian Sea, a count significantly different from values obtained in the two other regions. These authors concluded that recording of dives was a useful technique to study sperm whale feeding non-invasively. Variable creak rates obtained in the Mediterranean Sea in different studies suggest that creak production may be related to abiotic factors likely to influence prey availability, such as dive locations, bottom depth, time of the day, together with other factors such as whale body mass and the type of prey items.
The north-western Mediterranean basin is bordered by increasingly populated coastal areas, and impacted by human activities such as dense commercial and recreational boat trafic, industrial and military noise sources, and various fisheries. Sperm whales can be observed a few miles offshore during their routine feeding dives, almost year round (Laran & Drouot-Dulau, Reference Laran and Drouot-Dulau2007) and are very exposed to disturbance. In this study, we investigated how the dive cycles and creak production of sperm whale in this region were influenced by environmental and temporal factors. More specifically, we studied how creak/buzz emissions were linked to sperm whale size, aggregation size, durations of the different dive phases, time of the day and some topographical variables.
MATERIALS AND METHODS
Survey methodology
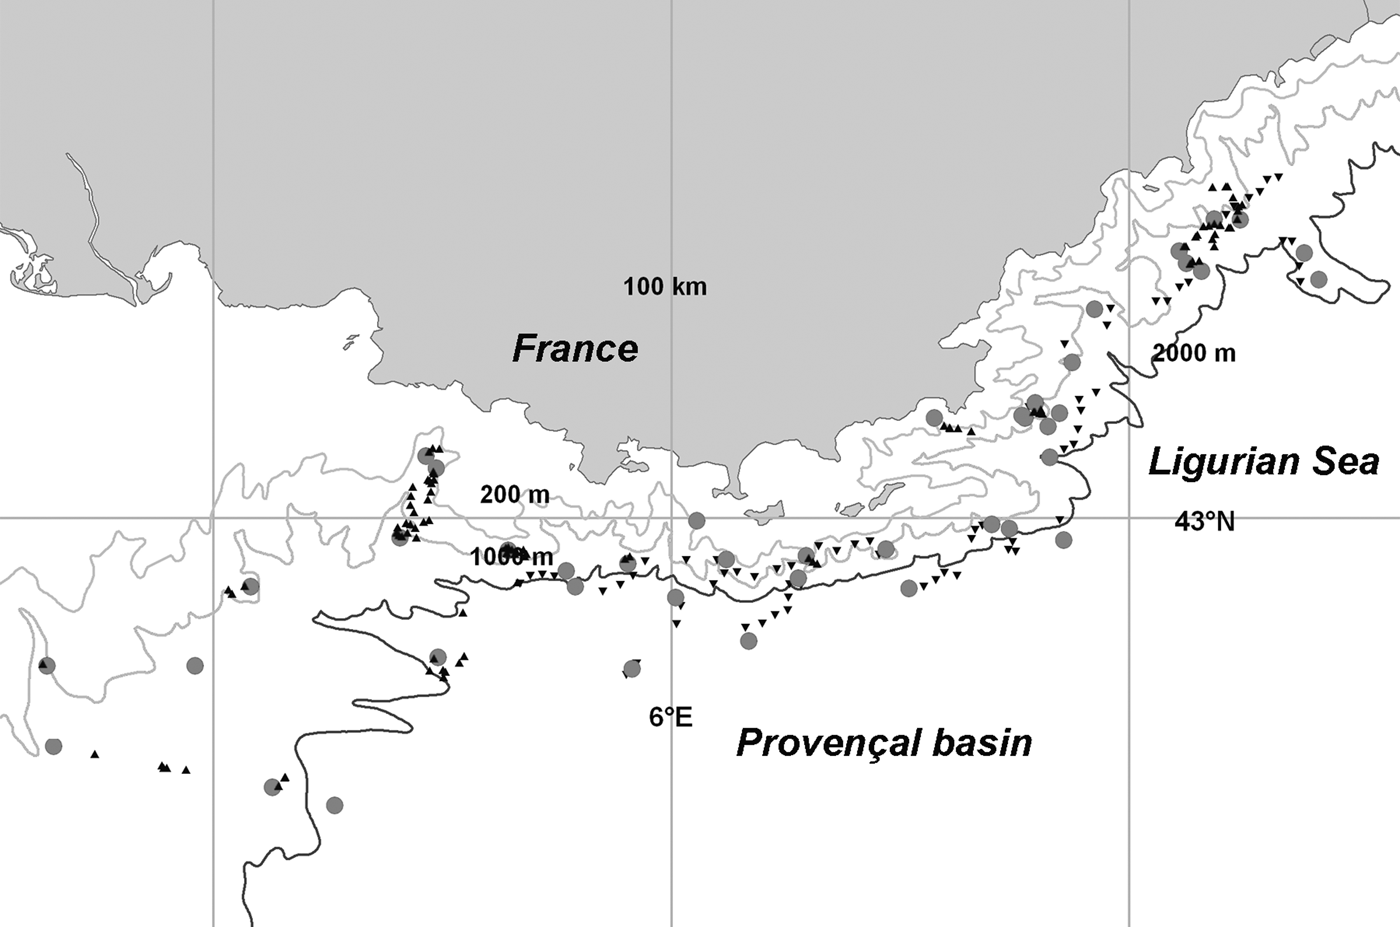
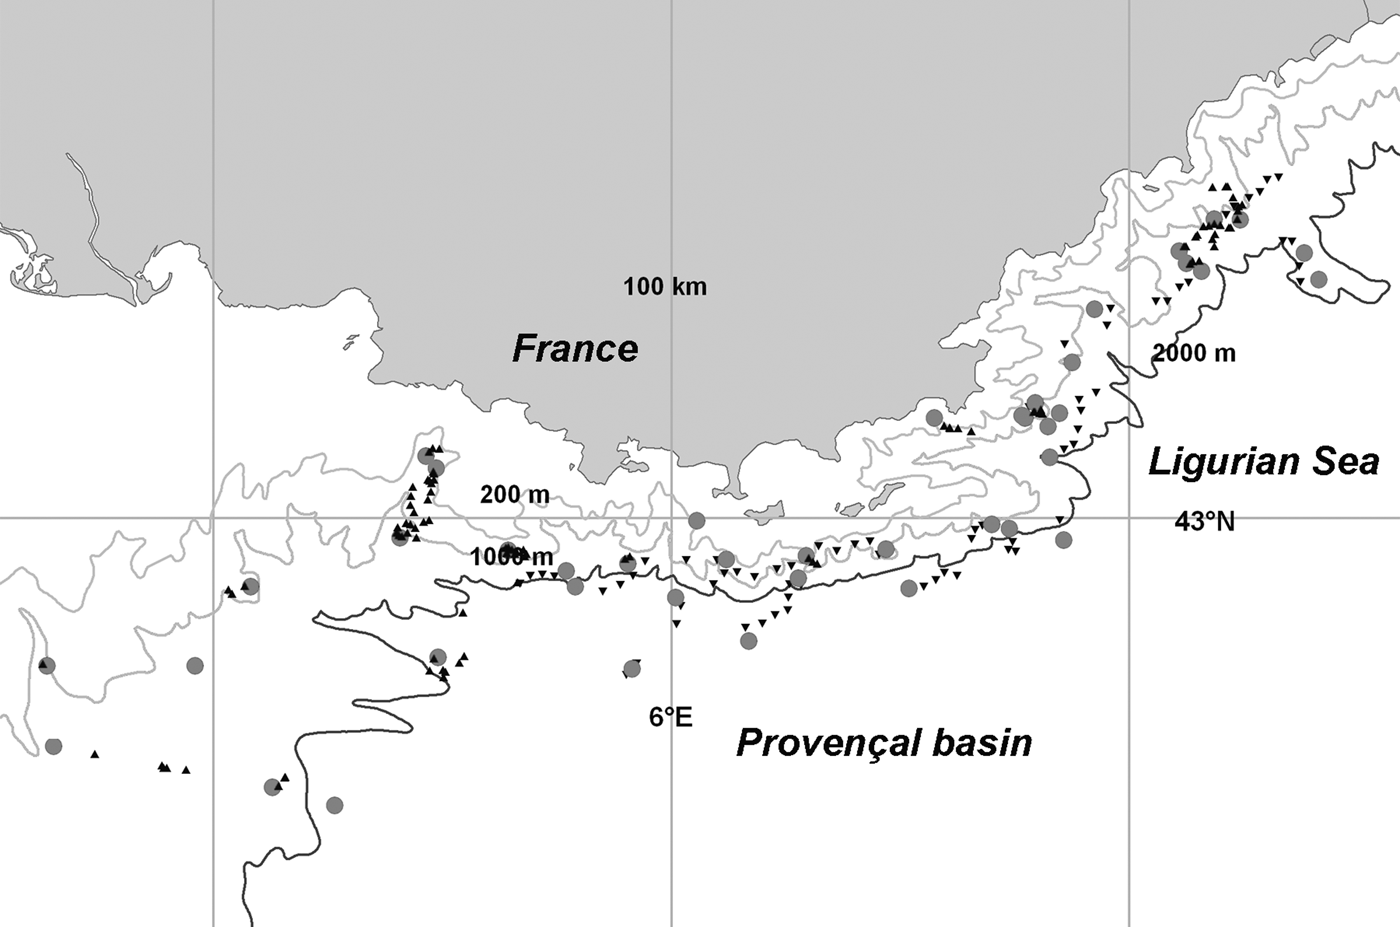
Dedicated surveys were carried out to study sperm whale foraging in the north-western Mediterranean Sea during the summer of 2001 to 2005, with a 12 m motor-sailing boat (Figure 1). The searching methodology included acoustic and visual techniques: three observers performed a continuous naked-eye observation of the sea surface, scanning the 180° sector ahead of the boat. Acoustic sampling consisted of 1 minute listening stations every 2 nmi (3.7 km) along the survey track (for details, see Gannier et al., Reference Gannier, Drouot and Goold2002), using a stereo hydrophone with a 100 m towing cable (Magrec HP-30ST). Hydrophone elements are Benthos AQ-4 fitted with a 29 dB pre-amplifier and 200Hz high-pass filter. Sensitivity is 156 re 1V/μPa flat +/−2 dB from 200Hz to 30 kHz (calibrated). When a sperm whale was detected acoustically, it was tracked and approached using Rainbow click© software until the whale was close enough for its blows to be detected upon surfacing. The boat was then stopped and visual searching was extended to 360° around the boat, while continuous sound recording was performed using a Sony TCD-8 DAT recorder. When a whale stopped clicking, the acoustic operator informed the visual observers, as cessation of clicking is usually an indication of the end of the feeding phase of a dive. Data collection was carried out as long as visual and/or acoustic observation conditions allowed the observers to be in contact with the whale, the aim being to record at least three consecutive dives for a given whale.
Sperm whale sightings during 2001–2005 surveys with position of the initial recorded dives (red circles), and the following ones (black triangles).
When a sperm whale was sighted, the time and GPS position were recorded, as well as the whale bearing and radial distance to the boat. The number of blows during the surface period was counted. The beginning of the dive was defined when the whale fluked-up, i.e. the moment when the tail disappeared from the surface. In most cases the event of fluking up could be observed and recorded accurately in both time and space—the latter typically by placing the boat over a whale's dive ‘footprint’ and obtaining a GPS reading from the boat's navigation system. The end of the dive (i.e. the start of the surfacing period) was recorded at the time the whale was first sighted at the surface, on occasions when the whale was sighted as it broke the surface. Whenever this condition could not be confirmed, the corresponding data were not considered for this study. The approximate position of a whale surfacing was calculated by taking a visual range and bearing measurement (since the boat and a surfacing whale would not be co-located) and computing its position relative to the GPS position of the boat. Contact with a given whale was maintained by tracking with the stereo hydrophone (using Rainbow click©); photo-identification was used to check that the same whale was tracked throughout a dive series.
Acoustic data consisted of complete recordings of dives from fluking to the last click, the signal level being kept high by progressively moving the boat in the direction of the clicking source. The recording quality was verified in real time, to check that regular clicks as well as creaks could be distinctly heard. Simultaneous headphones and computer screen monitoring were performed in order to increase the efficiency of tracking. Whenever in presence of an aggregation of whales, a tracked animal was sometimes lost or confused with another individual: in this case, the current dive series was terminated and a new tracking period was started. Sometimes, a dive recording was terminated because higher noise levels were encountered, such as in the presence of noisy ships.
Data processing
Dive recordings of each whale were digitized at 48 kHz from the DAT analogue output to the computer A/D card, and band-pass filtered between 3.5 and 22 kHz. CoolEdit ProV2 software was used to count and locate individual creaks within each dive recording and measure inter-pulse interval (IPI) within clicks. For each individual, an average IPI (in ms) was estimated from 20 clicks selected in the descent phase of each dive and used to estimate the whale's body length (in m) according to the Gordon (Reference Gordon1991) equation:
 $$\hbox{Body length} = 4.833 + \lpar 1.453 \hbox{IPI} - 0.001 \hbox{IPI}^{2}\rpar$$
Then, the body mass was estimated from the body length with the formula of Rice (Reference Rice, Ridgway and Harrison1989):
 $$\hbox{M} = 1.\; 25\ (0.0196\, \hbox{L}^{2.74})$$
where M is the mass in metric tons and L is the estimated length in metres. In some cases, the recording quality did not allow IPI measurement and size could not be estimated.
Sighting, surfacing and fluking locations were plotted with ArcGIS 9.3, as well as coast lines and isobaths obtained from the GEBCO database (IBCM dataset). Two variables were then extracted for each location: the bottom depth (Z), and the distance-to-the 200 m isobath (D200). When whales were aggregated, the number of whales was estimated from the acoustic recordings and not from visual observation, since in many cases different audible individuals did not surface simultaneously or at close distance one from each other. Rainbow click© monitoring allowed the estimation of a minimum number based on the click time-series display.
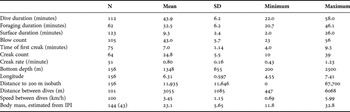
We measured dive cycle and foraging variables for each recorded dive: the surface and dive durations (in minutes), the creak count (Ncreak), the time of first creak (T1stcreak) and of last click (Tl.click), the duration of the foraging phase (DTforaging = Tl.click – T1stcreak) and of the ascending phase (Tsurf –Tl.click). Compared to Watwood et al. (Reference Watwood, Miller, Johnson and Madsen2006), we adopted a slightly different definition for the foraging phase: we considered that the latter part of the deep phase of a dive, extending from the last creak to the last usual click, should be included in the foraging duration, as the whale could still be actively searching for prey during this last clicking phase. The time from last creak to last click was retrieved in 2004 and 2005 recordings and amounted to 14 seconds in average (N = 22). Several factors allowed us to reliably count creaks from dives recorded in this way. Firstly, recordings were carried out only with sea conditions less than Beaufort 2, so wave noise was minimal. Second, the vessel was manoeuvred under sail and at low speed (<3 knots), hence a very low vessel noise, with the 100 m towed hydrophone hanging in deeper layers away from surface noise. Finally, recordings selected for creak counts were those obtained at short ranges (horizontal distances 200–3000 m, based on ranges at diving and surfacing). All these factors contributed to a consistently high signal-to-noise ratio, and meant that creaks were clearly audible to operators. Several dive recordings were discarded from the analysis because the signal quality did not allow proper creak counting. Only ‘creaks’ defined by an increased pulse rate followed by a pause were included in the creak count. When more than one whale was foraging close to the same location (typically less than 1 km one from another), creaks could not be assigned to a focal individual and then acoustic data could not be processed; this was notably the case for several recordings obtained in 2005.
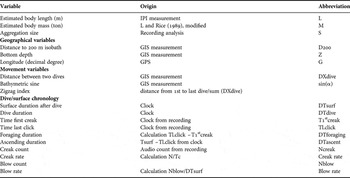
The movement of whales during dive cycles was described as the distance between two successive dive locations, as measured from the fluking ‘footprint’. To express the inshore/offshore movement of the whale during foraging dives, we computed the angle between the 100 m isobath and a straight line joining two successive dives, and its sine obtained from the GIS software. A positive bathymetric sine indicated an offshore movement, and a negative value, an inshore movement. A zigzag index was calculated whenever three or more successive dives were monitored: this was the ratio of summed dive distances to the distance measured in straight line from the first to the last dive. The variables used to describe dive cycles are summarized in Table 1.
Summary of variables used for the study.

For definition of abbreviations see text.
Statistical analysis
Analysis was carried out with Statistica. Data normality was checked with Shapiro–Wilk or Anderson–Darling tests (for small sample size). Body mass, surface duration and distance-to-the 200 m isobath (sample size of 43, 123 and 156 respectively) significantly deviated from normality. They were included into the analysis without transformation. Simple descriptive statistics were performed to describe the dive, foraging and surface durations, the time of first creak, the number of creaks, bottom depth, the distance and speed between dives. Linear regressions were computed to relate blow counts to the different duration variables.
Firstly, dive duration (DTdive) was related to other variables using two multiple linear regression analyses. In a first analysis, we considered the average dive duration of each recorded sperm whale (sample unit = one whale), and in the other we took each dive as a sample unit. In the first case, we included the following variables: body mass, aggregation size, longitude (G), bottom depth, average number of creak, average time of 1st creak, and time of the day. In the second analysis, we retained: creak counts (Ncreak), T1stcreak, distance between successive dives (DXdive), surface duration (DTsurf), time of the day, bathymetric sine and bottom depth. For the second analysis, the assumption of independence of samples was not met, as multiple dives from the same whale are not independent, it was however the only possibility to describe series of multiple dives.
Secondly, creak rate (creak count divided by DTforaging) was related to the dive cycle variables. In the first analysis, each of the individual whales was considered as a sample unit. Thus, in cases where successive dives were recorded, all dive related variables were averaged per individual. The following variables were used: body mass, aggregation size, time of the day (H, averaged over multiple dives), longitude (average G), bottom depth and distance D200 (averaged), as well as average foraging duration and T1stcreak. Each individual was given the same weight in the analysis, whatever the number of foraging dives recorded. In the second analysis, each dive was considered as a sample unit. The following variables were included in the analysis: time of the day, bottom depth, foraging duration, surface duration, time of first creak, distance between successive dives and bathymetric sine. This option introduced a bias in favour of individuals which had been tracked during longer dive series. Body mass was not included as an explanatory variable, as it does not vary within a given dive series. We retained the time and bottom depth of each dive, because they both vary over dive series and could potentially explain part of the variation in creak counts.
Multiple regression analyses were performed by selecting variables using forward step-wise addition, with an inclusion level of 0.90 and an exclusion level of 0.70. Based on those results, a principal component analysis (PCA) was performed to display the relationship between dive and creaking variables, retaining the variables identified as significant by the multiple regression. Normal q-q plots of the residuals from the model fits all indicated that the residuals were normally distributed, indicating that a linear approximation produced a good fit to the observed relationships.
RESULTS
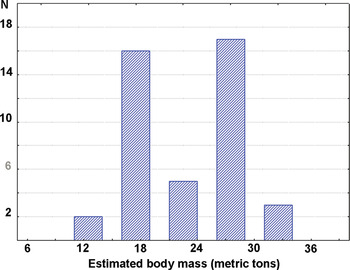
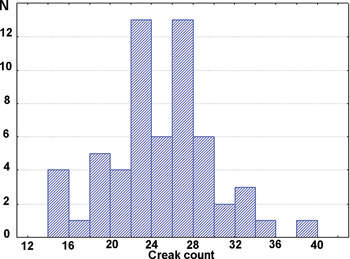
A total of 52 sperm whales were sighted and recorded over at least one full dive cycle: two in 2001, four in 2002, 10 in 2003, 10 in 2004 and 26 in 2005. Surveys were carried out from late June (week no. 26) until mid-August (week no. 33), but 56% of the data were obtained during week no. 30 and week no.31 (end of July and beginning of August). Data were obtained for 156 complete dives in total, making an average of 3 dives per individual, with 10 single dive cases and 42 sightings including sequences of up to seven (2 cases), eight and nine (1 case each) consecutive dive cycles. IPI measurements were possible from 144 dive recordings, which enabled length and body mass estimates of 43 individuals (Figure 2). Ncreak was obtained for 64 complete dives and 31 individuals (Figure 3): unsuccessful creak counting was mostly due to confusion resulting from multiple individuals foraging in close proximity. Time variables related to surface/dive cycles were measured for 62 to 123 dives (Table 2). The spatial distribution of dives extended from the Gulf of Lion to the western Ligurian Sea (Figure 1): most of the locations were close to the shelf break, with a mean D200 of 11.9 km, varying from 0 to 67 km (standard deviation (SD) = 11.6 km) and bottom depth from 200 m to 2500 m (mean 1348 m).
Distribution of body masses estimated from inter-pulse interval measurements.

Distribution of creak counts per dive (north-western Mediterranean 2001–2005, N = 64).

Descriptive statistics for some foraging dive variables (2001–2005).

SD, standard deviation; IPI, inter-pulse interval.
Dive cycles
The average dive duration was 43.9 minutes (SD = 6.2, range 31–53 minutes). When taking individual sperm whales as sample units (N = 24), the stepwise regression selected the body mass as the only significant variable (P = 0.0010), with the hour as a complementary variable (P = 0.1844). The average dive duration of individual whales could be expressed by the equation (R2adjusted = 0.343):
 $$\hbox{DTdive} \,\lpar\! \min\!\rpar = 36.13 + 0.66\, \hbox{M} - 0.24\, \hbox{H}$$
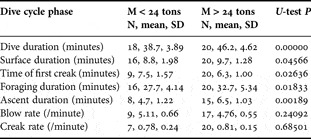
As whale size distribution was bi-modal (Figure 2), average durations of different phases of the dive cycle were calculated by splitting the data set in two classes: whales below or over 24 tons in estimated mass (Table 3). All temporal variables of the dive cycle were significantly different between these classes (U-test, P < 0.05): surface durations, shorter for smaller whales (8.8 minutes against 9.7 minutes), dive duration, higher for bigger whales (46.2 minutes against 38.7 minutes), as well as foraging duration (32.7 minutes against 27.7 minutes). Ascent durations were longer for whales >24 tons (6.5 minutes against 4.7 minutes: Table 3), and time of first creak was longer for smaller whales (7.5 minutes against 6.3 minutes).
Dive cycles of sperm whales for two size-classes (2001–2005).
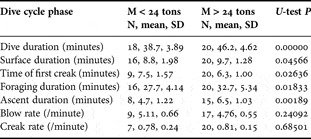
SD, standard deviation.
By contrast, both creak and blow rates were not significantly different (Table 3): individuals with estimated body mass <24 tons (N = 7) emitted 0.78 creaks per minute on average, compared to 0.81 creaks per minute for whales > 24 tons (N = 20). However, the mean blow rate of individual whales (N = 19) was significantly linked (R2adjusted = 0.562, P < 0.0278) to the mean creak rate of individuals (P = 0.042) and their estimated body mass (P = 0.049), and to a lesser extent to DXdive and DTdive:
 $$\eqalign{\hbox{Mean blow rate} &= 2.89 + 0.81 \hbox{ creak rate} - 0.46\, \hbox{M} \cr &\quad + 0.40 \hbox{ DXdive} + 0.30 \hbox{ DTDive}}$$
Despite some differences in durations of dive phases, ratio of average foraging duration to total cycle duration (similar to ‘dive efficiency’ defined by Watwood et al., Reference Watwood, Miller, Johnson and Madsen2006) was similar for the smaller and larger whales (respectively 58.5% and 58.6%).
When each dive cycle (N = 43) was considered as a sample unit (rather than individual whale), the dive duration regression was highly significant (P < 0.0002, R2adjusted = 0.468) and included five variables entered in the analysis: Ncreak (P = 0.029), DXdive (P = 0.024), DTsurface (P = 0.0057), hour (P = 0.017) and bottom depth (P = 0.041). T1stcreak and bathymetric sine were not retained by the regression. The dive duration was then expressed by the equation:
 $$\eqalign{\hbox{DTdive } \lpar \min\rpar &= 27.2 + 0.28 \hbox{ Ncreak} + 0.29 \hbox{ DXdive} \cr &\quad + 0.33 \hbox{ DTsurf} + 0.26\, \hbox{Z} - 0.29\, \hbox{H}}$$
Thus, when setting apart the influence of whale size (body mass), the duration of dive was positively related to creak count (Ncreak), distance covered (DXdive), bottom depth (Z) and surface time spent after the dive (DTsurf).
When only dive time variables were examined in a multiple regression, the foraging duration was significantly correlated to ascent duration and surface duration, but T1stcreak was not retained (N = 44, P < 0.0046, R2adj = 0.193):
 $$\hbox{DTforaging } \lpar\! \min\!\rpar = 31.3 - 0.30 \hbox{ DTascent} + 0.25 \hbox{ DTsurf}$$
In summary, bigger whales tended to dive longer in deeper water, had longer ascending phase and emitted more creaks. Longer dive durations were associated with deeper water, longer distance between dives, and surface duration and tended to occur earlier in the day. Blow rate was higher for smaller whales and higher creak rate.
Creak rates for individual whales
For individuals, creak rates were investigated using averaged dive variables. Analysis of variance showed that creak rates varied significantly between individuals for 6 whales for which more than 3 dive cycles were recorded (f = 5.01, P = 0.0043).
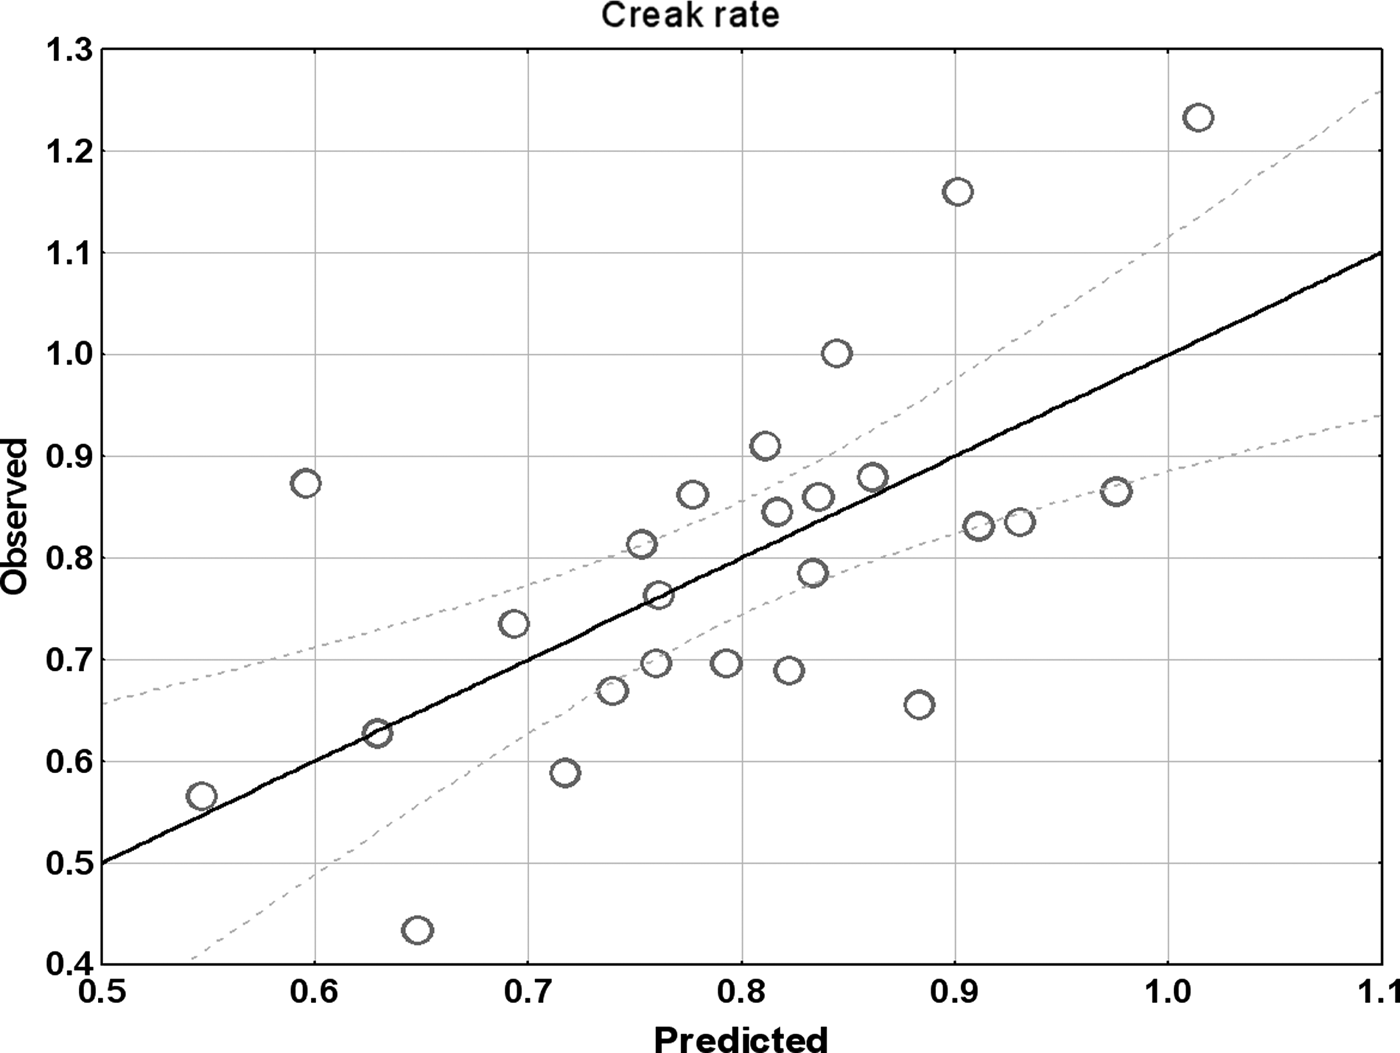
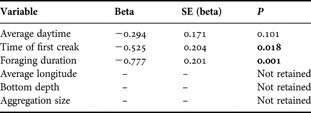
A stepwise ascending regression was fitted to the creak rate data, taking the following variables into account: aggregation size, time of day, longitude, bottom depth, T1stcreak, DTforaging. With a sample set of 25 individuals, a significant regression was obtained (P = 0.0071, R2adjusted = 0.349) (Table 4; Figure 4). Creak rates of individual whales were significantly and negatively related to time of first creak (P = 0.018), foraging duration (P = 0.001), and, to a lesser extent, to time of the day (P = 0.001):
 $$\eqalign{\hbox{Creak rate } \lpar /\min\rpar &= 2.35 - 0.78 \hbox{ DTforaging} \cr &\quad - 0.52 \hbox{ T}1^{\rm st} \hbox{creak} - 0.29\, \hbox{H}}$$
Multiple linear regression for creak rates of individual whales.
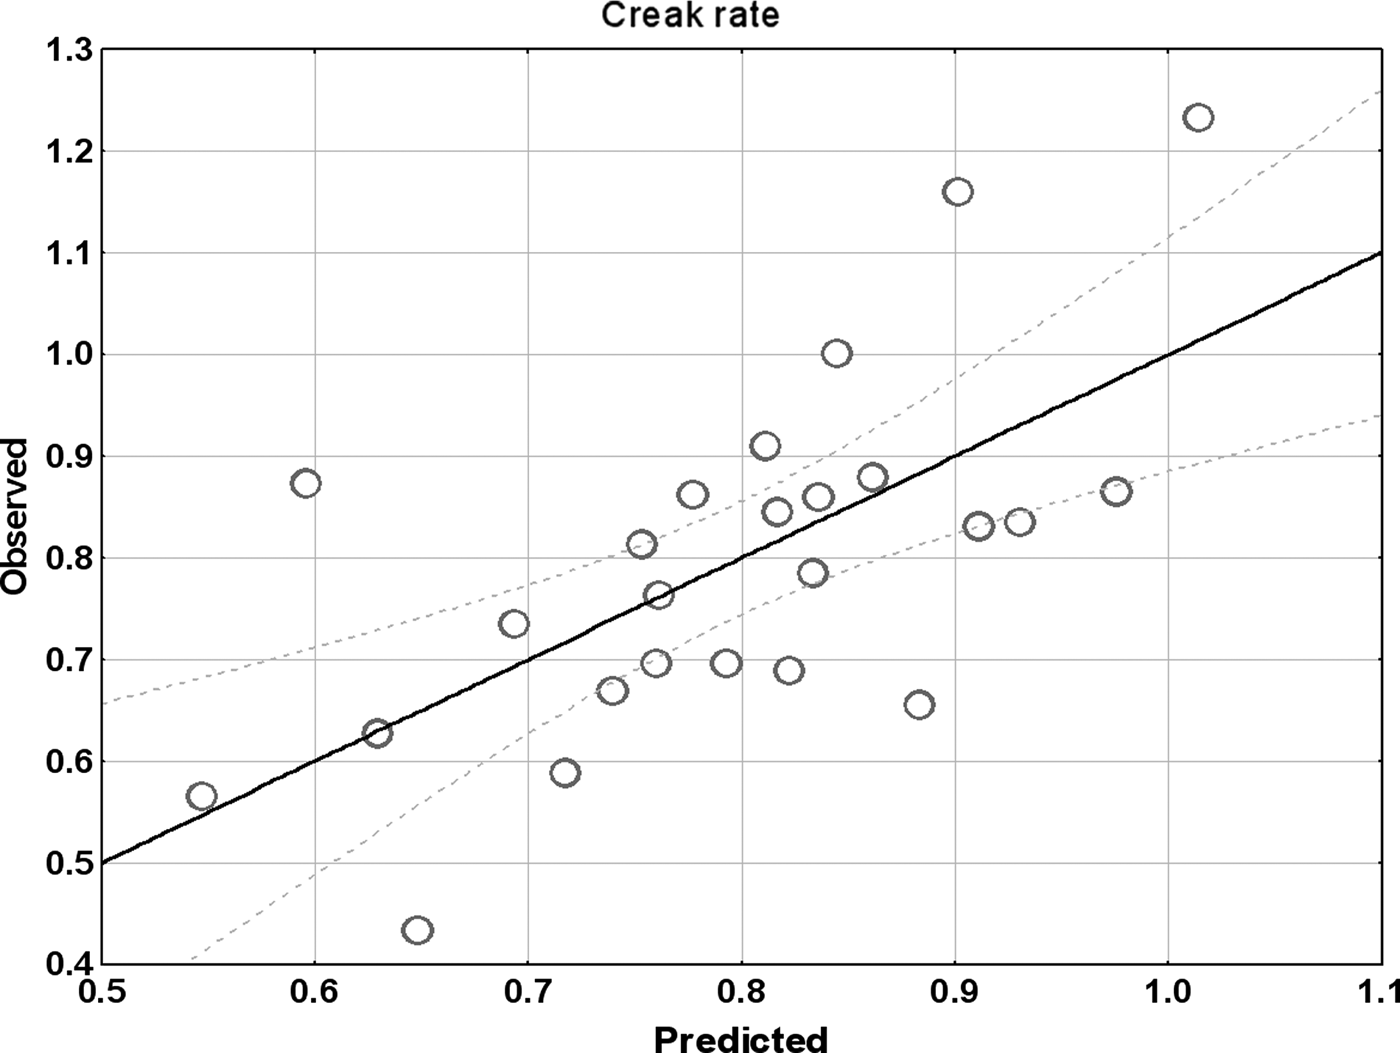
Multiple linear regression for creak rates of individuals (N = 25). Significant variables are indicated in bold.

SE, standard error.
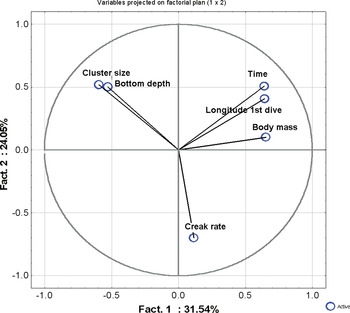
A PCA was performed with the same variables, with D200 excluded as it was strongly correlated to bottom depth. Three eigenvalues explained 77% of the variance: the first one (Factor 1, 31.5% of the variance) was positively linked to estimated body mass, time of day and longitude (coefficient 0.58), and negatively related to aggregation size (coefficient −0.70). The second eigenvalue (Factor 2, 24.1% of the variance) was closely related to creak rate. PCA factorial plans (1 × 2) show the independence of creak rate and estimated body mass (Figure 5).
Creak rate variables for individual whales projected on principal component analysis factorial plan (1 × 2).

In summary, creak rate of individual whales appeared to be independent of whale size and tended to decrease with foraging duration and time of first creak. Creak rates also decreased with time of the day.
Creak rates and dives
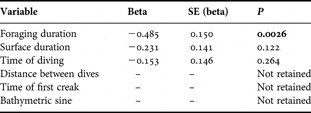
To investigate creak rates of dives, only variables related to dive cycles were considered in the regression analysis: time of the day, distance between dives (DXdive), bottom depth, time of first creak, foraging duration and surface duration (following a dive). Variables related to body mass and geographical position of the whales were not included in the analysis, although, as shown above (Table 5), they significantly influence foraging attempt rate across individuals. The sample set included 40 dive cycles, and a significant regression (P < 0.001, R2adjusted = 0.306) retained DTforaging as the only significant variable (P = 0.0026), DTsurf and time of the day being also selected, but with lower significance (respectively P = 0.12 and 0.26). The resultant regression function was:
 $$\eqalign{\hbox{Creak rate } \lpar /\min\rpar &= 1.57 - 0.485 \hbox{ DTforaging} \cr &\quad - 0.23 \hbox{ DTsurface} - 0.15\, \hbox{H}}$$
Results of the multiple linear regression for creak rate of dives (N = 43). Significant correlation is indicated in bold.

SE, standard error.
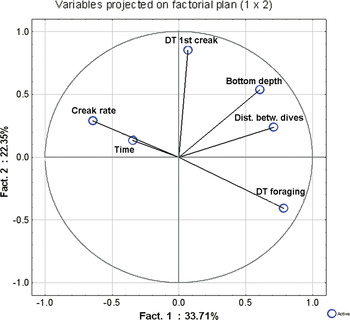
The PCA showed that three eigenvalues (factors) explained 73% of the variance. The first factor, explaining 33.7% of the variance was positively linked to the distance between dives, and foraging duration. The second eigenvalue explained 22.4% of the variance and mainly represented T1stcreak. When variables were plotted on factorial plan (1 × 2), creak rate was negatively related to the foraging duration, both being independent of bottom depth, and to some extent to T1stcreak (Figure 6).
Creak rate variables for dives projected on principal component analysis factorial plan (1 × 2).

In summary, creak rates during dives were mostly influenced by the duration of the foraging phase, the shorter the foraging the higher the creak rate.
DISCUSSION
Creak counting as a method to assess foraging activity
Whitehead & Rendell (Reference Whitehead and Rendell2004) used defecation rates as a proxy of foraging success in the eastern Pacific Ocean. Miller et al. (Reference Miller, Johnson and Tyack2004a) used creak counting to quantify prey capture attempts. Data from archival tags (DTags) deployed on whales in the Ligurian Sea and the Gulf of Mexico showed that an average of 32.3 creaks/hour were emitted during the bottom phase of dives, and that whales displayed dive inflections as well as pitch and roll angle variations in relation to creak emissions. Creaks were mostly produced as soon as a whale had reached its preferred depth range, where most of active foraging takes place: Teloni (Reference Teloni2005) indicated that the first creak of a dive was heard in average 7.4 minutes after the first usual click. Miller et al. (Reference Miller, Johnson and Tyack2004a) mentioned creak counts of 20.1 creaks/dive, while Watwood et al. (Reference Watwood, Miller, Johnson and Madsen2006) give 18.5 creaks/dive for the Mediterranean Sea and Teloni (Reference Teloni2005) mentioned creak counts ranging from 5 to 21 per dive. Differences in creak counts could reflect differences in survey areas (i.e. in this study, whales were recorded in areas westward from the Ligurian Sea) and/or to differences in methodology. Miller et al. (Reference Miller, Johnson and Tyack2004a) and Watwood et al. (Reference Watwood, Miller, Johnson and Madsen2006) processed data obtained from tag deployments, while Teloni (Reference Teloni2005) used beam forming processing from a 128-element towed array to detect whales at long range.
Madsen et al. (Reference Madsen, Wahlberg and Møhl2002) indicated that creak pulses had a much lower source level (179–205 dB ref 1 µPa@1m, rms) compared to usual clicks (220–236 dB ref 1 µPa@1m, rms), therefore, creaks might not be audible in regular click sequences recorded from distant whales. In our study, sperm whales were usually located 200–3000 m (horizontal distance) from the hydrophone during a recording. Several recordings with a poor signal/noise ratio were discarded from our data set. The main limitation of our creak counting method was the risk of confusion between multiple audible whales in a recording: to deal with this issue, data collected in presence of whale aggregations were discarded from the creak count analysis.
Discrepancies in creak counts might also arise if whales are disturbed by the recording technique, as might happen when whales are tagged. To avoid such a bias, Miller et al. (Reference Miller, Johnson and Tyack2004a) discarded the first dive after the tagging operation from the data processing, as they noted that whale dives were usually shorter immediately after this contact. In our study, we discarded data from one particular dive when the whale was approached less than 50 m for photo-identification purpose: its subsequent deep dive was short, with a low creak count (13 creaks). Furthermore this whale engaged in a sustained lob-tailing after the next surfacing.
Assessing sperm whale feeding ecology through creak counting may be unreliable if whales capture prey without emitting a creak. Whales could for example catch bioluminescent squid after approaching the prey to a distance where it can be visually detected, either by counter-illumination, or through active bioluminescence (Fristrup & Harbison, Reference Fristrup and Harbison2002). Miller et al. (Reference Miller, Johnson and Tyack2004a) did not exclude the possibility that creaks could have the function of provoking the movement of bioluminescent squid prey. In spite of growing evidence that large toothed whales echolocate to locate and approach prey (André et al., Reference André, Johansson, Delory and Van der Schaar2007; Madsen et al., Reference Madsen, Wilson, Johnson, Hanlon, Bocconcelli, Aguilar de Soto and Tyack2007), we cannot exclude the possibility that in some instances a prey is captured without production of a creak. In this case however, the whale would presumably increase its regular click rate during approach, and interrupt clicking to swallow the prey. For instance, we detected ‘silent periods' of similar duration as creaks are preceded by a similar increase in usual click rate during deep dives (on average about 1.5 per dive). These silences might be indicative of a prey capture without close range sonar use. In addition to normal creaks and silences, we also noticed that some creaks were not terminated by the usual short pause (Miller et al., Reference Miller, Johnson and Tyack2004a) that might be necessary either to catch or swallow the prey, or to recycle air after a creak emission. These creaks are perhaps indicative of an aborted feeding attempt because some squids might be able to escape their predator, and were not included in our creak count.
Creak counting to assess foraging success is certainly not efficient in all circumstances, in particular because sperm whales could use alternative tactics to approach and catch prey. But we obtained consistent results throughout our study, i.e. an average count of 24.8 creak per dive with a reduced SD of 5.5 (Table 2), in agreement with previous studies using other acoustic techniques.
In this study, creak rate was used to study foraging activity, instead of simple creak counts per dive. If we assume that creak is a valuable proxy for a capture attempt, or even for a catch, simple creak count would be useful to study whale feeding dive success and whale strategy to catch a given amount of prey during every dive. Under the same assumptions, creak rate is a better variable to study feeding ecology, i.e. the relationship between whales and a local environment: for example we showed that creak rate of whales were consistent across two size-classes. Creak rate has the potential to be a robust feeding ecology indicator, like defecation rate, which has been used in other regions (Rendell et al., Reference Rendell, Whitehead and Escribano2004). Comparison of creak rates in a given area across different years could then be indicative of the local prey availability. Because many creaks are emitted during each dive and whales can be monitored for several dives in a row, creak rate could be a very sensitive indicator.
Creak rates of individual whales
In our study, larger sperm whales performed significantly longer foraging dives with higher creak counts, but this resulted in a consistent creak rate across both size-classes: whales below 24 tons of estimated mass produced less creaks, 20.2 per dive on average, compared to animals over 24 tons of mass (25.6 creaks/dive), but during shorter dives. However, once accounting for the total dive cycle duration (dive + surface), smaller whales had a lower creak rate (25.2 creak/hour) compared to bigger individuals (28.5 creak/hour). Smaller animals may have a lower energetic demand: even if the specific metabolic rate slightly decreases for bigger animals (Kleiber, Reference Kleiber1975), larger whales would need to catch more prey to meet their energetic requirements, estimated to be equivalent to 3% of their weight in terms of daily intake (Lockyer, Reference Lockyer1981).
The higher energetic demand might alternatively be obtained by targeting different prey species or sizes. Sperm whales in the north-western Mediterranean Sea display two habitat preferences: they frequently use the northern continental slope (Gannier et al., Reference Gannier, Drouot and Goold2002), which was our study area, but they also gather offshore close to the northern Balearic Front (Gannier & Praca, Reference Gannier and Praca2007). These areas might host different prey species compared to the Ligurian Sea, however, no data on squid abundance and distribution is available in this region.
Longer dives and higher creak rates were observed earlier in the day. There are few published results dealing with the daily variation of sperm whale feeding cycles. However, Amano & Yoshioka (Reference Amano and Yoshioka2003) presented dive profiles obtained from a single whale during 62 successive hours: the dive pattern displayed dive-free periods during the afternoon or early evening. Furthermore, although their tag was not suited to sound recording, the authors indicated that some dives featured ‘inactive’ bottom phase, which they interpreted as resting dives. Both results could suggest that afternoon dives might be less prey-efficient in some cases, which is in agreement with the lower creak counts observed in our study.
Although dive depth could not be derived from our study, we noticed that DTascent, the duration from last click to surfacing, was substantially shorter for whales <24 tons (N = 8) compared to individuals >24 tons (N = 15) in mass (4.7 and 6.5 minutes, respectively). Miller et al. (Reference Miller, Johnson, Tyack and Terray2004b) studied this aspect of sperm whale dives and indicated that descent was significantly faster than ascent (trajectory speed of respectively 1.63 versus 1.45 m/s). Using the average ascent speed of 1.45 m/s from Miller et al. (Reference Miller, Johnson, Tyack and Terray2004b), we could roughly estimate the depth of whale at the end of the foraging phase (last click emitted): 426 and 609 m for whales <24 and >24 tons respectively). With the assumption of a vertical velocity not directly affected by sperm whale size, this suggests that larger whales would generally end their foraging phase deeper than smaller ones. Jochens et al. (Reference Jochens, Biggs, Benoit-Bird, Engelhaupt, Gordon, Hu, Jaquet, Johnson, Leben, Mate, Miller, Ortega-Ortiz, Thode, Tyack and Würsig2008) showed that creak rates obtained for 26 tagged whales were consistently higher for the deeper diving whales. Their result strengthens the assumption that increasing the foraging depth is a way for sperm whales to obtain a higher foraging success.
Creak rates and dive variables
When considering individual dives, the foraging duration was the most significant variable influencing foraging success. Creak rate was 0.80 creak/min on average, with a moderate variance (SD = 0.16) and only few cases presented a creak rate <0.6 or >1.0 creak/minute. This relatively consistent creak rate across dives, and the significant relationship found between the foraging duration and the number of creaks produced per dive suggest that sperm whales optimize feeding success by increasing the time spent foraging rather than by increasing the rate of prey capture. An increased creak rate might possibly be obtained by swimming faster while echolocating for distant prey, in order to increase the scanned water volume. However, if we assume that sperm whales use a stroke-and-glide swimming mode during their bottom phase as they do during the ascent (Miller et al., Reference Miller, Johnson, Tyack and Terray2004b), increasing the speed would mean more active stroking, hence a higher energetic demand with a possible break of the aerobic mode of feeding dives (Watwood et al., Reference Watwood, Miller, Johnson and Madsen2006). Opting for a longer bottom phase is perhaps the most cost-effective way to optimize foraging success. The distance between dives (DXdive) appeared to be directly related to the amount of time spent foraging (DTforaging). Since sperm whales are expected to perform U-shaped dives in several regions, moving principally horizontally during the bottom phase (Amano & Yoshioka, Reference Amano and Yoshioka2003; Watwood et al., Reference Watwood, Miller, Johnson and Madsen2006), it is likely that whales lengthen their dive duration to extend the distance covered at foraging depth in order to maximize food intake. The average horizontal speed, when measured in a straight line between two successive fluking locations, was quite variable (mean 0.96 m/s, SD = 0.32, range 0.19–1.67), as was a zigzag index calculated between the initial and the final fluke-up of a dive series (range 1.05–2.18). This variability suggests that whales at foraging depth do not always move in a straight line but probably make changes in their heading, thereby reducing more or less significantly the horizontal distance achieved between consecutive dives (assuming a constant speed at depth). Therefore, sperm whales appeared to adapt the duration of their foraging dive and horizontal movement at depth according to prey availability in a given region. Watwood et al. (Reference Watwood, Miller, Johnson and Madsen2006) observed that dive durations in three different regions were very similar, but that whales emitted more creaks per dive in the Atlantic Ocean, compared to the Ligurian Sea (22.6 versus 18.5 respectively); they argued that whales in the Ligurian Sea increase time at foraging depth by decreasing the transit time from surface to foraging depth. But Miller et al. (Reference Miller, Johnson, Tyack and Terray2004b) showed that sperm whales have little variation in vertical speed during the transit phases, the steady stroke descent, and the stroke-and-glide ascent.
CONCLUSION
Our results suggest that larger whales extend their dive duration to catch more prey than smaller ones, both categories showing a similar creak rate, when referenced to the foraging duration. Creak rate was shown to be lower in the afternoon compared to the morning: this is likely to be related to prey accessibility. For instance, prey may be located in deeper layers during the afternoon, a trend linked to vertical migration behaviour observed for several squid species. Our study confirmed that passive acoustics can be used to study the feeding ecology of sperm whales in some circumstances. The method based on towed-hydrophone recordings worked consistently well during five years within the study area, where whales are mostly encountered alone or in loose aggregations. One limitation of this methodology is the processing of data obtained from whale clusters, as distinguishing the click sequences and creaks of a given individual whale in a cacophony of clicks is not reliable. Several aspects of foraging ecology need further investigation for this technique to be used as a robust proxy to evaluate foraging success. While it is tempting to use creaks as direct indices of absolute foraging success, this is not a safe method because it is still not clear what proportion of sperm whale creaks represents genuine prey capture rather than capture attempts, nor whether this proportion is constant. Also, it is possible that some prey are visually detected at short range (through bioluminescence), and can be caught without creak emission. Nevertheless, the creak-counting approach might still be a useful way of detecting trends and assessing factors influencing dive patterns. Passive acoustics enables the monitoring of sperm whale foraging in the north-western Mediterranean Sea and could be carried out consistently to evaluate interannual variability in the feeding ecology of this species.
ACKNOWLEDGEMENTS
We thank Ministère de l'Ecologie et du Développement Durable for contributing funding to this study, benevolent observers for their participation in surveys and three anonymous referees for their important suggestions to improve our manuscript.