Implications
Improving feed efficiency in growing pigs by increasing lean growth rate has resulted in a decreased feed intake (FI). It also impacted the dynamics of FI and growth. Amino acid requirements larger than usual feed recommendations were estimated at the beginning of the growing period for the most efficient animals. In addition, parameters from growth and FI models showed good genetic properties with respect to FI and efficiency. Feeding strategies need to be adjusted to cover the requirements of the most efficient animals, and growth and FI dynamics could be envisaged as tools to improve feed efficiency.
Introduction
The pig industry has to adapt to increasing pressure on feed costs (Kanis et al., Reference Kanis, de Greef, Hiemstra and van Arendonk2005), with renewed interest in improving feed efficiency by combining nutritional, genetic and management practices. With recent developments of precision feeding concepts and associated technologies, the nutritional approach consists of adjusting the feed composition to the day-to-day requirements of every animal’s requirements in a group (Pomar et al., Reference Pomar, Hauschild, Zhang, Pomar and Lovatto2010). The genetic approach is usually applied to feed efficiency measured for the whole growing period, using feed conversion ratio (FCR) or residual feed intake (RFI) as selection criteria. To combine the two time scales, modelling BW or protein deposition (PD) has been proposed to describe the dynamics of growth and predict nutrient requirements in the growing pig (Ferguson and Gous, Reference Ferguson and Gous1993). These approaches are rarely applied for genetic selection purposes despite their potential to capture the biological traits underlying the breeding objectives (Fowler et al., Reference Fowler, Bichard and Pease1976). Indeed, the dynamics of feed intake (FI) is a major driving force for growth and body composition (protein or lipid). The FI curves are usually obtained as a function of the BW, and several equations are available in the literature (Black, Reference Black2009). Growth or PD is generally represented as a Gompertz function on age of the animal with three parameters having a biological meaning (Wellock et al., Reference Wellock, Emmans and Kyriazakis2004). The InraPorc® (2006) model integrates these concepts, and associates the dynamics of growth and FI to predict nutrient requirements (van Milgen et al., Reference van Milgen, Valancogne, Dubois, Dourmad, Seve and Noblet2008). The objectives of this study were (1) to use growth and FI modelling to evaluate nutritional requirements for pigs according to their level of feed efficiency measured as RFI or FCR, (2) to estimate the genetic relationships between feed efficiency and model parameters for growth and FI, and to evaluate the impact of selection for feed efficiency on the dynamics of growth and FI to propose nutrient recommendations.
Material and methods
Design and animals
Data were collected in 2010 in three French central test stations (Le Rheu, Ille-et-Vilaine; Argentré, Mayenne; Mauron, Morbihan) on castrated males from Large White dam (LWD), Large White sire (LWS) and French Landrace dam (LR) breeds. Data were obtained in accordance with national regulations of humane care and use of animals in agriculture. The data collection has been described in Saintilan et al. (Reference Saintilan, Mérour, Brossard, Tribout, Dourmad, Sellier, Bidanel, van Milgen and Gilbert2013). In brief, herdbook participants supplied the central test stations with 8 to 12 piglets of similar weight and age, with an objective of two piglets per litter. Rarely, 13 or 14 piglets were penned together. Animals were raised from 35 kg±2 (BW1) to 107±7 kg (BW2) in pens of 12 animals equipped with single-place electronic feeders (Acema 48 in Argentré and Acema 64 in Le Rheu and Mauron) (Acemo, Pontivy). At the end of the test, pigs were slaughtered in a commercial abattoir (at SOCOPA (Evron) for the Argentré station and at Cooperl (Montfort-sur-Meu) for Le Rheu and Mauron stations) on the week when they reached 107 kg BW. Animals were offered ad libitum a single pelleted diet during the test based on cereals and soybean meal. The diet provided 9.5 MJ of net energy (NE) and 156 g of crude protein per kg, with a minimum of 0.87 g of standardized ileal digestible lysine (dLys) per MJ of NE.
Data recording
BWs at the beginning and at the end of the test were available (BW1 and BW2) from the standard test procedure of the stations. To obtain sufficient data for modelling, an additional weighing was applied at ∼60 kg BW on the group of pigs retained for the study (tested in year 2010). In practice, this resulted in at least three BW (35±2, 63±9 and 107±7 kg BW) for each pig. Average daily gain (ADG) and average daily feed intake (ADFI) were computed for the test duration, and the test FCR was calculated. Carcasses (with head and feet and without kidney fat) were chilled in a cooling room at 4°C for 24 h and right half-carcasses were cut according to a standardized procedure (Métayer and Daumas, Reference Métayer and Daumas1998). Dressing percentage (DP) was defined as the ratio of cold carcass weight over the BW recorded in vivo after a 16-h fast. Carcass backfat thickness (BFT: average of backfat depths at the shoulder, midback and loin sites on the mid-dorsal line) and weights of primal cuts (shoulder, ham, loin, belly and backfat) after carving of the right-half carcass were recorded. Lean meat content (LMC) was estimated from a linear combination of ham, loin and backfat weights expressed as percentages of the cold half-carcass weight (Daumas, Reference Daumas2008). The RFI was computed within breed as described by Saintilan et al. (Reference Saintilan, Mérour, Brossard, Tribout, Dourmad, Sellier, Bidanel, van Milgen and Gilbert2013) by a multiple linear regression of ADFI on average metabolic BW during the test, ADG, LMC, BFT and DP. Traits were pre-corrected with a linear model (proc GLM, SAS, 2010) including the fixed effects of contemporary group and the number of pigs present in the pen when the first pig ended the test (three classes: <8, 8 to 11, >11). A total of 379 LWD, 215 LWS and 327 LR were tested in 2010.
Feed efficiency groups
Groups of animals tested in 2010 were defined within breeds based either on FCR corrected with a linear model (proc GLM, SAS, 2010) including the fixed effects of the contemporary group (eight levels) and the number of pigs in the pen when the first pig ended the test (three levels), or on RFI. The 25% best animals using the RFI criterion (lowest values) were included in a RFI− (FCR−, respectively) group (89 animals), the 25% worst animals (highest values) were included in a RFI+ (FCR+, respectively) group (89 animals), the remaining 50% were in a RFI0 (FCR0, respectively) group (178 animals).
Individual FI and growth curves modeling, digestible lysine requirements
Daily FI was available for each test day between BW1 and BW2. Simultaneous modelling of FI (expressed on an NE basis) and growth was carried out for each pig individually using the InraPorc® software as described by Vautier et al. (Reference Vautier, Brossard, van Milgen and Quiniou2013). The method is based on the concept of inverted modelling (Doeschl-Wilson et al., Reference Doeschl-Wilson, Knap, Kinghorn and van der Steen2007), in which real data are compared with model outputs and model parameters are adjusted iteratively to minimize the difference between predicted and observed values. A calibration procedure based on a Broyden–Fletcher–Goldfarb–Shanno optimization method was applied to fit the equations for FI and growth (through PD) to observation with the assumption that energy or nutrients were not limitating during the test. In the model, the Gompertz function is used to model PD during growth (van Milgen et al., Reference van Milgen, Valancogne, Dubois, Dourmad, Seve and Noblet2008). The lipid deposition (LD) is then estimated from the energy consumed and the energy required for maintenance, physical activity and PD. The BW is finally estimated from the predicted protein and lipid mass. Among the different equations available in InraPorc® to model FI, the gamma function was retained (Vautier et al., Reference Vautier, Brossard, van Milgen and Quiniou2013). It describes FI as multiples of the maintenance requirements: a mature animal (with a high BW) eats only for maintenance and has no growth. With this function, FI at a given age is described using two parameters a and b:
 $${\rm FI}=[a{\times}(b{\times}{\rm BW}{\times}e^{{({\minus}b{\times}{\rm BW})}} ){\plus}1]{\times}0.75{\times}{\rm BW}^{{0.60}} $$
(where FI is expressed as NE and assuming a maintenance energy requirement of 0.75 MJ/kg BW0.60/day). Some pigs were eliminated after this step (23 LWD, 12 LR and 38 LWS) because of recording inconsistencies for FI or BW, insufficient adjustment to the real data set (R² lower than 0.99), calibration failure, unrealistic estimates compared with previous studies, or high sensitivity of estimations to nutrient supply. This procedure estimated five model parameters (Age35, meanPD, Bgompertz, FI50 and FI100) for each pig, plus one derived from the model parameters (Duration):
-
• Three for growth curves: age when the pig reached 35 kg BW (Age35), mean daily PD between 35 and 110 kg BW (meanPD), and precocity coefficient of the Gompertz function (Bgompertz, a high value is associated with a high PD at the beginning of the test). The number of days required to reach 110 kg BW from 35 kg BW (Duration) is calculated from the three previous parameters.
-
• Two for FI curves: expected NE consumed at 50 and 100 kg BW (FI50 and FI100), calculated using estimated coefficients a and b of the gamma function.
Finally, in InraPorc® dLys requirements are estimated using a factorial approach, accounting for maintenance, PD and efficiency of Lys utilization (van Milgen et al., Reference van Milgen, Valancogne, Dubois, Dourmad, Seve and Noblet2008). Daily dLys requirements were calculated individually with InraPorc® on the basis of modeled PD and observed growth and FI curves.
Statistical analyses
First, exact Fisher tests were applied to test the deviation of the distribution of the pigs of the RFI groups into the FCR groups from the proportions of animals independently distributed in the FCR groups (25%, 50% and 25%), as well as to test the distribution of the pigs of the FCR groups into the RFI groups.
Second, the effects of the feed efficiency groups on production traits and on model parameters were evaluated for each breed using the following linear models (proc GLM, SAS, 2010):
 $$\eqalignno{y_{{ijk}} =\,\mu {\plus}{\rm CG}_{i} {\plus}{\rm FEG}_{j} {\plus}a{\times}{\rm BW}_{{\rm 1}} {\plus}e_{{ijk}} \,{\rm for \ ADG},\cr {\rm FCR},{\rm RFI\ and\ ADFI}$$
 $$y_{{ijk}} =\mu {\plus}{\rm CG}_{i} {\plus}{\rm FEG}_{j} {\plus}b{\times}{\rm carcW}{\plus}e_{{ijk}} \,{\rm for\ LMC\ and\ BFT}$$
 $$\eqalignno{ y_{{ijk}} = & \mu {\plus}{\rm CG}_{i} {\plus}{\rm FEG}_{j} {\plus}c{\times}{\rm Age}{{35}} {\plus}e_{{ijk}} \,{\rm for\ model} \cr & {\rm parameters},{\rm except\ Age}{{{\rm 35}}} $$
where CG i is the i th contemporary group (eight levels), FEG j is the j th feed efficiency group (three levels, either RFI−/RFI0/RFI+ or FCR−/FCR0/FCR+), carcW is the cold carcass weight after slaughter and a, b, c are the regression coefficients on the covariates in each model.
Third, for each breed, ADFI (kg/day), ADG (kg/day) and dLys requirements (g/MJ NE) obtained from the kinetics at nine different ages, every 10 days from 78 to 148 days of age plus at 154 days of age, were compared for the effect of feed efficiency groups at successive ages using a linear mixed model (proc MIXED, SAS, 2010) at nine different time points with the following model:
 $$\eqalignno{ y_{{ijkl}} = \,& \mu {\plus}{\rm CG}_{i} {\plus}{\rm FEG}_{j} {\plus}d_{k} {\times}{\rm Age}_{k} {\plus}{\rm FEG}_{j} ({\rm Age}_{k} ) \cr & {\plus}{\rm animal}_{{ijl}} {\plus}f_{k} {\times}{\rm BW}_{{(k)}} {\plus}e_{{ijkl}} $$
where Age k is the k th age of the nine tested ages and d k the corresponding regression coefficient, animal ijl the random effect of the repeated animal across ages, BW (k) the covariate of the BW of the animal at Age k and f k the corresponding regression coefficient, FEG j (Age k ) the feed efficiency group effect within Age k . Within age, contrasts between least square means of feed efficiency groups were tested with a t-test accounting for multiple testing within ages. Significant results were reported for P<0.0167 (0.05/3 tests).
Finally, genetic parameters were estimated by extending the data set to animals tested between 2005 and 2009 in the three breeds, giving a total of 5364 LWD, 1095 LWS and 3101 LR pigs. These additional pigs had only two BW measurements, at the beginning and at the end of test (BW1 and BW2), during the test. As a consequence they had no estimates for model parameters, but they had records for all production traits recorded on related pigs raised in 2010. Variance components were therefore estimated using these additional data to provide maximum pedigree information for animals having records in 2010, and to maximize the number of performance available on ADFI, ADG, RFI and FCR. Through the genetic architecture of the traits, this ensured sufficient accuracy for estimation of variance components of model parameters available only for pigs raised in 2010. Variance components were estimated using the restricted maximum likelihood methodology applied to an animal mixed model (WOMBAT software, Meyer, Reference Meyer2006). Heritabilities were estimated in single-trait analyses and genetic correlations in two-trait analyses. The single-trait models were the following:
 $$\eqalignno{ y_{{ijk}} = \,& \mu {\plus}{\rm CG}_{{i}} {\plus}e{\times}{\rm BW}_{{\rm 1}} {\plus}a_{{ijk}} {\plus}{\rm litter}_{j} {\plus}e_{{ijk}} \,{\rm for\ ADG}, \cr & {\rm FCR},{\rm RFI\ and\ ADFI} $$
 $$\!\!\!\!\!\!\!\!\!\eqalignno{y_{{ijk}} =\,\mu {\plus}{\rm CG}_{i} {\plus}f{\times}{\rm carcW}{\plus}a_{{ijk}} {\plus}{\rm litter}_{j} {\plus}e_{{ijk}} \,\cr {\rm for\ LMC\ and\ BFT}$$
 $$\ \,\eqalignno{ y_{{ijk}} = \,& \mu {\plus}{\rm CG}_{i} {\plus}g{\times}{\rm Age}{{{\rm 35}}} {\plus}a_{{ijk}} {\plus}{\rm litter}_{j} {\plus}e_{{ijk}} \,{\rm for\ model} \cr & {\rm parameters},{\rm except\ Age}{{{\rm 35}}} $$
where CG i is the contemporary group i (within breed, 186 levels), e, f, g are the regression coefficients for the covariates, a ijk is the random effect of the animal distributed with variance A σ² A , with A the parenty matrix computed from the pedigree relationships and σ² A the genetic variance of the trait, litter j is the random effect of the common environment of litter j (except for Bgompertz, for which the full model lacked convergence). Two-trait models were similar but for a covariance matrix between the random effects. The pedigree file (29 967 animals) contained six generations of ancestors in addition to the animals tested from 2005 to 2010.
Results
Feed efficiency groups
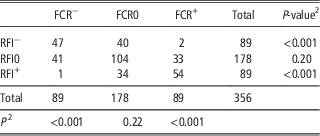
The analysis of growth and FI curves of the 2010 animals with respect to feed efficiency groups will be reported only for the LWD breed in detail, general trends being similar for all breeds (Supplementary Figures S1 and S2). The distribution of animals between feed efficiency groups is given in Table 1. The RFI− animals were mainly distributed in the FCR0 (45%) and the FCR− (53%) groups (P<0.001), whereas the RFI+ animals were mainly distributed in the FCR0 (38%) and FCR+ groups (61%; P<0.001). The RFI0 animals were distributed in all FCR groups (P>0.05), with a majority (58%) in the FCR0 group. Similar distributions of the FCR groups with respect to the RFI groups were observed. The phenotypic correlation between RFI and FCR estimated on these data was 0.70±0.01.
Contingency table of the animals among the feed efficiency groups in the Large White dam breedFootnote 1

FCR=feed conversion ratio; RFI=residual feed intake.
1 RFI−=25% pigs with lower RFI; RFI0=50% pigs with intermediate RFI; RFI+=25% pigs with higher RFI; FCR−=25% pigs with lower FCR; FCR0=50% pigs with intermediate FCR; FCR+=25% of pigs with higher FCR.
2 P-value of exact Fisher tests of the deviation of the observed distribution within rows and lines from the expected proportion of animals in the groups (25%, 50% and 25%).
Phenotypic means and feed efficiency groups
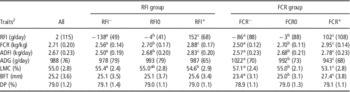
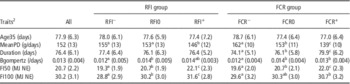
Means of production traits for all LWD animals tested in 2010 and for feed efficiency groups are given in Table 2. Average RFI was close to zero, and phenotypic standard deviation was 115 g/day. The ADFI and FCR were significantly different between RFI groups. No group difference for ADG, BFT and DP was observed with respect to RFI. However, the RFI+ group had a significantly lower average LMC than the RFI−group. For model parameters, predicted outputs were in good accordance with recorded performances for BW1, BW2, ADG, FCR and ADFI, with correlations higher than 0.94 for LR, 0.95 for LWD and 0.97 for LWS (results not shown), indicating a good accuracy of model parameter estimation. All RFI groups reached BW2 after the same Duration (Table 3), which is consistent with the results on ADG. The FI50 and the FI100 showed the same differences as ADFI between RFI groups. The MeanPD was not significantly different between the RFI− and RFI0 groups, but was significantly lower in the RFI+ group. The Bgompertz was significantly lower in the RFI− group compared with the RFI0 group, and Bgompertz tended to differ between the RFI− and RFI+ groups (P=0.06).
Summary statistics for the traits measured in the Large White dam breed on all pigs (n=356, means with standard deviations in brackets) in the test stations for year 2010, and for each of the feed efficiency groupsFootnote 1 (least squares means with standard deviations in brackets)

RFI=residual feed intake; FCR=feed conversion ratio; ADFI=average daily feed intake; ADG=average daily gain; LMC=lean meat content; BFT=backfat thickness; DP=dressing percentage.
1 RFI−=25% pigs with lower RFI; RFI0=50% pigs with intermediate RFI; RFI+=25% pigs with higher RFI; FCR−=25% pigs with lower FCR; FCR0=50% pigs with intermediate FCR; FCR+=25% of pigs with higher FCR.
2 For each feed efficiency criterion and each trait, different superscript letters mean significant LSMEANS differences at P<0.05 in a linear model including the fixed effects of the contemporary group and the feed efficiency group, plus covariates BW1 for ADG, FCR, RFI and ADFI, and cold carcass weight for LMC and BFT.
Summary statistics for the model parameters in the Large White dam breed on all pigs in the test stations for year 2010 (n=356, means with standard deviation in brackets), and for each of the feed efficiency groupsFootnote 1 (least squares means with standard deviations in brackets)

RFI=residual feed intake; FCR=feed conversion ratio.
1 RFI−=25% pigs with lower RFI; RFI0=50% pigs with intermediate RFI; RFI+=25% pigs with higher RFI; FCR−=25% pigs with lower FCR; FCR0=50% pigs with intermediate FCR; FCR+=25% of pigs with higher FCR.
2 Age35=age of the pig at 35 kg; Duration=difference between the age of the pig at 110 kg and Age35; MeanPD=average daily protein deposition between 35 and 110 kg; Bgompertz=precocity coefficient; FI50=net energy (NE) intake at 50 kg BW; FI100=NE intake at 100 kg BW. For each feed efficiency criterion and each trait, different superscript letters mean significant LSMEANS differences at P<0.05 in a linear model including the fixed effects of the contemporary group and the feed efficiency group, plus the covariate Age35 for all parameters except Age35.
Significant differences were observed between FCR groups for RFI, ADFI, ADG, LMC and BFT (Table 2). The FCR− group showed higher values of LMC and ADG, and lower values of ADFI, RFI and BFT. The Age35 did not differ among the three FCR levels. The Bgompertz mean of the FCR− group was lower than for the FCR0 and FCR+ groups that showed no difference. In accordance with significant differences between FCR groups for ADG and LMC, the Duration and MeanPD were significantly different among FCR groups: Duration was lower and MeanPD higher for the FCR− group. Contrasts between FCR groups for FI50 were all significant and in accordance with group differences for ADFI. The contrast was also significant for FI100 between the FCR− and FCR+ groups. It only tended to be significant between the FCR− and FCR0 groups, and it was not significant between the FCR0 and FCR+ groups.
FI, growth and lysine requirements curves
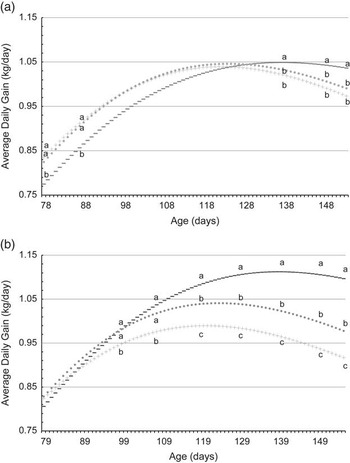
The average profiles for ADG as a function of age are presented in Figure 1. The ADG presented an increase during the first part of the growing period and a decrease afterwards. Pigs from the RFI+ and RFI0 groups had similar dynamics for ADG, ranging from 0.80 to 1.04 kg/day with a maximum value at ∼123 days of age. In comparison with the other groups, the RFI− group had a significantly lower ADG until 90 days of age, and higher ADG after 140 days of age. This resulted in a later maximum ADG (1.05 kg/day) for the RFI− group at 138 days of age. This was consistent with the group differences for Bgompertz (Table 3). For FCR groups, no ADG difference between groups was observed until 90 days of age. From 100 days of age onwards, ADG was significantly lower in the FCR+ group compared with the other groups. After 120 days of age, ADG was significantly different among the three FCR groups. Differences increased until the end of the test, the FCR− group having significantly higher ADG. Maximum ADG were reached at 142, 123 and 120 days of age for the FCR−, FCR0 and FCR+ groups, respectively, with maximum values of 1.11, 1.04 and 0.99 kg/day, respectively. For ADFI (curves not shown), during the whole test period the RFI− (or FCR−) group had significantly lower values than the RFI0 (or FCR0) group, which had significantly lower ADFI than the RFI+ (or FCR+) group. The group difference remained constant during the test for the RFI groups (about 300 g/day between RFI− and RFI+ pigs), whereas it decreased from 300 g/day at the beginning of the test to 40 g/day at the end between FCR− and FCR+ groups.
Average daily gain (kg/day) during growth for the RFI groups (a); RFI−: dashed line; RFI0: dotted line; RFI+: crosses) and for the FCR groups (b); FCR−: dashed line; FCR0: dotted line; FCR+: crosses). At each tested age, different letters mean significant differences between feed efficiency group LSMEANS at P<0.05 in a mixed model including the contemporary group, the feed efficiency group, the animal age at the time point considered, and the interaction between the age and the feed efficiency group as fixed effects, the BW at the tested age as a covariate and repetition of the animal at the nine different time points tested as a random effect of the model. RFI=residual feed intake; FCR=feed conversion ratio.

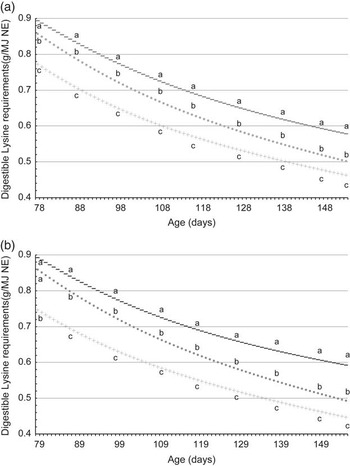
In addition, the kinetics of PD during the test showed a pattern similar to that of ADG and significant differences were found for all tested ages between high and low feed efficiency groups. The RFI− and RFI+ groups had initial PD of 125 and 128 g/day (P>0.05), and final PD of 163 and 141 g/day (P<0.05), respectively. In comparison, the FCR− and FCR+ groups had initial PD of 130 and 127 g/day (P<0.05), and final PD of 174 and 132 g/day (P<0.05), respectively. The maximum values for PD were 165 g/day at 135 days of age for the RFI− group, 154 g/day at 117 days of age for the RFI+ group, 176 g/day at 142 days of age for the FCR− group and 147 g/day at 116 days of age for the FCR+ group. The estimated average dLys requirements decreased with age for all groups (Figure 2) and were significantly different between groups at all ages. Average requirements ranged from 0.89 to 0.58 g/MJ NE for the RFI− group and from 0.77 to 0.46 g/MJ NE for the RFI+ group. Similar trends were observed for the FCR groups, with larger differences between the extreme groups (about 0.15 g/MJ NE). From the beginning to the end of the test, average dLys requirements ranged from 0.89 to 0.59 g/MJ NE and from 0.74 to 0.45 g/MJ NE for FCR− and FCR+ animals, respectively.
Digestible lysine requirement (g/MJ NE) during growth for the RFI groups (a: RFI−, dashed line; RFI0, dotted line; RFI+, crosses), and for the FCR groups (b: FCR−, dashed line; FCR0, dotted line; FCR+, crosses). At each tested age, different letters mean significant differences between feed efficiency groups at P<0.05 in a mixed model including the contemporary group, the feed efficiency group, the animal age at the time point considered, and the interaction between the age and the feed efficiency group as fixed effects, the BW at the tested age as a covariate and repetition of the animal at the nine different time points tested as a random effect of the model. NE=net energy; RFI=residual feed intake; FCR=feed conversion ratio.

Variance components
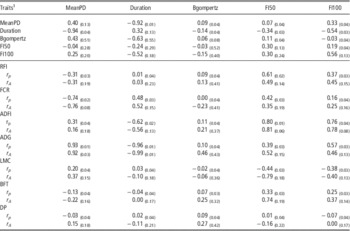
Phenotypic correlations between model parameters, and between model parameters and production traits, are reported in Table 4. The MeanPD was highly negatively correlated with Duration and moderately positively correlated with FI100. Duration was moderately negatively correlated with FI50 and FI100. The FI50 was moderately positively correlated with FI100. The Bgompertz had only low correlations with the other parameters. The phenotypic correlation of MeanPD was very high with ADG and negative with RFI (−0.31±0.04) and FCR (−0.74±0.02). Correlations between MeanPD and carcass composition traits (LMC and BFT) were moderate to low. It was close to zero with DP. Duration was closely correlated with ADG, moderately correlated with FCR (0.48±0.03), and independent from RFI and body composition traits. The FI50 and FI100 were closely and positively correlated with ADFI, positively with RFI, FCR and BFT and negatively with LMC. Phenotypic correlations between Bgompertz and traits were all very low, the highest estimate was with ADFI (0.11±0.04).
Heritabilities (diagonal), phenotypic (above diagonal) and genetic (below diagonal) correlations for model parameters (upper part), and phenotypic (r P ) and genetic (r A ) correlations between model parameters and traits (lower part), with standard errors in brackets, estimated on 5364 LWD, 1095 LWS and 3101 LR pigs

RFI=residual feed intake; FCR=feed conversion ratio; ADFI=average daily feed intake; ADG=average daily gain; LMC=lean meat content; BFT=backfat thickness; DP=dressing percentage; LWD=Large White dam breed; LWS=Large White sire breed; LR=French Landrace dam breed.
1 MeanPD=average protein deposition between 35 and 110 kg; Duration=difference between the ages of the pig at 35 and 110 kg; Bgompertz=precocity coefficient; FI50=net energy (NE) intake at 50 kg BW; FI100=NE intake at 100 kg BW.
Heritabilities for model parameters were moderate (Table 4) ranging from 0.30±0.13 (FI50) to 0.56±0.13 (FI100), except for Bgompertz (0.06±0.08). Despite large standard errors due to the limited size of the data set, genetic correlations (Table 4) were similar to phenotypic correlations in both direction and magnitude, and showed a general genetic consistency between model parameters and production traits. The highest genetic correlations between RFI and model parameters were estimated for FI50 and FI100 (around 0.45), and the largest genetic correlation with FCR was found for MeanPD (−0.76±0.08). None of the genetic correlations between Bgompertz and other traits differed from 0.
Discussion
Phenotypic means and feed efficiency groups
The distribution of the animals between feed efficiency groups showed only partial concordance between extreme RFI and extreme FCR values, in accordance with the phenotypic correlation (0.74±0.01) and genetic correlation (0.52±0.05) estimated between FCR and RFI in a previous study of the same Large White maternal population (Saintilan et al., Reference Saintilan, Mérour, Brossard, Tribout, Dourmad, Sellier, Bidanel, van Milgen and Gilbert2013). Comparing average trait values between the feed efficiency groups also illustrated correlation estimates previously reported with RFI and FCR on similar (Gilbert et al., Reference Gilbert, Bidanel, Gruand, Caritez, Billon, Guillouet, Lagant, Noblet and Sellier2007; Cai et al., Reference Cai, Casey and Dekkers2008) or different (Clutter, Reference Clutter2011; Saintilan et al., Reference Saintilan, Mérour, Brossard, Tribout, Dourmad, Sellier, Bidanel, van Milgen and Gilbert2013) breeds. Because of its calculation, RFI is phenotypically independent from ADG, LMC, BFT and DP, and the corresponding genetic correlations are expected to be low. As a result, no significant differences were expected for these traits between RFI groups. Only the slight difference for LMC between the RFI− and RFI+ groups did not support this expectation.
Mean values for growth and FI model parameters were in agreement with those reported by Brossard et al. (Reference Brossard, van Milgen, Lannuzel, Bertinnoti and Rivest2006) in pigs from a three-way cross and by Vautier et al. (Reference Vautier, Brossard, van Milgen and Quiniou2013) in LW×Piétrain pigs. To describe growth and FI dynamics, the InraPorc® software estimates parameters with biological meaning that can be interpreted as production indicators for the growing-finishing period. For example, the MeanPD was a good indicator of ADG in our study. InraPorc® requires individual FI records and regular weightings during the growing period. Three BW records regularly distributed during growth were the minimal information required to accurately estimate these parameters, which required an extra weight to be recorded on the 2010 animals. The Duration was the same for all RFI groups, in agreement with ADG values. The lower Bgompertz in the more efficient groups suggests a reduced PD in more efficient pigs at the beginning of the test, despite no significant correlations between Bgompertz and FCR or RFI. Shirali et al. (Reference Shirali, Doeschl-Wilson, Knap, Kanis, Duthie, van Arendonk and Roehe2014) suggested higher Bgompertz related to lower residual energy intake. In Shirali et al. (Reference Shirali, Doeschl-Wilson, Knap, Kanis, Duthie, van Arendonk and Roehe2014), average trait values were compared between two lines with different selection objectives and between groups of pigs with different ADG. This strategy could capture relationships between traits and model parameters driven by ADG differences that we did not see in our study. The similar Age35 for the three RFI groups suggests that ADG would also be similar between RFI groups before 35 kg BW. However, different BW at birth and growth rate before weaning have been reported for lines divergently selected for RFI (Gilbert et al., Reference Gilbert, Bidanel, Billon, Lagant, Guillouet, Sellier, Noblet and Hermesch2012). When feed efficiency is assessed by FCR, more efficient pigs begin the test 2 days after the others, again suggesting lower ADG from birth to 35 kg than FCR+ and FCR0 pigs, but stay 3 to 6 days less on test, possibly due to the higher MeanPD and ADG of FCR− pigs. Specific studies dedicated to the post-weaning period are needed to get further insights on relationships between early growth and feed efficiency.
FI, growth and lysine requirement curves
The RFI or FCR groups showed different growth rates and dynamics of PD. Regarding RFI groups, the PD remained high until the end of the test in the more efficient animals compared with the other groups. This cannot be revealed when studying ADG for the whole test period, because the correlations between RFI and ADG are generally close to zero, as shown in an earlier study of genetic parameters between the production traits in the same commercial populations (Saintilan et al., Reference Saintilan, Mérour, Brossard, Tribout, Dourmad, Sellier, Bidanel, van Milgen and Gilbert2013). Different dynamics of LD for the three RFI groups were also suggested by the InraPorc® model (results not shown), with a higher rate of LD in the RFI+ group leading to higher lipid content at the end of the test in this group. The RFI group differences for BFT are by definition not significant, confirming that differences in LD between animals are not properly accounted for by easily accessible indicators of whole body lipid composition such as BFT, LMC and DP (Kloareg et al., Reference Kloareg, Noblet and van Milgen2006). For example, differences in intramuscular fat content between groups of pigs observed between lines divergently selected for RFI (Faure et al., Reference Faure, Lefaucheur, Bonhomme, Ecolan, Meteau, Metayer Coustard, Kouba, Gilbert and Lebret2013) are not corrected in the regression equation for RFI computation. The InraPorc® model might also not be relevant to accurately predict LD when RFI is examined, as LD is an energy sink in the model. For a given growth rate, differences in FI between animals result in differences in LD in InraPorc®, whereas some differences in maintenance requirements are also expected when comparing high and low RFI animals. To properly disentangle these components, models and indicator traits have to be refined to improve the prediction of the distribution of LD in different body parts, and to better predict energy distribution between maintenance and tissue deposition. The comparison of growth curves with respect to FCR groups confirmed that more efficient pigs had greater ADG and body leanness, and reduced BFT at the end of the test. This is consistent with their higher PD compared with the other groups, and with correlations between FCR and production traits reported in previous studies (Clutter, Reference Clutter2011).
The higher dLys requirements for the RFI− group, despite production levels similar to those of the RFI+ group, confirm the metabolic differences previously reported between low and high RFI pigs, such as lower protein turnover and energetic metabolism (Le Naou et al., Reference Le Naou, Le Floc’h, Louveau, Gilbert and Gondret2012), higher energy efficiency (Barea et al., Reference Barea, Dubois, Gilbert, Sellier, van Milgen and Noblet2010) and lower feeding and physical activity (Meunier-Salaün et al., Reference Meunier-Salaün, Guérin, Billon, Priet, Sellier, Noblet and Gilbert2014). Higher dLys requirements (in g/MJ NE) of more efficient animals were also found by Brossard et al. (Reference Brossard, Gilbert, Billon and van Milgen2012) when comparing two lines of Large White growing pigs divergently selected for RFI, and by Quiniou et al. (Reference Quiniou, Courboulay, Salaün and Chevillon2010) when comparing performances of entire male, barrows and gilts with respect to FCR. Altogether, similar dLys requirements were estimated for the more efficient RFI and FCR groups, however, potentially related to different metabolic strategies. The estimated dLys requirements of some of the 25% most efficient pigs with RFI or FCR (0.9 g/MJ EN on average) were greater at the beginning of the growing period than the typical diets offered to growing pigs formulated with dLys contents between 0.8 and 0.9 g/MJ NE. The InraPorc® model assumes that the efficiency of dLys utilization does not differ between pigs. It might actually not be the case, which could imply that most efficient animals were actually not restricted, or adversely that some less efficient animals were actually restricted. Altogether this supports the need to revisit feed formulation to fulfill the requirement of the most efficient animals and to adapt the feeding tightly and dynamically, for instance, through precision feeding techniques (Pomar et al., Reference Pomar, Hauschild, Zhang, Pomar and Lovatto2009). These kinetic differences between FCR or RFI groups described for the LWD population were also found for the other two breeds, with different magnitudes and levels. In the maternal LR breed, the maximum dLys requirements were similar to the LWD breed. In the paternal LWS breed, the dLys requirements at the beginning of the test were 0.95 g/MJ NE, and they reached 0.90 g/MJ NE after 9 days of test (Supplementary Figure S2). The dLys requirements of crossbred commercial products cannot be predicted from our study, but they are likely to be intermediate between our estimates for maternal and paternal breeds. Finally, dLys requirements for entire males are expected to be higher than for gilts and barrows (Dunshea et al., Reference Dunshea, Allison, Bertram, Boler, Brossard, Campbell, Crane, Hennessy, Huber, de Lange, Ferguson, Matzat, McKeith, PJU, Mullan, Noblet, Quiniou and Tokach2013), so the upcoming castration ban in the European Union will reinforce the need to redefine dLys requirements to maximize production efficiency during the early growth phase.
Genetic parameters for growth and FI model parameters
Previous estimates of heritabilities and genetic correlations for parameters of similar Gompertz growth functions in growing pigs were obtained on Large White lines divergently selected for RFI (Gilbert et al., Reference Gilbert, Al Aïn, Sellier, Lagant, Billon, Bidanel, Guillouet, Noblet, van Milgen and Brossard2009). Gilbert et al. (Reference Gilbert, Al Aïn, Sellier, Lagant, Billon, Bidanel, Guillouet, Noblet, van Milgen and Brossard2009) found for entire males a heritability estimate of 0.18±0.05 for Bgompertz, which is higher than the value observed in the present study, as well as a higher estimate for FI50 (0.41±0.03) computed by use of a power function to model FI. In this earlier study, the highest genetic correlation between model parameters and RFI was found, as in our study, with FI50. Cai et al. (Reference Cai, Kaiser and Dekkers2012) compared growth and FI model parameters between a line selected for low RFI and a control line in pigs. They reported no line difference for kinetics before 200 days of age using the traditional Gompertz growth function applied to growth and FI. Mostly using this traditional Gompertz growth function, previous studies also reported moderate to high heritability estimates for model parameters related to growth. Estimates ranged from 0.31 to 0.82 in pigs (Doeschl-Wilson et al., Reference Doeschl-Wilson, Knap, Kinghorn and van der Steen2007; Koivula et al., Reference Koivula, Sevon-Aimonen, Strandén, Matilainen, Serenius, Stalder and Mäntysaari2008; Cai et al., Reference Cai, Kaiser and Dekkers2012), apart for the estimate of the energy requirements for maintenance (0.11) in Doeschl-Wilson et al. (Reference Doeschl-Wilson, Knap, Kinghorn and van der Steen2007), from 0.22 to 0.55 in chicken (Mignon-Grasteau et al., Reference Mignon-Grasteau, Beaumont, Le Bihan-Duval, Poivey, de Rochembeau and Ricard1999; N’Dri et al., Reference N’Dri, Mignon-Grasteau, Sellier, Tixier-Boichard and Beaumont2006) and from 0.14 to 0.29 in sheep (Abegaz et al., Reference Abegaz, van Wyk and Olivier2010). These results suggest that model parameters can respond to selection, and consequently the dynamics of FI and growth. In addition, Doeschl-Wilson et al. (Reference Doeschl-Wilson, Knap, Kinghorn and van der Steen2007) reported higher heritability estimates of model parameters compared with those of measured performances of similar meaning. This was interpreted as model parameters capturing underlying biological components of production traits, thus being less subjected to environmental or nuisance components. This difference is not observed in our study when comparing the heritability estimates of model parameters with those reported in the same populations in Saintilan et al. (Reference Saintilan, Mérour, Brossard, Tribout, Dourmad, Sellier, Bidanel, van Milgen and Gilbert2013) for the production traits, potentially partly due to relatively high standard errors of our estimates for the model parameters.
With the InraPorc® model, FI50 is the model parameter showing the best genetic correlation with feed efficiency and a high correlation with ADFI. This trait might be directly recorded with an electronic feeder and an appropriate weighing plan to be used as a proxy for FI or feed efficiency of the growing pig. However, obtaining accurate estimates of FI at 50 kg BW without specific equipment is not straightforward. The best options to estimate FI50 would be to systematically run FI dynamics model, which requires a mid-growth weight record or automatic weight recording in the pens. This measurement or prediction of FI50 could be used to predict the individual feed efficiency, and the individual dynamics of nutrient requirements during the growing period. Different feeding strategies could then be applied to pigs depending on the animal potential, facilitating precision feeding.
Conclusions
Improvement of feed efficiency in the growing pig leads to correlated changes in the dynamics of FI, growth and amino acid requirements. When FCR is improved, pigs have increased ADG during the whole growing period. In comparison, when RFI is improved, pigs have decreased ADG at the beginning of the growing period and longer persistency of ADG, but the ADG for the test period remains unchanged. These differences in the dynamics of growth result in differences in PD. With both RFI and FCR, improved feed efficiency is correlated with higher dLys requirements, some of the most efficient pigs being restricted in terms of amino acid supply during the first days of the test period when offered a conventional diet. Further genetic improvement of feed efficiency should be examined jointly with appropriate feeding strategies for growing pig.
Acknowledgments
The authors gratefully acknowledge the staff of the three French central test stations and French pig breeding companies for recording and access to the data.
Supplementary material
To view supplementary material for this article, please visit http://dx.doi.org/10.1017/S1751731114002171