Globally, health service providers are under pressure to deliver a continuously improving standard of care with a finite pool of resources. This results in a desire for funding decision makers, such as National Institute of Health and Care Excellence (NICE) in England, Wales, and Northern Ireland, to obtain value for money, often setting thresholds where the price the decision maker is willing to pay is based on the efficacy of the drug. This requires a common scale on which all diseases and interventions can be contrasted. In the United Kingdom, quality-adjusted life-years (QALY) are commonly used, where patients’ predicted life expectancy is multiplied by a value estimating the quality of their life across their lifetime. The resulting cost/QALY is considered alongside other factors, including whether an intervention can be considered to meet end-of-life criteria or an unmet need, before a decision on whether to reimburse a treatment in the National Health Service. Whereas unit prices are often fixed and contain little uncertainty, there is often considerable uncertainty over the clinical outcomes, such as life expectancy, and their associated resource use, with observed data often only spanning a couple of years.
Commonly, progression-free survival (PFS) and overall survival (OS) data are modeled parametrically, with curves extrapolated across the patients’ lifetime time horizon. The choice of parametric curves is often one of the most influential factors of a cost-effectiveness model, with subtle differences between parametric fits over a short follow-up period often yielding large disagreement upon extrapolation. Survival related assumptions often influence the manufacturers discount on the list price (e.g., through a commercial access agreement or patient access scheme) to ensure that the cost-effectiveness results fall within the thresholds NICE considers to be cost-effective. OS extrapolation is often more influential on a cost-effectiveness analysis, as PFS data are more mature with the PFS extrapolations containing less uncertainty.
The NICE Decision Support Unit (DSU) has published Technical Support Document (TSD) 14 which suggests methods on how to assess the suitability of a survival model (Reference Latimer1), although it remains unclear how closely this is adhered to. One of NICE's types of appraisal is the single technology appraisal (STA), where a single intervention is assessed for a single indication. The manufacturer is invited to submit evidence to support the decision-making process. This evidence is assessed by an interdisciplinary evidence review group (ERG), who produce an independent and unbiased report of the evidence that is presented alongside the manufacturer submission to a NICE appraisal committee. The committee then decide whether to fund the intervention, based on the clinical and cost-effectiveness evidence. Further information on the single technology process can be found on the NICE Web site (2).
This study presents a review of STAs of cancer treatments whose guidance was published by NICE in 2017, focusing on the approaches to the extrapolation of survival data. It set out to achieve the following aims: (i) identify methods used by companies in their approaches to survival extrapolation, and investigate whether these adhere to NICE guidance; and (ii) identify whether the methods used by company's result in robust selection of extrapolation and investigate how uncertainty in extrapolations is accounted for.
To achieve these aims, we focused on appraisals of interventions targeting cancers to ensure relevant survival information would be present. We limited the search to STAs to maximize consistency in reporting standards.
Summary of NICE TSD 14 on Survival Extrapolation
NICE TSD 14 (Reference Latimer1) is a report by NICE's Decision Support Unit, providing guidance on survival analysis and extrapolation of survival data within economic evaluations. Section 3 of TSD 14 lists some suggested methods for assessing the suitability of survival models. These are:
Visual Inspection
Comparing the parametric models to the observed Kaplan-Meier data.
Log-Cumulative Hazard Plots
TSD 14 suggests plotting the observed log-cumulative hazard data, usually against log-time, to assess the behavior of the hazard from the observed data, which can assess the suitability of the exponential or Weibull functions. The log-cumulative hazard plot can also be used to assess the hazard proportionality of different treatment arms, helping to decide whether an assumption of proportionality should be maintained in the extrapolation. Other plots such as quantile-quantile (QQ) and graphs of residuals (e.g., Martingale, Schoenfeld) can also be considered.
Information Criterion
The most commonly used information criteria are the Akaike information criterion (AIC) and Bayesian information criterion (BIC). These both allow a comparison of nonnested models, which is necessary due to the differing functional forms of the different parametric models.
Clinical validity and External Data
Comparison of extrapolations of parametric models to predictions made by expert clinical opinion and to data with longer follow-up of similar patients and treatments, typically from other trials or registry databases.
Unless separate forms are strongly justified with clinical expert opinion, biological plausibility and robust statistical analysis, the TSD recommends using the same parametric form for both the intervention and the comparator. An example of an appraisal where separate forms may have been appropriate was TA519 where pembrolizumab (an immunotherapy) was compared with chemotherapies in patients with urothelial cancer (Reference Gallacher, Armoiry and Auguste3).
Methods
Study Eligibility Criteria
For inclusion in this review, only single technology appraisals of interventions for cancerous diseases published in 2017 were targeted.
Search Strategy
A systematic search was completed on the NHS Evidence Search webpage on 16/01/2018, using the terms neoplasm* or neoplasia or tumor* or tumor* or cancer* or carcinoma* or malignan* or adenocarcinoma* or metasta*, filtered to guidance published by NICE in the area of Drugs and Technologies in 2017. A broader search of additional electronic databases was not required due to the particular focus of this review.
Search Selection
P.A. and D.G. independently assessed whether the studies met the inclusion criteria initially at title and abstract, and then at full text, with any disagreements resolved through discussion or recourse to a third reviewer (M.C.).
Data Extraction
Information from each appraisal were collected from the initial set of relevant committee papers into a data extraction form (available on request), performed by D.G. Median and maximum follow-up durations were extracted from text where available, or from Kaplan-Meier plots. Where multiple trials were considered with a single appraisal, the trial with the longest follow-up was used for this analysis.
Quality Assessment
As all appraisals are scrutinized by an ERG and NICE technical team, it was not necessary to use further quality assessment tools.
Results
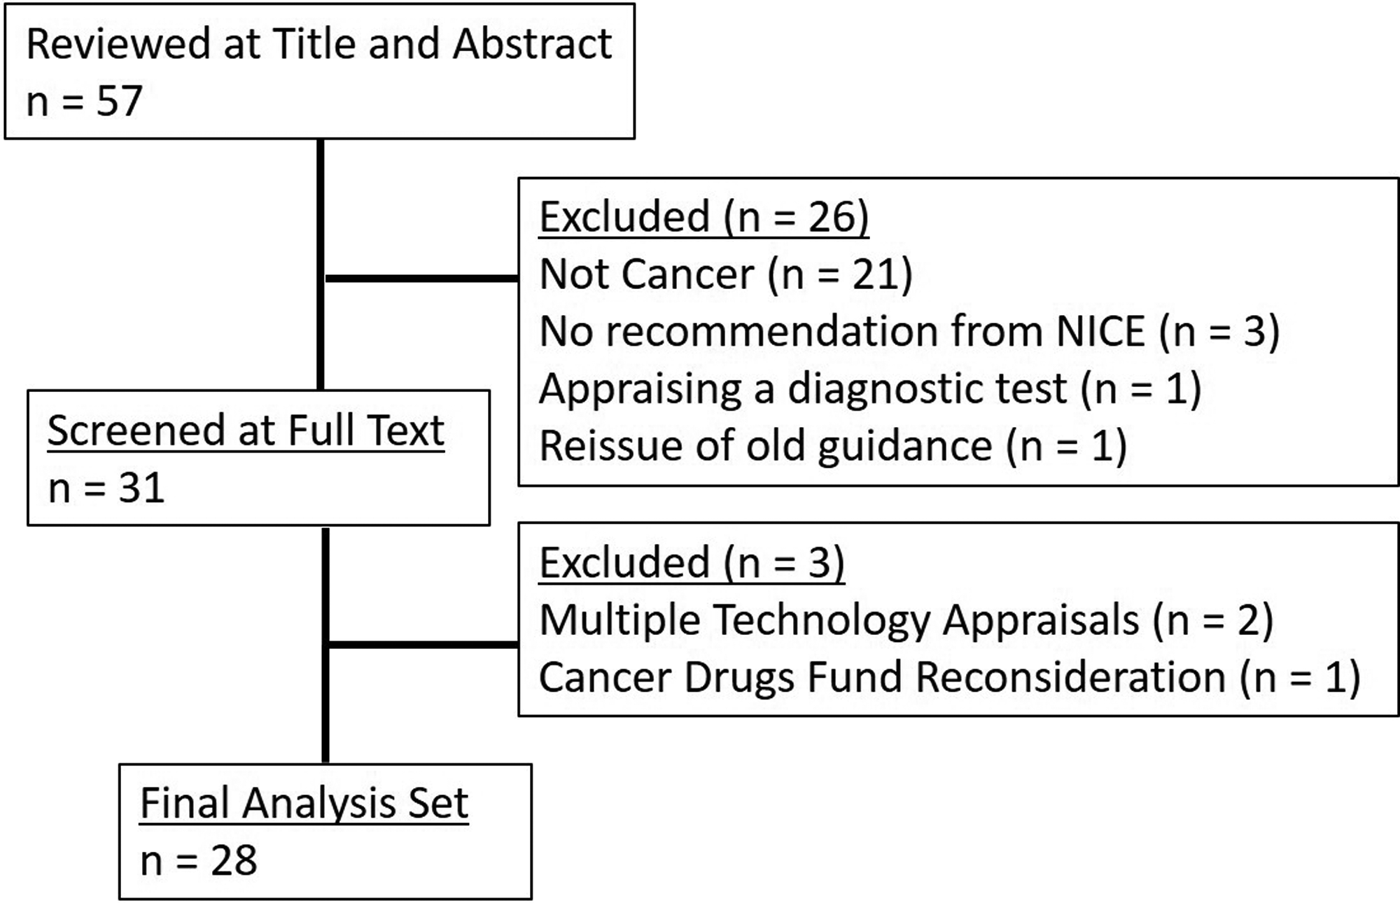
Figure 1 shows the outcomes of the search and screening process, including the reasons for exclusion, in a Preferred Reporting Items for Systematic Reviews and Meta-Analysis (PRISMA) diagram (Reference Liberati, Altman and Tetzlaff4).
PRISMA flow diagram.

The final twenty-eight pieces of guidance covered twenty-two primary interventions across sixteen different diseases. NICE recommended funding through the NHS for eighteen of the appraisals (5–22), eight were recommended for funding through the Cancer Drugs Fund (CDF) (23–30) and two were not recommended for funding (31;32).
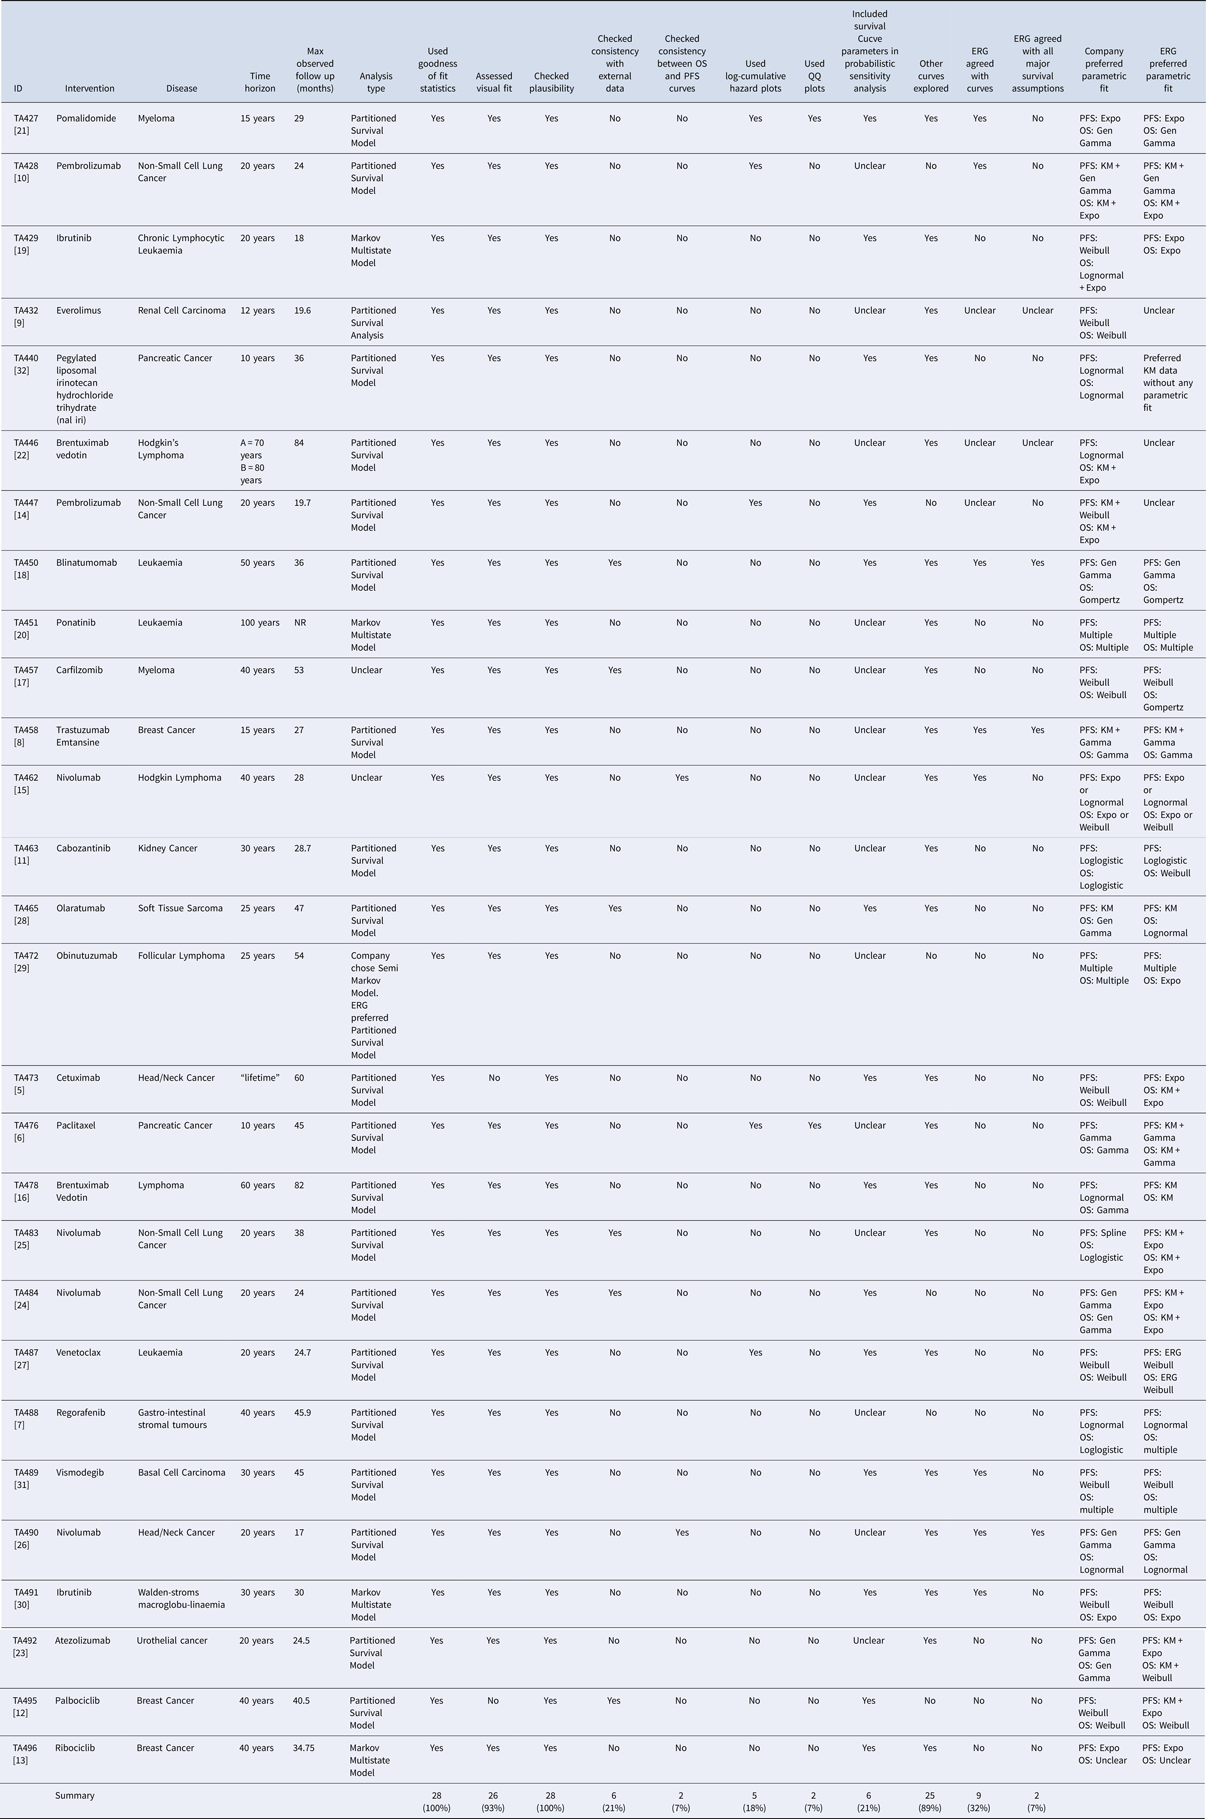
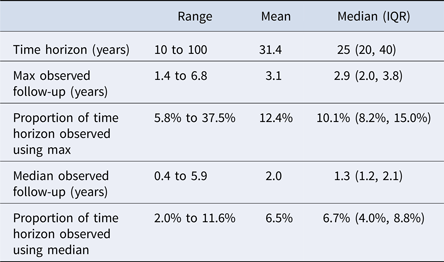
An overview of appraisals included in this review is presented in Table 1 and a summary of the findings is shown in Table 2.
Overview of Single Technology Appraisals Included in This Review

Note. A semi-Markov model's transition probabilities are dependent on the time spent in a health state. A Partitioned Survival Model estimates the proportion in each health state directly from survival curves using mutually exclusive health states.* indicates max follow-up when median was not reported.
ERG, Evidence Review Group; QQ, quantile; Expo, exponential; KM, Kaplan Meier; OS, overall survival; PFS, progression-free survival.
Summary of Additional Findings of This Review

Four submissions used a Markov multistate model to assess cost-effectiveness (13;19;20;30), and twenty-one used a Partitioned Survival model (5–12;14;16–18;21–28;31;32). It was unclear for two submissions which modelling approach was implemented (15;17), and for a further submission both a semi-Markov model and partitioned survival model were presented (29).
Every appraisal used frequentist parametric models to extrapolate at least one set of time-to-event data. In one appraisal splines were submitted as the company base case (25), however, all others opted for a standard parametric form, either exponential, Weibull, log-normal, log-logistic, gamma, generalized gamma or Gompertz. Piecewise modeling featured in eleven appraisals (5;6;8;10;12;14;19;22–25), usually featuring initial KM data being implemented into the economic model, followed by a parametric curve after a certain point in time. This approach was more commonly preferred by ERGs (eight appraisals) than companies (four appraisals). Occasionally, a combination of distinct parametric curves were used to model the same survival outcome, for example, when specific groups of patients had differing levels of risk, which was more common in the Markov models (7;12;15;20;29). In one appraisal, a company choose to model a survival outcome without extrapolating using a parametric form, and instead modeled observed KM data (28), compared with ERGs favoring this approach in three appraisals (16;28;32).
The time horizon of twenty-seven models was reported, ranging from 10 to 100 years, with a mean of 31 years. All models used survival data from at least one clinical trial. The length of maximum observed follow-up periods of the main contributing trials, ranged from 1.4 years to 6.8 years, with a mean of 3.1 years. The percentage of each model's time horizon supported by observed data ranged from 5.8 percent to 37.5 percent with a mean of 12.4 percent. When the analysis was repeated using only reported median follow-up, the observed periods ranged from 0.4 years to 5.9 years, mean 2.0 years and corresponding observed time horizon percentages ranged from 2.0 percent to 11.6 percent, mean 6.5 percent.
All submissions reported using goodness of fit statistics (e.g., AIC and BIC) and plausibility of predictions when selecting the parametric curve. Eighteen reports also considered visual fit of parametric curves to the observed data, predominantly overlaid on a KM plot (8–11;13;18–23;25–31). Six submissions compared extrapolations with external sources of data (12;17;18;24;25;28). Five presented log-cumulative hazard plots (6;10;14;21;27), and two considered QQ-plots (6;21). Only two submissions reported verifying the consistency between PFS and OS curves (15;26). All appraisals used the same functional form for all modeled comparators.
Three company submissions did not present cost-effectiveness results for alternative parametric curves (5;10;14). Five appraisals reported the inclusion of the survival distribution parameters in their probabilistic sensitivity analysis (PSA) (18;19;21;29;32) although it was common for reports to omit the full list of parameters included in the PSA, and it is possible that more PSAs did include survival parameters.
Each submission was critically appraised by an ERG who agreed with the company's choice of parametric fits in nine appraisals (8;10;14;15;18;19;21;26;31). In two appraisals, it was unclear whether the ERG maintained the company's choice or chose different curves (9;16), meaning in most appraisals the ERG disagreed with the company's choice. In terms of broader survival assumptions (including choice of parametric curve), in three appraisals the ERG agreed with all major assumptions made by the pharmaceutical company (8;18;26), and in one of these cases the NICE committee preferred different survival assumptions to those agreed by the ERG and company (26). In all other appraisals, the ERG disagreed with at least one major assumption of the survival extrapolation, for reasons including the methods used for adjusting for crossover, the consideration of internal and external data and the duration of treatment effect.
Discussion
This review of twenty-eight NICE technology appraisal submissions showed that pharmaceutical companies generally take a transparent approach in their modelling and extrapolation of survival data in their economic analyses. We found that extrapolation and curve selection were in line with TSD 14, with a range of parametric models use to predict future survival. We avoided making inference on the specific parametric curves chosen in each appraisal due the wide variety of cancers and interventions covered.
Frequently the reporting of methods of curve selection was not comprehensive with only a couple of the recommended methods by NICE TSD 14 presented in a company submission. It was unclear why other methods were not presented, perhaps due to their discordance with the presented methods, for brevity or the fact that they were never used.
NICE STAs can often go on for many months, requiring multiple committee meetings and generating numerous sets of committee documents for a single appraisal. Inconsistency in NICE's provision of these documents meant it was unclear at how many committee meetings an appraisal was discussed, and masked the identity of the major points of contention. In addition, key information was often redacted, for example, life-year estimates and resulting ICERs, meaning it was difficult to ascertain precisely how influential the survival curves were, and prevented a more quantitative analysis. It was also unclear whether the same definition of median follow-up was used across each appraisal (Reference Betensky33). It is possible that either the company or ERG changed their position on survival assumptions based on additional arguments or data being put forward, which were not captured by this review. The conduct of future reviews would be enhanced with uniformity in the presentation of documentation by NICE, and greater consistency across companies in their presentation of survival extrapolation and justification.
The strengths of this review are that it captures the most up-to-date methods to extrapolate from survival data, across a wide range of interventions and cancers, as well as the types of economic model used. The systematic search identified all relevant appraisals, and summarized their methods of extrapolation and assessing uncertainty.
The limitations of this review are that it covers appraisals from a single year and is specific to cancer. This timeframe may mean it has missed other techniques used by companies.
The findings of this review are generalizable to other disease areas where extrapolations of time-to-event outcomes are of primary concern to the decision maker, particularly where partitioned survival models are suitable. They may not be representative of submissions to other decision makers who do not base decisions on patient population lifetime horizon.
One implication of this review is that the current version of TSD 14 may be insufficient in its instructions for the extrapolation of survival curves, due to the level of disagreement between companies and ERGs.
TSD 14 does acknowledge some limitations to its own recommendations, with an associated paper stating that the model selection algorithm “should not be viewed as a finished product” (Reference Latimer34). The limitations include that the AIC/BIC, visual fit and log-cumulative hazard plots only comment on the observed follow-up period, and do not necessarily infer on the suitability of the predictive ability of a model. These have also been discussed elsewhere (Reference Bagust and Beale35;Reference Latimer36). We agree with Bagust and Beale (Reference Bagust and Beale35) in their response to TSD 14, and believe that assessing the visual fit against a KM plot and log cumulative hazard plots alone can be challenging as several parametric fits can often appear very similar, especially for late observations on the log-time scale. There are few alternative recommendations for robust extrapolations, for example Tremblay et al. (2015) (Reference Tremblay, Haines and Briggs37) published five criteria for transparent extrapolation of survival data, though they are broadly similar to TSD 14. Their fourth criterion was to establish uncertainty in the estimate of marginal difference in treatment effects using bootstrapping, with high uncertainty indicating low robustness. The fifth criterion was to compare the similarity of the observed and extrapolated gains, using a rule of thumb that the ratio of relative difference in the extrapolated period divided by the number of months extrapolated (post-observed period) should not exceed the ratio of the incremental difference for the observed period over the duration of the observed period. These criteria are relatively untested, it is uncertain whether they are suitable for discriminating between different parametric models or whether following them would recommend a different model to following TSD 14.
The TSD is critical of using -2 log-likelihood statistic, instead favoring the AIC and BIC both of which use this statistic in their calculation. Both AIC and BIC favor a parsimonious model, that is considering both the fit to the data and the number of parameters in the model. Although such an approach should be encouraged when adjusting for confounding effects, it is unclear whether using AIC/BIC over -2*log-likelihood statistic leads to a more accurate extrapolation when comparing different parametric forms which have similar numbers of parameters.
We would suggest also comparing a smoothed hazard plot against predicted hazards from the parametric models, without necessarily rescaling time on the log scale. This would allow for easier identification of deviation from the predicted hazards at the later stages of follow-up, and for easier distinction between the parametric curves. This should be done in consideration with the number of patients remaining at risk, as late events may incorrectly make a model appear to be a poor fit.
Another implication is that there is clear potential for companies to implement modern approaches into their economic models. Due to lengthy timelines of the appraisal process, it is possible that the most recent approaches to extrapolating and capturing uncertainty are unlikely to be seen in a STA. There may be resistance to change, with manufacturers perhaps wary of experimenting with new techniques when the approval of their intervention is at stake.
The appraisals in this review all used frequentist methodology to extrapolate survival data and explore uncertainty, despite alternative approaches being available. These approaches may fail to capture uncertainty or unusual hazard behavior, and often exclude prior information. Poly-models, such as the Poly-Weibull model (Reference Demiris, Lunn and Sharples38), assume the presence of multiple independent sources of risk that operate additively. The Poly-Weibull hazard function emerges as the sum of the independent Weibull hazards. Demiris et al. found the Poly-Weibull gave a better fit compared with a single Weibull model in their examples; however, Poly-model fitting can be challenging in the absence of causes of event or when the multiple hazards do not appear distinctly within the modeled data (Reference Demiris, Lunn and Sharples38).
Negrín et al. (Reference Negrín, Nam and Briggs39) use Bayesian Model Averaging (BMA) to capture the uncertainty in the extrapolation of survival curves, which may be superior to conducting separate PSA and scenario analyses with the survival curves. Using BMA to combine the estimates of each parametric fit can produce a prediction for mean survival and a credible interval, removing the need to focus on a single parametric model. Jackson et al. review methods of including external data into survival extrapolations (Reference Jackson, Stevens and Ren40), which may further improve their accuracy.
This review highlights the vast uncertainty that remains in many technology assessments, and raises the question of whether clinical trials should be designed with greater consideration of the funding decision maker.
Further research is recommended into when survival data are mature enough to produce reliable extrapolations. It is plausible that before a certain length of follow-up and number of events, extrapolation is not reliable. This could reduce the need for adjustments to extrapolations, such as waning treatment effects, which are often applied when initial extrapolations are implausible but introduce additional uncertainty for the company, ERG and appraisal committee. Appraisals submitted prior without mature data could be made on a temporary basis, similar to the current running of the CDF in the United Kingdom, where the CDF allows patients access to interventions, which have demonstrated potential to be cost-effectiveness, but where uncertainty remains.
In conclusion, cancer STAs use frequentist parametric approaches to extrapolate survival and explore uncertainty. Despite adhering to TSD 14, pharmaceutical companies specify parametric curves and other assumptions that are routinely rejected by ERGs. More thorough guidance is recommended to ensure methods of curve selection are consistent across appraisals. As extrapolations account for such a high proportion of an economic model's time horizon, it is critical that extrapolations are supported with strong justification. Recent developments in Bayesian approaches to extrapolation and uncertainty were not implemented.
Author ORCIDs
Daniel Gallacher, 0000-0003-0506-9384
Conflicts of interest
None of the authors have any conflicts of interest to declare.