I. Introduction
Statistics on the grape wine market in countries where such wine is not traditionally produced or consumed are often weak or non-existent. If domestic production is insignificant, consumption is usually assumed to be equal to imports less any re-exports (plus net changes in stocks if such data are available). Where there is enough domestic production for wine output statistics to be collected, however, there is a risk those statistics are exaggerated, for two possible reasons. The first reason is if imported bulk wine or wine made from imported concentrated grape juice can be added to domestically produced wine without having to declare on the bottle's front label that the product in the bottle is of mixed or foreign origin (a labelling issue). The second reason, particularly in China, is a double-counting issue. Double counting occurs when domestic wine produced in one region of the country is blended with wine produced in and packaged for final sale from another region: If both regions report inter-regionally traded wine as a product of their respective regions, there will be a degree of double counting in the national wine output data. When domestic production is so exaggerated, and domestic consumption is assumed (typically by analysts outside the country who are handicapped by a language barrier) to be domestic production plus net imports, then consumption also is overstated for that country.
It is also possible that apparent consumption estimates will be inaccurate to the extent that wine re-exports or imports are unrecorded when transported from one customs territory to another. This smuggling issue is more likely to occur, the greater the difference between those territories’ wine taxes.
A further confusion can arise if rice “wine” consumption data are added to the data for grape wine consumption, as Euromonitor International does in its wine industry reports. Rice “wine” is made in numerous Asian countries but each under a different name (e.g., sake in Japan, mijiu in China, cheongju in Korea). Typically, it is at least 15% alcohol, brewed differently than beer, and looks and is drunk like a clear spirit. If it is not to be put in a separate category, then for the purpose of analysing grape wine markets it could be included in the spirits category. In the rest of this article the term “wine” refers just to that made from fresh grapes or grape juice concentrate.Footnote 1
The possibility of wine production and/or consumption “data” being overstated is significant for several reasons. Obviously statistical agencies have an interest in ensuring the accuracy of their published data. Firms seeking to evaluate prospects for selling wine or other beverages in such countries also require accurate data. Furthermore, those concerned with health and social issues associated with excessive alcohol consumption want accurate data on both the aggregate quantity and— because social costs associated with excess consumption typically differ across beverage types—the mix of alcohols consumed.
Now is a good time to focus on this issue because of a new wine regulation in Japan, drafted in 2015 and effective from October 2018,Footnote 2 and also because China has been reviewing and revising its wine-related regulations. This year marks the tenth anniversary of the decisions by China's special administrative regions (SARs) of Hong Kong and Macau to eliminate—in February and August 2008, respectively—their taxes on wine and beer (Yoon and Lam, Reference Yoon and Lam2012). That has distinguished those customs territories from mainland China where wine attracts an import tariff of 14% (or 20% if in containers larger than two litres) plus a consumption tax of 10% and a value-added tax of 17%, cumulating to close to 50%. This is pertinent because the most important emerging grape wine markets in the present decade are in greater China (Anderson and Wittwer, Reference Anderson and Wittwer2015), and that policy reform has made it more lucrative for China's SARs to illicitly re-export wine to mainland China. The incentive for such illicit trade is beginning to diminish though, as more wine-exporting countries sign free trade agreements with China (most recently Australia and Georgia following Chile and New Zealand, all of whose wine will be imported duty free by the end of this decade; and prospectively the European Union).
This article reports grape wine production, consumption, and trade estimates currently available for (mainland) China, Hong Kong, Macau, and Japan, and then offers an alternative set of estimates to show how they change such indicators as per capita wine consumption, wine self-sufficiency, the share of wine in total alcohol consumption, and the region's share of global wine production and consumption. Those indicators are important because our alternative estimates suggest they are even lower than is commonly believed. This underscores the considerable potential for growth in wine exports to greater China and Japan, and has implications for wine sales in Hong Kong and Macau versus imports to those territories for re-export to mainland China.
The next section of the article summarizes the commonly used statistics for the wine markets of these countries. Section III reports possible amendments to those statistics, showing how they would change under certain assumptions, and what those changes imply for various summary indicators of wine market trends over the past two decades in this important region. The final section draws out implications of the findings, especially for exporters of wine to northeast Asia.
II. Common Sources of Wine Data for Northeast Asia
International analysts lacking northeast Asian language skills typically rely on wine production data for the region from the United Nations' Food and Agriculture Organization (FAO) (www.fao.org/faostat/en) and, for estimates of the latest updates, the Paris-based International Organisation of Vine and Wine (OIV) (www.oiv.int). Trade data also are available from the FAO and, more comprehensively and with all bilateral flows, from the United Nations's Statistical Office (https://comtrade.un.org/data), again with estimated updates from the OIV. All those sets of annual data are reliant on national government statistics being submitted to these international agencies. Commercial data providers such as the Global Trade Atlas (www.ihsmarkit.com/maritime-global-trade-atlas.html) assemble the most-recent trade data on an ongoing monthly basis, but access is not free. An Italian group produces updates of wine import volume and value data every six months and allows free downloads at www.winebynumbers.it
Wine consumption data are far more difficult to come by internationally. The Organisation for Economic Co-operation and Development (OECD) provides total alcohol consumption data for its member countries (hence Japan and the Republic of Korea) from the early 1960s and for major emerging economies (including China, India, and Indonesia) from 2000 (www.oecd.org/health/health-statistics.htm). The World Health Organization (WHO) provides those same data for all United Nation member countries disaggregated into wine, beer, spirits, and other beverages (see http://apps.who.int/gho/data/node.main.A1026?lang=en?showonly=GISAH). Again, both international agencies rely on national government statistics being submitted to them. Commercial providers with more up-to-date data for subscribers, or for a fee, include Euromonitor International (www.euromonitor.com) and International Wine and Spirit Research (https://www.theiwsr.com).
A way to check on consumption volume data, to fill gaps in historical series, or to avoid paying a fee to commercial data providers, is to add domestic production to imports net of exports. So long as there are no net changes in wine stocks over the period considered (e.g., a calendar year), this would be as reliable as the production and trade data. Indeed, it may be what some countries do to obtain their official consumption statistics. It is also what Anderson and Pinilla (Reference Anderson and Pinilla2017) did to fill gaps when unable to find official national consumption statistics, except they use not just current-year production but rather the average of that plus the two previous years’ production. That calculation not only smooths the time series but also captures the reality that not all wine is consumed in the year of production. Especially in the case of reds it is common to let the wine mature first in barrels and then in bottles; even after sale from the winery it may be stored for some time by wholesalers, retailers, restaurants, and even households before consumption. For the relatively new China market, however, we assume that wine is consumed in the year of domestic production or import.
III. Alternative Wine Market Statistics for Japan, China, and Hong Kong
We begin with Japan, the most mature of these northeast Asian markets, before turning to the most important and fastest growing wine market in Asia, namely mainland China.Footnote 3 Imports and exports of Hong Kong and Macau are also considered. Even though the latter are far smaller markets, they are related to China's via their re-exports, and they provide an indication of how other Asian countries’ wine consumption might grow as their per capita incomes approach the higher levels of those two customs territories.
A. Japan
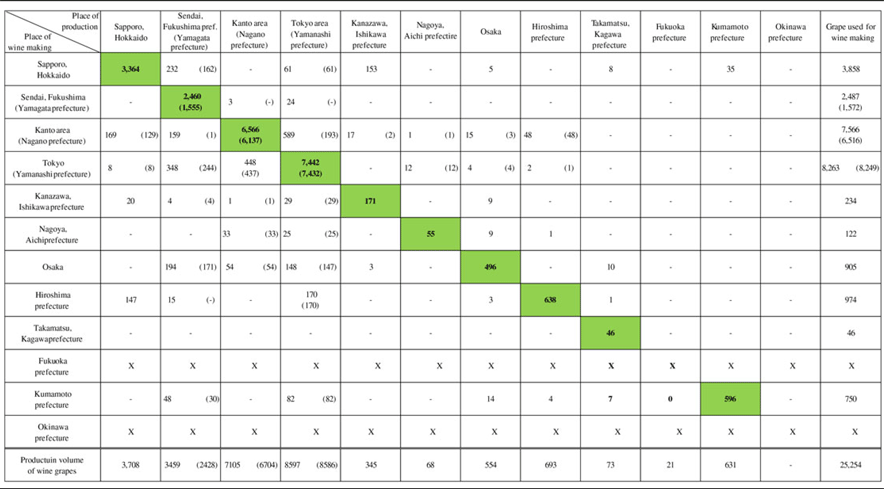
No less than 43 of Japan's 49 prefectures produce grape wine, mostly by small wineries that grow their own grapes and do not blend their product with material from other regions or abroad (Takahashi et al., Reference Takahashi, Harada, Saito and Kobayashi2017). While domestic wine produced in one region is seldom blended with wine produced in another region of Japan (see Appendix Table 1), wine is also “produced” in a few prefectures with large ports (Kawasaki et al., Reference Kawasaki, Nagatani, Yamakawa, Nakamura, Iba, Ueda, Ochiai and Oda2011). Firms in the latter prefectures bottle imported bulk wine and/or wine they make by adding sugar and yeast to imported unfermented grape juice concentrate (Shimamura, Reference Shimamura2008). The front label of these bottles of wine declare they are produced in Japan, and although the back label notes that they may contain imported material, that note may be in a smaller size font.Footnote 4
Official wine production data for Japan were not always reported to the United Nations' FAO, so for some years FAO has inserted unofficial data (1969–1973) or its own estimates (1974–1976 and from 2010). However, data from the National Tax Agency (2016) provide estimates of official grape wine production (including that using imported material) from 1973 and official grape wine consumption from 1988. Leading up to the planned implementation of Japan's new wine labelling law effective October 2018, official data also have been published for 2013 to 2015 that separate wine produced solely from domestic grapes and that produced using imported product (see National Tax Office, 2017 and earlier editions). Also available from official sources are wine import data by container, from which it is possible to get the share of total imports that come in bulk form (more than two litre containers) from 1988 (Ministry of Finance, 2017).
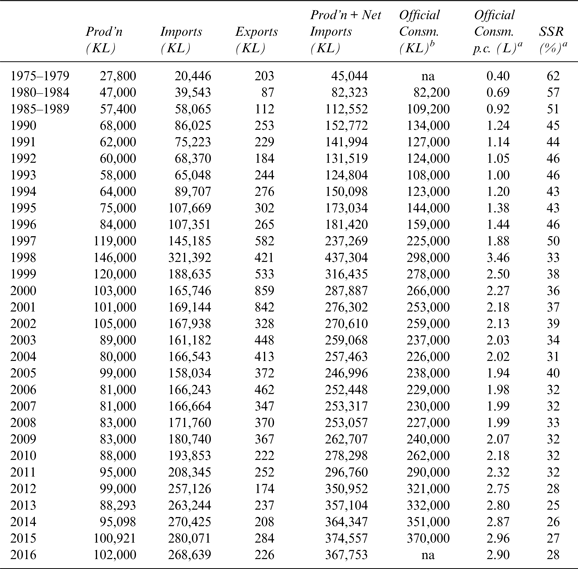
The annual volumes of Japanese wine production, consumption, and trade according to these official data are reported in Table 1(a). If we define “apparent consumption” as the sum of net imports plus the three-year average of production in that year and the two preceding years, then Table 1(a) shows it to be quite close to the National Tax Agency's estimate of Japan's consumption. The “apparent consumption” data suggest Japan's annual per capita consumption of wine has grown from below 0.3 litres as of 1975 (0.4 in 1975–1979) to almost three litres by 2016. They also suggest Japan's wine self-sufficiency has fallen from 75% in 1975 (62% in 1975–1979) to 28% by 2016.
Japan's Official Wine Production, Official Consumption, Imports, Exports and Apparent Consumption, 1975 to 2016 (Kilolitres, Litres, and %)

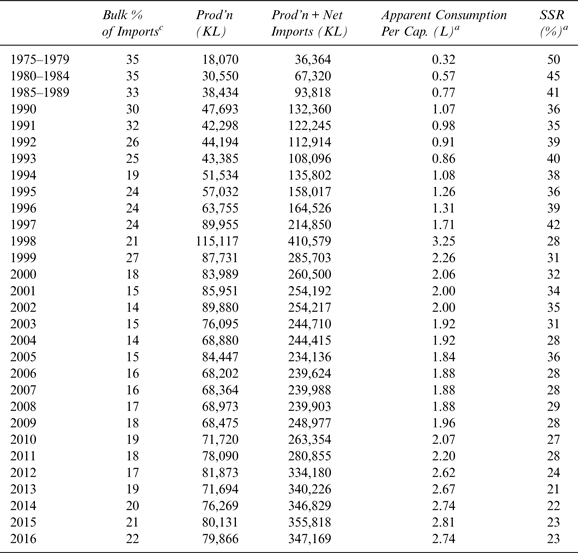
Since the data in Table 1(a) overstate consumption and self-sufficiency to the extent imported material are included in the domestic production estimate, two adjustments need to be made. One is to make the very reasonable assumption that all wine imported in bulk containers is blended with domestic wine and/or sold in bottles front-labelled “Product of Japan” and recorded as such by the statistician. That adjustment brings per capita consumption down to 2.7 rather than 2.9 litres and self-sufficiency down to 23% rather than 28% for 2016 (Table 1(b)).Footnote 5
Japan's Wine Production, Apparent Consumption and Self-Sufficiency, Assuming All Imported Bulk Wine Is Bottled in and Sold as a Product of Japan, 1975 to 2016 (Kilolitres, Litres, and %)

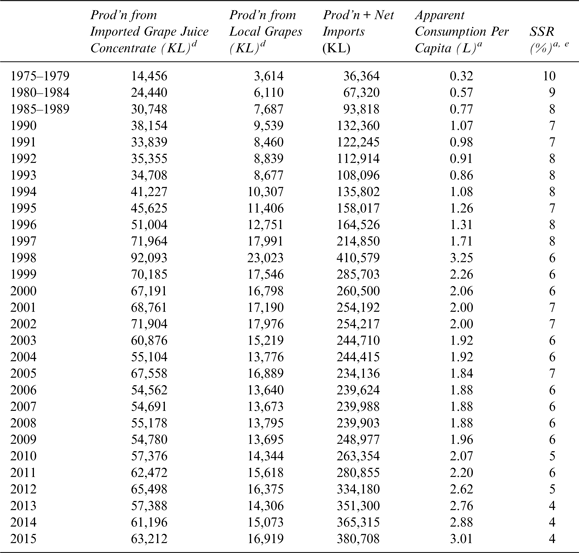
Furthermore, it is necessary to separate domestic wine production made from imported grape juice concentrate from that derived by fermenting fresh local grapes. Precise estimates of wine production from local grapes are available for 2013, 2014, and 2015 (14.3, 15.1, and 16.9 ML, respectively—see National Tax Agency (2017) and earlier editions). Those volumes average just one-fifth of the volumes in Table 1(b) for those years. They do not alter the apparent consumption per capita estimate in Table 1(b), but they do bring down the 2013–2015 self-sufficiency estimate from 22% to just 4% if it is assumed that the four-fifths difference is all due to wine made from imported concentrate. Had that same ratio of four-fifths been relevant for adjusting the production numbers in Table 1(b) for all years prior to 2013, then, as shown in Table 1(c), self-sufficiency is just 10% in 1975–1979.Footnote 6 Low though these revised self-sufficiency estimates appear, they are consistent with a claim made two decades ago by JETRO (1998), that less than 10% of wine bottled in Japan is made from domestically produced grapes.
Japan's Wine Production, Apparent Consumption and Self-Sufficiency, Assuming All Imported Bulk Wine and Some Concentrate Is Made into Wine,d 1975 to 2015 (Kilolitres, Litres, and %)

a The final two columns assume consumption equals net imports plus the average of production in that and the previous two years.
b The official consumption estimates are from the National Tax Agency (2016).
c The share of bulk in total wine imports in 1975–1987 is assumed to be 35%, the same as in 1988.
d Production from local grapes, once grape juice concentrate is taken into account, is assumed to be one-fifth of production shown in Table 1(b), the same as the average share in 2013–2015, the only years for which actual data are available from the National Tax Agency (2016).
e In Table 1(c) self-sufficiency is production from local grapes as a percent of apparent consumption (with the latter including wine made from imported grape juice concentrate).
Source: See text.
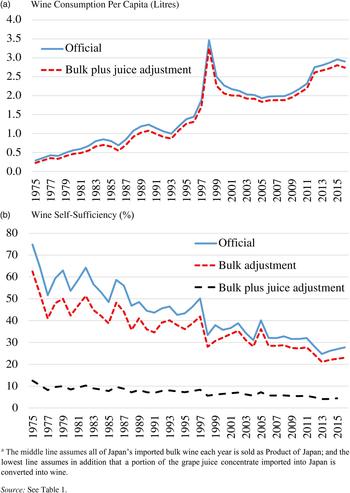
The extent of the impact of all these adjustments on estimates of Japan's wine consumption per capita and on its self-sufficiency in wine are shown graphically in Figure 1.
Japan's Estimated Wine Consumption Per Capita and Wine Self-Sufficiency under Alternative Assumptions,a 1975 to 2016 (Litres and %)

B. China (Mainland)
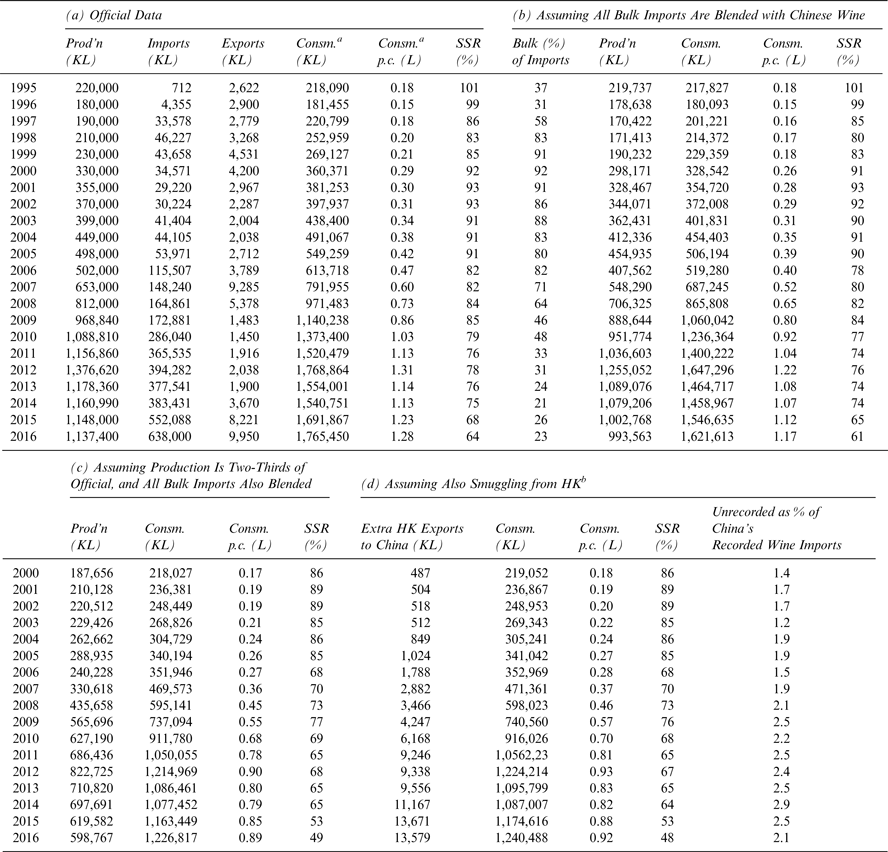
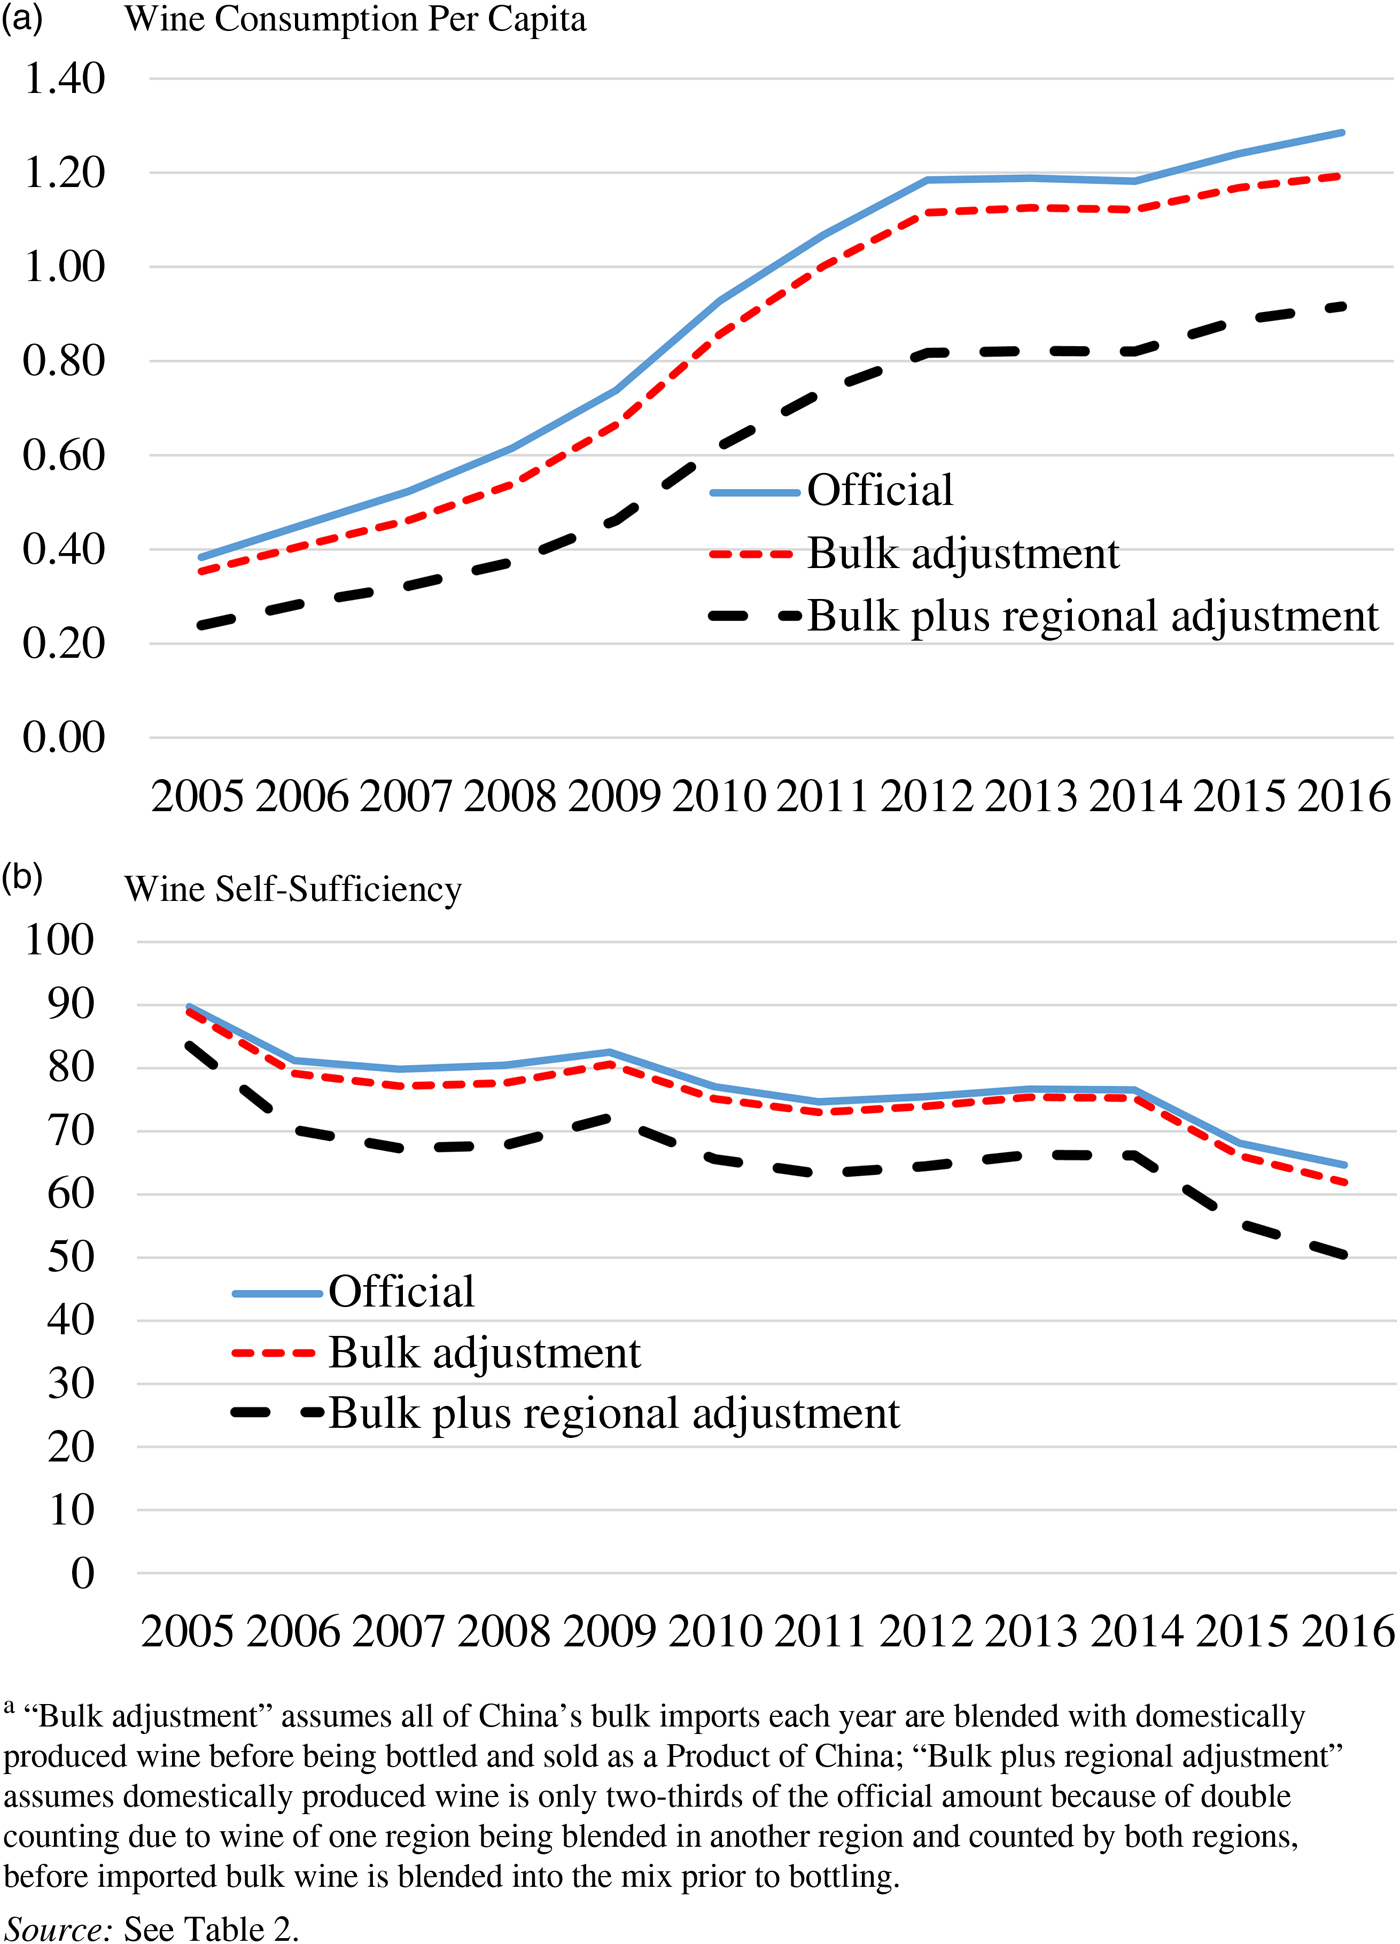
The annual volumes of wine production, consumption, and trade according to official data reported in Table 2(a), suggest China's per capita consumption has grown from the turn of the century from below 0.2 litres to 1.28 litres by 2016. They also suggest China's wine self-sufficiency has fallen from 100% in 1995–1996 to 64% by 2016.
China's Wine Production (Official, and under Alternative Assumptions), Trade and Apparent Consumption, 1995 to 2016 (Kilolitres, Litres, and %)

a Consm. is apparent consumption in KL, calculated as production plus imports minus exports; Consm. p.c. (litres per capita) is apparent consumption divided by total population; and SSR, the self-sufficiency ratio, is shown as production divided by apparent consumption (expressed as a percentage).
b The volume smuggled into China is assumed to be equal to an extra 50% of Hong Kong's total official re-exports.
Sources: Authors’ calculations, starting with official production and trade numbers reported by the FAO, WHO, and OIV.
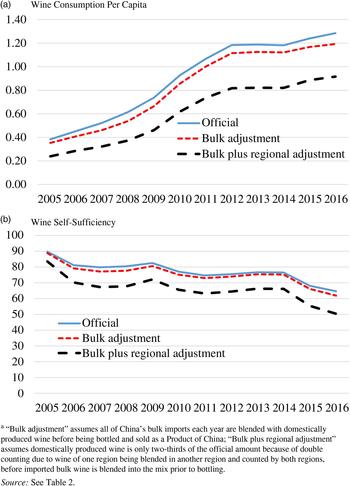
Much of the wine that is imported by China in bulk containers is bottled as is or blended with domestic wine and sold in bottles labelled “Product of China.” If all such imported bulk wine was recorded as Chinese production by the statistician, then per capita consumption would have reached just 1.17 rather than 1.28 litres by 2016, and self-sufficiency would be 61% rather than 64% (Table 2, panel (b)). These alternative numbers for this adjustment are lower-bound estimates because they have removed all of the imported bulk wine from the official “production” data, whereas in practice some of that wine may have carried a correct country of origin label and not been counted as domestic production.
Furthermore, if there is double counting of domestic wine production because it is internally traded between provinces in bulk before being bottled but counted as output in the source province as well as the desination province, per capita consumption and self-sufficiency would be even lower than official data suggest. For example, if domestic production is only two-thirds of that recorded as official production, in addition to imported bulk wine being counted as a product of China, then per capita consumption in 2016 would have reached only 0.89 litres rather then 1.28 litres and self-sufficiency would be 49% rather than 64% (Table 2, panel (c)). This is close to the suggestion made by one of China's leading wine reporters, having discussed the issue and its possible contributing factors with leading industry insiders (Boyce, Reference Boyce2017, Reference Boyce2018).
Finally, in addition to some recorded imports to Hong Kong and Macau being subsequently recorded as re-exported to China, it is believed that a portion also is transported to the mainland without being recorded, that is, it is smuggled so as to avoid one or more of China's three taxes on wine consumption. If the extent of such smuggling amounted to half as much again as Hong Kong has been re-exporting officially,Footnote 7 that would mean 2% higher consumption in China but the self-suffiency rate would be an extra percentage point lower (compare Table 2, panel (c) and Table 2, panel (d)).
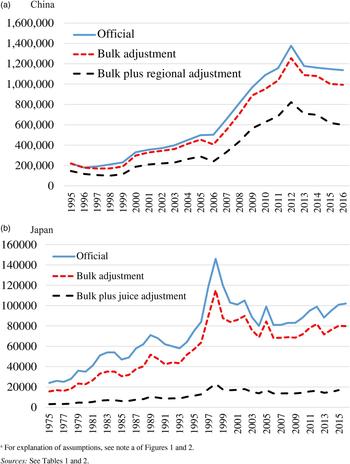
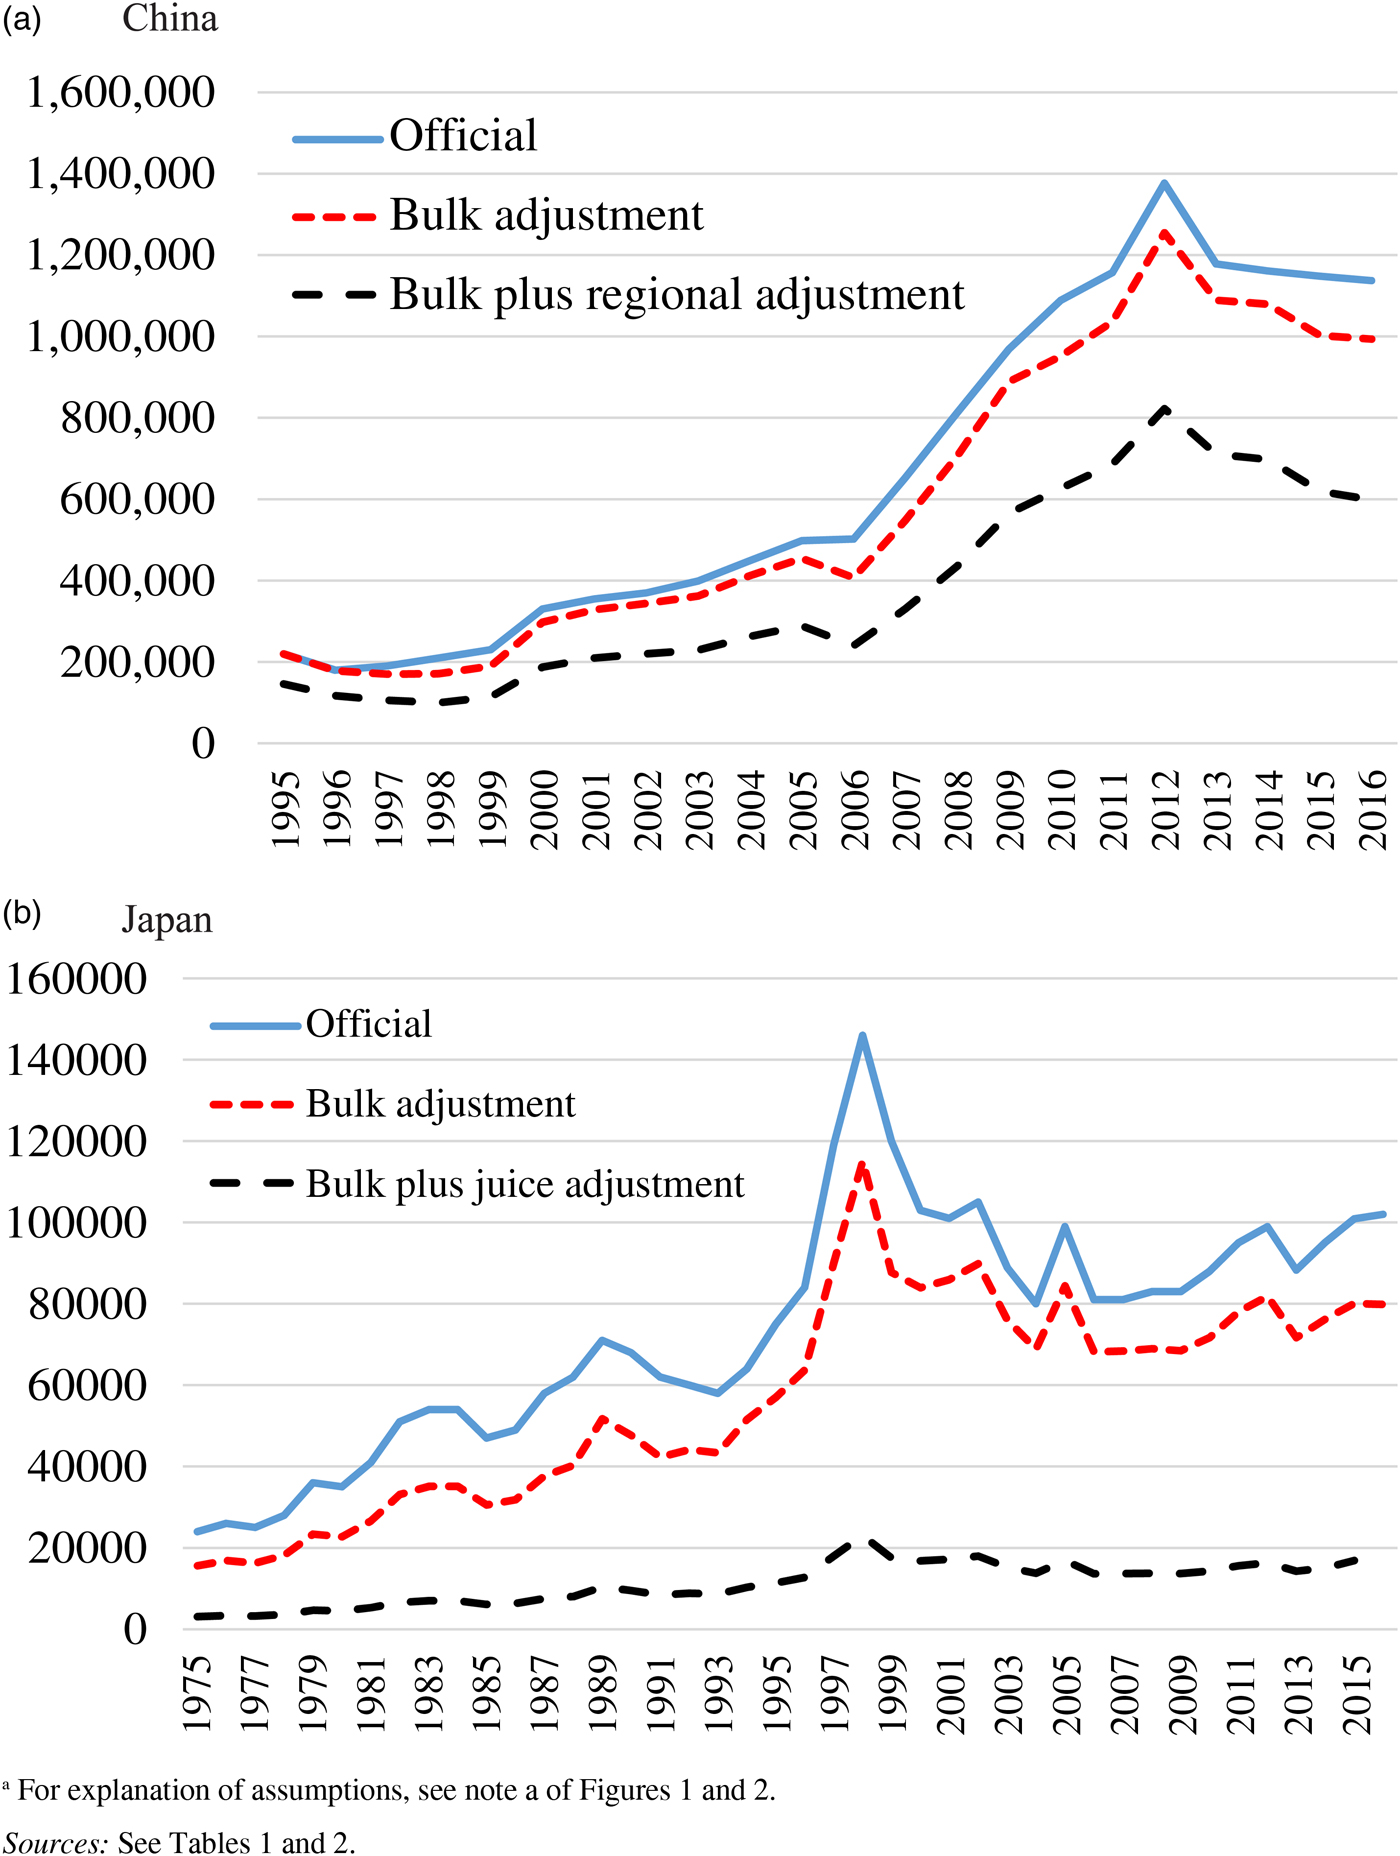
The extent of the impact of these adjustments on estimates of China's wine consumption per capita and on its self-sufficiency in wine are shown in Figure 2 (where the adjustment including some smuggling is not shown as it is very close to the heavy black lines). The extent of their impact on estimated production in China of wine, if narrowly defined to be made from local grapes, are shown in Figure 3 (along with similarly adjusted production estimates for Japan).
China's Estimated Wine Consumption Per Capita and Wine Self-Sufficiency under Alternative Assumptions,a 2005 to 2016 (Litres and %)
Estimated Wine Production in China and Japan's under Alternative Assumptions,a 1975 to 2016 (Kilolitres)
C. Hong Kong and Macau
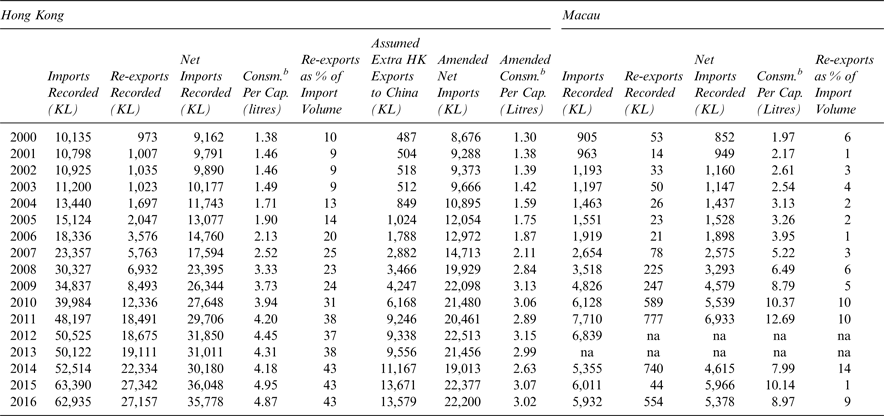
If Hong Kong's wine exports to China are in fact more than what are documented in official records, it makes a much bigger difference to Hong Kong's apparent wine consumption per capita than to China's. To use the previous example, if the extent of such smuggling amounted to half as much again as Hong Kong has been officially re-exporting, then Hong Kong's apparent consumption is only 3.0 litres instead of 4.9 litres per capita in 2015–2016 (see Table 3). That is much closer to the average annual 2.4 litres consumption level in Singapore in recent years.
Wine Imports, Re-exports and Consumption, Hong Kong (under Alternative Assumptionsa) and Macau, 2000 to 2016 (Kilolitres and Litres)

a Unrecorded re-exports to the mainland are assumed to be 50% of Hong Kong's total recorded re-exports.
b Apparent consumption per capita, assumed to be net imports divided by population.
Source: Authors’ calculations, starting with official trade numbers reported in Anderson and Pinilla (Reference Anderson and Pinilla2017).
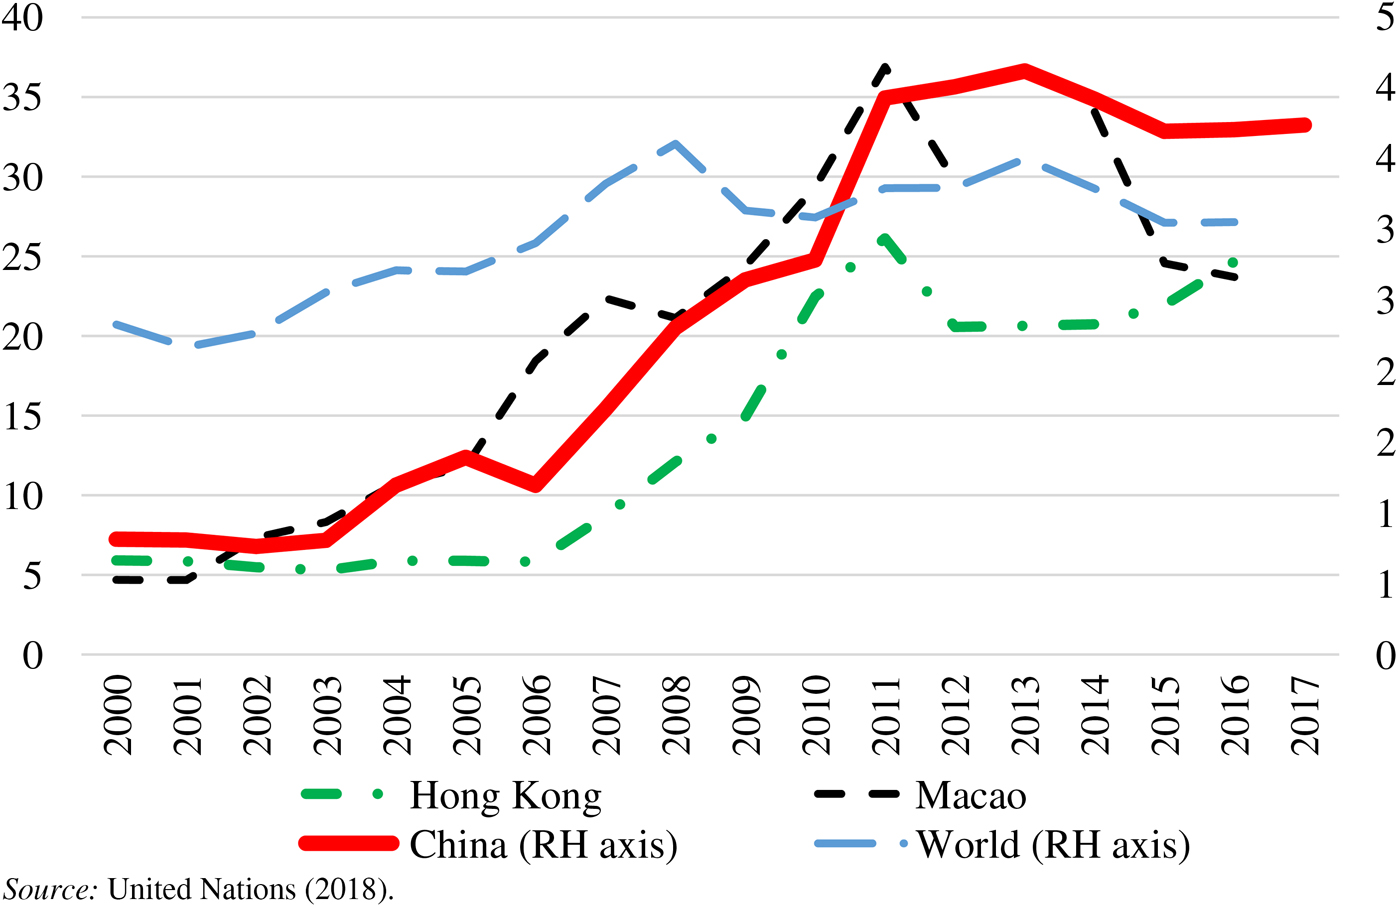
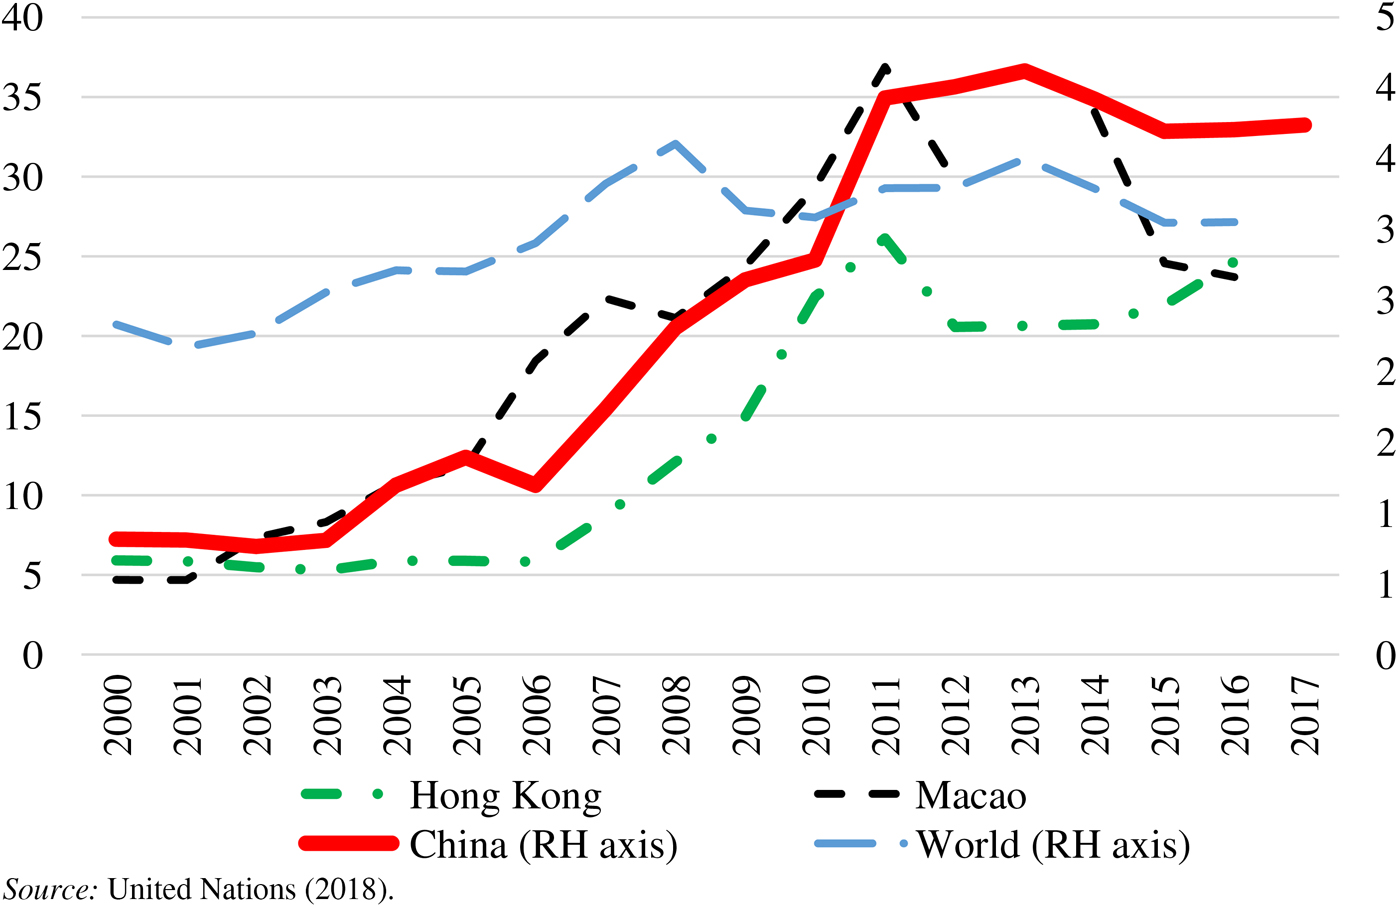
Macau has less than one-tenth of the population and hence a much smaller economy than Hong Kong, but it has had a similarly higher and rapidly rising per capita income and demand for wine imports, and a similar proximity to mainland China. It abolished its 15% wine import tax in August 2008, six months after Hong Kong. Its apparent per capita consumption of wine, when defined as recorded net imports, have been about twice that of Hong Kong's over the past two decades. However, its recorded re-exports have been a far smaller proportion of its reported imports than is the case for Hong Kong (Table 3). If there is no smuggling out of Macau, then it has by far the highest per capita wine consumption in Asia at more than twice that of Hong Kong's, three times that of Japan's, and four times that of Singapore's. That seems unlikely, however, notwithstanding the possibly considerable consumption by high-income gambling tourists in Macau (most of whom come from the mainland). A more likely explanation for these comparative data is that a large share of Macau's wine imports have been smuggled to mainland China. That would be consistent with the rapid growth in China's demand for fine wine imports during 2005–2012 and its subsequent slowdown following the austerity and anti-corruption measures Beijing introduced in December 2012 (Table 2, panel (a) and Table 4), as well as with the rapid rise in the average price of wine imports into greater China during 2005–2012 and their plateauing thereafter—in contrast to the rest of the world where average import prices fell from 2008 because of the global financial crisis (Figure 4).
Average Price of Wine Imports, China, Hong Kong, Macau and the World, 2000 to 2017 (Current US$ Per Litre)
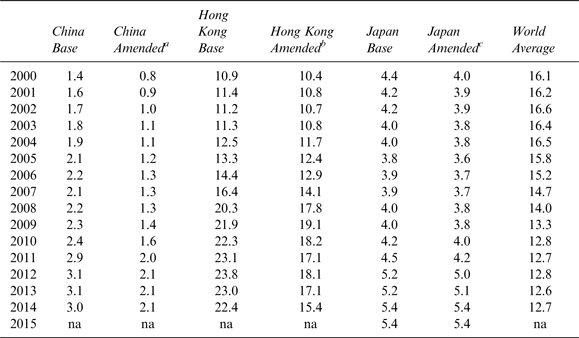
Grape Wine's Share of Total Alcohol Consumption, China, Hong Kong, Japan, and the World 2000 to 2015 (%)

a Assuming that China's wine production is two-thirds of the official estimate, all bulk imports into China are blended with local wine, and the volume of wine smuggled into China is equal to an extra 50% of Hong Kong's total official wine re-exports.
b Assuming the volume of wine smuggled from Hong Kong to China is equal to an extra 50% of Hong Kong's total official wine re-exports.
c Assuming all imported bulk wine is bottled in and sold as a product of Japan.
Sources: Base estimates are from Anderson and Pinilla (Reference Anderson and Pinilla2017); other estimates are based on the assumptions in Tables 1, 2, and 3.
IV. Implications of Revised Statistics for Wine Exporters
These alternative estimates of wine market statistics for northeast Asia alter non-trivially the estimates of the share of wine in the region's alcohol consumption. Those shares are already presumed to be very low by world standards, but the earlier noted adjustments mean they may be even lower than previous estimates suggest. Nonetheless, since the turn of the century, even these alternative estimated shares have doubled for China, and gone up by about 50% for Hong Kong and Japan, at a time when wine's share of alcohol consumption in the rest of the world has shrunk by about one-quarter (Table 4). Little wonder that the world's wine exporters are paying close attention to sales in this region, which is one of the fastest growing globally (Anderson and Wittwer, Reference Anderson and Wittwer2015).
The more-than-doubling of apparent per capita consumption in Hong Kong and Macau based on official trade statistics, following the abolition of their wine import tariffs in 2008, imply very high price elasticities of demand for wine—especially in Macau where the tariff had been just 15% before being abolished. This lends support to the claims by insiders of non-trivial informal or smuggled trade in wine to the mainland.
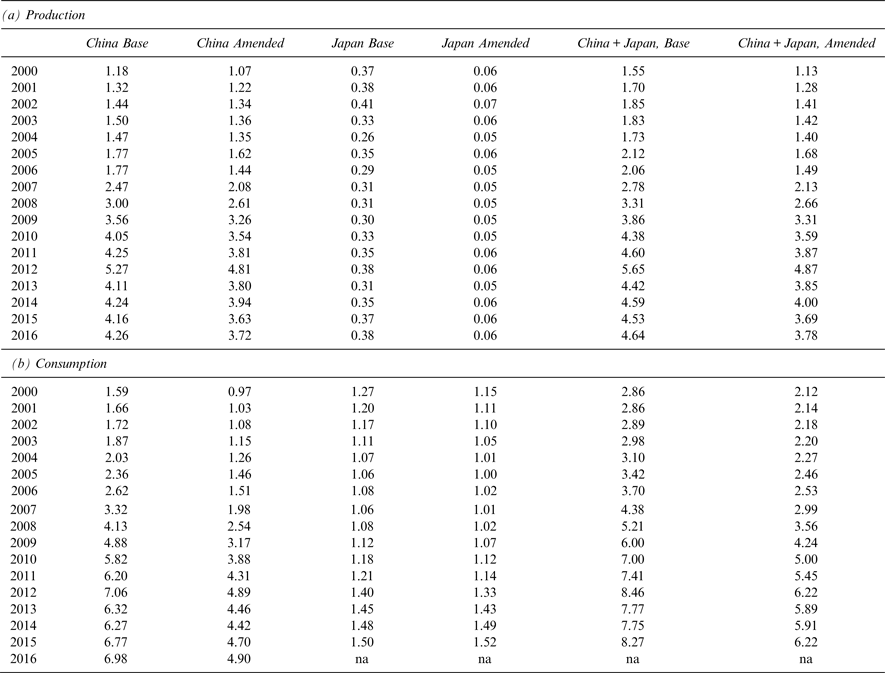
These alternative estimates mean foreign suppliers may face considerably less competition in the Chinese and Japanese markets from local producers than official data imply. They also suggest the potential for increased per capita consumption in the region is even greater than previously thought, including in Hong Kong. True, these alternative estimates also suggest the rise in the share of the region in global wine consumption since the turn of the century has been overstated. That increase, from 2.9 to 8.4%, becomes one from 2.2 to 6.3% using these alternative estimates (Table 5). Even so, that amended increase in the combined share for these three economies is still huge compared with the proportional increase in their share of global income, which rose from 18 to 22% between 2000 and 2016 (World Bank, Reference Bank2017). The scope for further growth in northeast Asia's wine consumption and imports would still seem very considerable though, when its 6–8% share of global wine consumption is compared with its 22% share of global income.
Shares of China and Japan in Global Wine Production and Consumption, Official and Alternative Estimates, 2000 to 2016 (%)

Sources: Estimates are based on the assumptions in Tables 1(c) and Table 2, panel (b) plus the global estimated production and consumption in Anderson and Pinilla (Reference Anderson and Pinilla2017).
Winegrape Production in Japan, by Growing Region and Crushing Region, March 2016 (Tonnes)a