Introduction
The polymer electrolyte membrane fuel cell (PEMFC) converts chemical energy from the redox reaction of H2 and O2 to electrical energy using a platinum catalyst supported on carbon black paper as an anode and cathode to drive the redox reaction; a polymer electrolyte membrane (PEM) (in this case, a Nafion membrane), which serves as a medium for the proton exchange between the anode and cathode; and a wire through which the electrons can travel. The platinum catalyst on the anode oxidizes hydrogen gas (H2) into electrons and protons. The protons can pass through the PEM but the electrons cannot and so they flow into the wire, producing electrical energy. At the cathode, oxygen gas (O2) joins with the protons and electrons from the anode to create H2O as the only product.
PEMFCs have several limitations:
-
(1) The high cost of the platinum catalyst to oxidize H2.
-
(2) The low output power of only 1 V produced by a single PEMFC.[ 1 ] To solve this problem, fuel cells are stacked on top of each other, resulting in an expensive and bulky power source.
-
(3) The PEMFC's susceptibility to carbon monoxide (CO) poisoning of the platinum catalyst through the reverse water shift gas reaction: CO2 + H2⇌H2O + CO
CO2, readily available from the environment, can constantly react with H2 to form CO gas.[ Reference Baschuk and Li 2 ] CO gets absorbed by the anode, poisoning and blocking the platinum catalysts from oxidizing H2, thus reducing power output.
Current methods of preventing CO poisoning have flaws in their practicality. Mixing trace amounts of O2 gas with H2 gas to stimulate CO oxidation on the catalyst has been investigated, but this proved ineffective and tedious due to the need of constantly monitoring the air content.[ Reference Zamel and Li 3 ] The same results were true when hydrogen peroxide was added to the H2 gas.[ Reference Barz and Schmidt 4 ] Operating the fuel cell at >100 °C to oxidize the CO causes the Nafion membrane to degrade, making this method unfeasible as well.[ Reference Jalani 5 ]
Metal catalyst nanoparticles such as gold (Au), platinum (Pt), and palladium (Pd) have produced promising results but their noble metal precursor salts are costly.[ 6 – 8 ] Aggregation of metal nanoparticles is also a major drawback,[ Reference Jassby 9 ] decreasing the surface area to volume ratio and causing metal particles to lose their unique properties that are only present on the nanoscale.
Thus, the goal was to develop an inexpensive, durable catalyst that would resist aggregation, thereby maintaining its catalytic ability. In addition, the ideal catalyst would not only resist CO poisoning but even increase power output of the PEMFC, reducing the amount of fuel cell stacks needed to produce sufficient power.
Iron (Fe) could be a possible alternative catalyst. Fe, like other transition metals, can serve as a catalyst because it has multiple oxidation states and can lend or withdraw electrons from a reactant, forming complexes with it.[ 10 ] Fe is quite economical; costing about $0.50/lb versus the cost of Pt, $22,000/lb.[ Reference Tondreau., Atienza, Weller, Nye, Lewis, Delis and Chirik 11 ] Fe is already used as a catalyst, for example, in reactions such as the splitting of N2 in the Haber process to form ammonia.[ 12 ] However, its challenges still exist, which are to create uniform nanoparticles and prevent aggregation.
Graphene shows potential for PEMFC use due to its extraordinary properties, especially its remarkable electron mobility. The absence of an effective mass of the electrons, caused by the linear relation between energy and movement at the Dirac points in the Brillouin zone of the graphene, causes the photon-like behavior of the electrons and ballistic transport.[ 13 ] These two characteristics of the electrons in graphene allow the electrons to theoretically reach an electron mobility of 200,000 cm2/V•s. Thus, graphene may support electron mobility from the oxidation of hydrogen in the PEMFC. In addition, graphene's theoretically high surface-to-mass ratio of ~2600 m2/g, made possible by its two-dimensional character, is also a desired property as it allows for more nanoparticles to attach to the graphene surface, preventing aggregation and providing more catalytic surface area for H2/O2 reactions.[ Reference Bonaccorso, Colombo, Yu, Stoller, Tozzini, Ferrari, Ruoff and Pellegrini 14 ]
This research incorporated Fe into partially reduced graphene oxide (prGO) by first mixing the Fe salt with graphene oxide (GO) and then reducing the mixture with sodium borohydride (NaBH4). The prGO sheets would prevent nanoparticle aggregation, yet their high surface area would still expose the particles to the reaction system. Graphene's high conductivity and low resistivity may aid H2 oxidation. To test which of iron's oxidation states would attach best to the sheets and work optimally as a catalyst, Fe-prGO was synthesized from three different precursors: Fe+2 from FeSO4; Fe+3 from Fe2(SO4)3; and Fe0 from Fe(CO)5. Fe catalysts, even in combination with trace amounts of Au or Pt, could still greatly reduce the amount of noble metals needed to increase the power output of the PEMFC and may help resist CO poisoning, replacing some of the susceptible Pt. Furthermore, only partially reducing GO will maintain its water solubility, serving as a substrate for Fe nanoparticles, decreasing their aggregation yet still exposing their catalytic surfaces on the prGO sheets.
Experimental details
GO paste was chemically synthesized using a modified Hummer's method.[ Reference Shahriary and Athawale 15 ] A GO solution was created by dissolving 200 mg of GO in 150 ml of distilled water, sonicating for 15 min, and then centrifuging at 3000 rpm for 20 min. The supernatant was then mixed with 50 ml of ethanol (to enhance its compatibility with the hydrophobic 30% PTFE-treated carbon electrodes) and used for experimentation.
To functionalize GO with metal nanoparticles, the metal salt was added to 15 ml GO aliquots for a salt concentration of 0.05 mM, stirred overnight, then reduced with NaBH4 the following day. Three different Fe precursors were tested: (1) ferrous sulfate (FeSO4, Fisher Scientific), (2) ferric sulfate (Fe2(SO4)3, Flinn), and (3) iron pentacarbonyl (Fe(CO)5, Sigma-Aldrich). The solutions created using Fe were named using their ideal oxidation states. Potassium tetrachloroplatinate (K2PtCl4, Sigma-Aldrich) and potassium tetrachloroaurate (KAuCl4, Sigma-Aldrich) were used, respectively, to functionalize GO with Pt and Au nanoparticles. One solution of GO was functionalized with a combined mixture of Fe(III), Au, and Pt salts. In solutions containing two metals, each metal was added at a concentration of 0.025 mM for a total final concentration of 0.05 mM. For solutions containing three salts, each metal was at a concentration of 0.015 mM, achieving a total concentration of 0.045 mM metals. 20 drops of Fe(CO)5 were added from a micro syringe to one 15 ml GO solution, which were then reduced together; and another test solution was made by adding 20 drops of Fe(CO)5 to 15 ml of an already partially reduced GO solution. Partial reduction of each GO solution was made by bringing the final concentration to 12 mM NaBH4, creating prGO that was still water-soluble but had less functional groups.
Scanning electron microscopy (SEM) and energy dispersive x-ray analysis (EDX) (LEO 1550, Zeiss, Germany) samples were prepared by drying solutions onto 1 cm × 1 cm silicon wafers with a miller index of 100. Transmission electron microscopy (TEM) (JEOL JAM 1400) samples were prepared by dropping solutions onto lacey copper grids (400 mesh carbon support film, Ted Pella Inc.). Raman spectra were collected for 10 s using 100% laser power and an 1800 lines/mm grating, which provided a spectral resolution of ~1 cm−1 using a Renishaw inVia microRaman spectrometer with a 514 nm inline argon laser. Spectra were analyzed using the Renishaw Wire 4.0 software and the quadratic baselines were subtracted for all data; the integrated signal under the curves was normalized to 1. Vibrating sample magnetometry (VSM) (Microsense model 880) samples were prepared by drying solutions and scraping them into flakes.
The PEMFC electrodes (FuelCellsEtc, CTM-GDE, PtC 20%) had an initial Pt loading of 0.1 mg/cm2 and a 30% PTFE treatment in the microporous layer, which gave the electrodes a highly hydrophobic character. To counteract this, the electrodes were exposed to UV-O3 for 10 min using a Bioforce Sciences Ultraviolet Radiation System to cleanse the electrode surface of organic contaminants and create a high-energy surface.[ 16 ] The electrodes were then soaked in the metallized prGO solutions for 5 min before being dried overnight in a 50 °C oven.
Each Nafion membrane (FuelCellsEtc., Nafion 117) was coated with its test solution using a KSV 5000 Langmuir-Blodgett (LB) trough dipper immediately before PEMFC testing to maximize hydration. The membrane was immersed in a beaker of distilled water and 2 ml of test solution were carefully pipetted onto the water's surface to evenly layer a surface film. The 25% ethanol solution's lower density allowed the solution to float on top of the distilled water. The LB dipper raised the membrane at a rate of 5 mm/min, thinly coating solution onto the membrane.
The modified electrodes and membranes were then tested on a hydrogen fuel cell. The control cell consisted of standard Pt electrodes with a loading of 0.1 mg/cm2 and an unmodified Nafion membrane that was soaked in distilled water. Sample electrodes/membranes were modified using Fe(CO)5-prGO, Fe(III)-prGO, Fe(III)AuPt-prGO and a setup using AuPt-prGO was made and tested to determine the effects of adding Fe as a catalyst. The maximum power output was determined by introducing purified H2 gas into the system at a flow rate of 80 ccm. To provide a uniform dispersion of the gas, 2.5 min were allowed to pass. The testing system calculated the ohms of electrical resistance to automatically raise the current of the fuel cell by 0.05 amps every 30 s, beginning at 0 amps and continuing for a total of 7.5 min. Each setup was tested at least three times to activate electrodes until peak performance was exhibited.
To test the CO resistance, the same process was then repeated using 0.1% (1000 ppm) of CO in the H2 gas feed. The control setup and the Fe(III)AuPt-prGO setup were each tested twice for CO resistance as this modified sample exhibited the highest power output.
Discussion
SEM/TEM
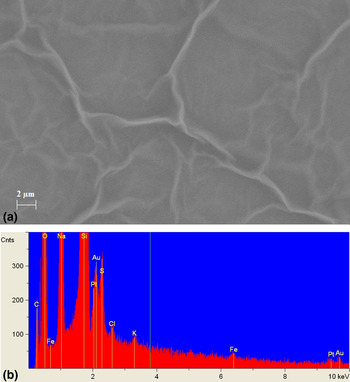
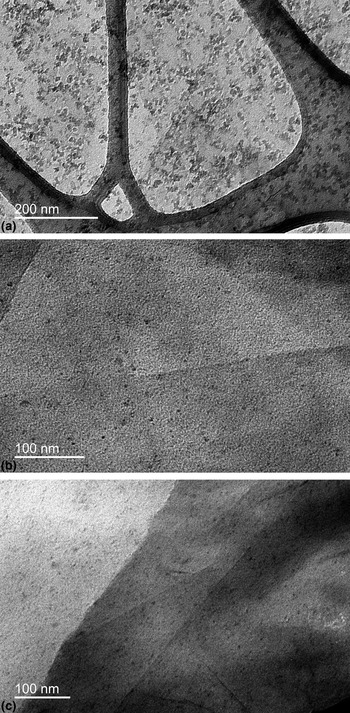
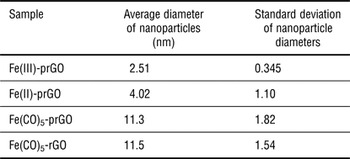
SEM and EDX confirmed the existence of graphene sheets and Au/Pt nanoparticles (Fig. 1). TEM successfully validated the existence of Fe nanoparticles in all Fe samples (Fig. 2). TEM imaging also determined the size of the Fe nanoparticles, which can be seen in Table I.
(a) SEM image of Fe(III)-prGO at 10 kx with its corresponding EDX showing graphene sheets but an absence of Fe nanoparticles. (b) EDX of Fe(III)AuPt-prGO showing notable amounts of Au and Pt with small amounts of Fe.

(a) TEM image of Fe(CO)5-RGO at 30 kx. (b) TEM image of Fe(III)-prGO at 50 kx. (c) TEM image of Fe(II) at 40 kx.

Average diameter and standard deviation of various samples analyzed by TEM.

Raman spectroscopy
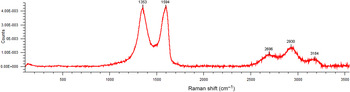
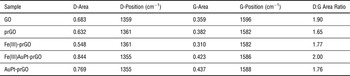
Raman spectroscopy can indicate the degree of disorder by comparing the ratio of the area under the D band to the area under the G band in the Raman spectra of graphene. As disorder increases, the D:G area ratio also increases due to elastic scattering. The Raman spectra displayed an increase in disorder when the metal nanoparticles were incorporated onto the graphene sheets. A Raman spectra of Fe(III)AuPt-prGO can be seen in Fig. 3, while the D and G areas/positions with the respective D:G ratios of each sample can be seen in Table II.
Raman spectra of Fe(III)AuPt-prGO.

Raman peak positions, areas, and ratios for each sample.

Note GO's higher D:G area ratio is due to its functional groups; prGO has a significantly lower D:G area ratio due to the removal of functional groups by reduction; the metalized prGO samples had a higher D:G area ratio than prGO due to the disorder possibly caused by the metal nanoparticles embedding into the graphene sheet.
Vibrating sample magnetometry
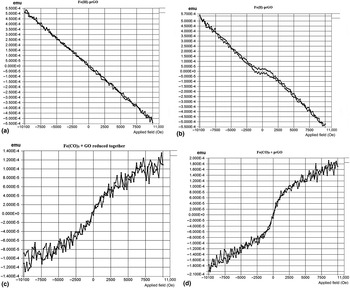
VSM analysis showed paramagnetic behavior in the Fe(CO)5-prGO in which the GO and Fe(CO)5 were reduced together and superparamagnetic behavior in the Fe(CO)5-prGO where the Fe(CO)5 was added to already partially reduced GO. Fe(II)-prGO showed anti-ferromagnetic behavior while Fe(III)-prGO showed diamagnetic behavior (Fig. 4).
(a) VSM graph of Fe(III)-prGO. (b) VSM graph of Fe(II)-prGO. (c) VSM graph of Fe(CO)5 that was reduced along with GO. (d) VSM graph of Fe(CO)5 that was added to prGO.

Hydrogen fuel cell testing
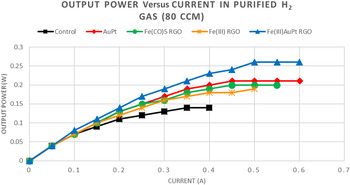
Each sample was tested for the maximum power output using purified H2 gas at a flow rate of 80 ccm; both the electrodes and Nafion membrane were coated with metal-prGO to utilize the maximum amount of applied catalyst exposure possible. Data points were recorded every 30 s. After each data point, ohms of electrical resistance were calculated and set to raise the current by 0.05 amps every 30 s. Fig. 5 depicts the maximum output power of each sample in the purified H2 gas feed. The unmodified control setup produced the lowest output power. The output power of the modified electrodes and membrane ranged from an increase of 36% using Fe(III)-prGO to an increase of 86% using the Fe(III)AuPt-prGO. It should be noted that Fe (III)-prGO alone is enough to significantly increase power output without the addition of Pt or Au nanoparticles. Also, the output power of Fe(III)AuPt-prGO is higher than that of AuPt-prGO, which contained an equivalent overall nanoparticle concentration and a relatively higher concentration of Pt nanoparticles, the standard catalyst. Thus, it seems there is a synergy between Fe, Au, and Pt nanoparticles acting together that best increases output power.
Output power versus current for fuel cell setups using a purified H2 gas feed at a flow rate of 80 ccm.

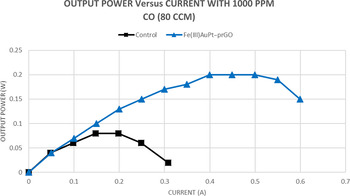
Since Fe(III)AuPt-prGO produced the greatest output power, it was also tested for CO resistance. When exposed to 1000 ppm of CO, the Fe(III)AuPt-prGO setup yielded a power output that was 150% higher than the control and was able to maintain ~77% of its maximum power output (Fig. 6). As can be seen by this graph, the Fe(III)AuPt-prGO also maintained its maximum output power twice as long as the control setup, showing further resistance to CO poisoning.
Output power versus current using a H2 feed contaminated with 1000 ppm of CO at a flow rate of 80 ccm.

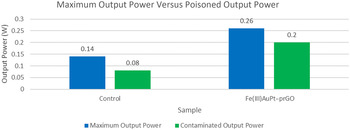
To determine the extent of the CO resistance, the ratio of CO contaminated output power (P C) to maximum output power in purified H2 (P M) was calculated. When using the formula P C/P M, the control setup exhibited a ratio of 0.57, meaning that it experienced a 43% decrease in power due to the CO. The ratio for the Fe(III)AuPt-prGO was 0.77, showing only a 23% loss of power. An ideal ratio of 1.00 would signify 100% resistance to CO poisoning (Fig. 7).
Maximum output power (P M) compared with contaminated output power (P C).

Conclusions
The synthesis and characterization of Fe-containing metalized prGO materials demonstrated a successful yet simple creation of iron-functionalized prGO from Fe+2, Fe+3, and Fe0 precursors. TEM analysis confirmed the formation of Fe nanoparticles ~2.5 nm in diameter from the Fe sulfates and ~11 nm in diameter using Fe(CO)5; the nanoparticles are uniformly distributed in the prGO sheets without aggregation. EDX identified the respective metals of the nanoparticles. Raman spectroscopy displayed increased disorder of Fe-prGO sheets, suggesting the particles are embedded within the sheets and disrupt the prGO order. VSM indicated superparamagnetic behavior and paramagnetic behavior in the Fe(CO)5 samples, anti-ferromagnetic behavior in the Fe(II)-prGO sample, and diamagnetic behavior in the Fe(III)-prGO sample. UV-O3 treatment on the carbon electrodes reduced their hydrophobicity, allowing for the absorption of metalized prGO on the surface of the electrode only after the water-based samples were also mixed with ethanol to a concentration of 25% by volume. All of the modified test setups significantly improved power output over the control when tested in a PEMFC using purified H2, with Fe(III)AuPt-prGO increasing power output by nearly 90%. The output power of Fe(III)AuPt-prGO was higher than AuPt-prGO of similar metal concentration, suggesting there is a synergy between Fe, Au, and Pt that optimizes the catalysis. Testing Fe(III)AuPt-prGO using a H2 gas feed contaminated with 1000 ppm CO yielded a power output that was 250% of the control. Previous research by Baschuk and Li has shown that even 25 ppm of CO decreases the efficiency of a PEM fuel cell by 50%.[ 7 ] The Fe(III)AuPt-prGO setup maintained 77% of its maximum power in a H2 feed containing 40 times the CO concentration tested by Baschuk and Li. The high CO tolerance and increased output power exhibited by the Fe(III)AuPt-prGO could potentially reduce the number of fuel cells needed to be stacked and decrease the amount of noble metals needed, thus decreasing costs.
Due to the current Pt catalyst's susceptibility to CO poisoning, which clogs its activation points, the H2 gas feed must be made as free from impurities as possible. It is costly to produce 100% H2 gas due to the need of a Pd or Pt alloy membrane to filter out impurities during the manufacturing process.[ 17 ] A cost-effective method of producing H2 for PEMFCs is solar thermochemical hydrogen production (STCH), a method of producing H2 gas by the hydrolysis, electrolysis, and dissociation of copper chloride.[ 18 ]
The benefits of STCH are that there are practically no greenhouse gas emissions; the process is cyclic and fuels itself; and 75–80% of the process is powered by the sun's energy. The problem with H2 produced using STCH is that after the process occurs, there is still the possibility that ambient CO2 can react with H2 to create CO through the reverse water shift gas reaction.[ 1 ] Fe(III)AuPt-prGO, demonstrating significant CO resistance at 1000 ppm of CO feed, could allow for the H2 gas produced by STCH to be used in PEM fuel cells while maintaining good power output. This cuts the cost of running PEMFCs and increases their practicality, which in turn, makes PEMFCs a commercially viable energy source for future widespread use.
Acknowledgment
The authors wish to thank the National Science Foundation's support of this research through the NSF-Inspire DMR1344267 grant.