INTRODUCTION
Mussels are important ecosystem engineering organisms in the marine benthic environment (Borthagaray & Carranza, Reference Borthagaray and Carranza2007) according to the concept introduced by Jones et al. (Reference Jones, Lawton and Shachak2004). They add physical structure through their shells and the resulting reefs increase habitat complexity (Gutierrez et al., Reference Gutierrez, Jones, Strayer and Iribarne2003), while they selectively filter large quantities of suspended material (Galimany et al., Reference Galimany, Ramon and Ibarrola2011) contributing to the transport of particles and solutes (Gutierrez et al., Reference Gutierrez, Jones, Strayer and Iribarne2003). Through both processes they can markedly influence the diversity and dynamics of coastal and estuarine systems with consequent implications for local patterns of biodiversity (Seed, Reference Seed1996; Gutierrez et al., Reference Gutierrez, Jones, Strayer and Iribarne2003). Several data suggest that mussel beds enhance local biodiversity (Thiel & Ullrich, Reference Thiel and Ullrich2002; Chintiroglou et al., Reference Chintiroglou, Damianidis, Antoniadou, Lantzouni and Vafidis2004; Borthagaray & Carranza, Reference Borthagaray and Carranza2007; Cinar et al., Reference Cinar, Katagan, Kocak, Ozturk, Ergen, Kocatas, Onen, Kirkim, Bakir, Kurt, Dagli, Acik, Dogan and Ozcan2008) triggering biofouling, i.e. the colonization of a living surface by sessile animals or plants (see Wahl, Reference Wahl1989).
Epibiotic assemblages, i.e. assemblages growing attached to a living surface (Wahl, Reference Wahl1989), have been found on mussels worldwide (Tsuchiya & Nishihira, Reference Tsuchiya and Nishihira1986; Thiel & Ulrich, Reference Thiel and Ullrich2002; Borthagaray & Carranza, Reference Borthagaray and Carranza2007), including farmed populations (Lesser et al., Reference Lesser, Shumway, Cucci and Smith1992; Campbell & Kelly, Reference Campbell and Kelly2002; de Sa et al., Reference de Sa, Nalesso and Paresque2007; Woods et al., Reference Woods, Floerl and Hayden2012). In the Mediterranean, assemblages associated with natural mussel populations have been surveyed in the western (Tsuchiya & Bellan-Santini, Reference Tsuchiya and Bellan-Santini1989) and eastern basin (Chintiroglou et al., Reference Chintiroglou, Damianidis, Antoniadou, Lantzouni and Vafidis2004; Cinar et al., Reference Cinar, Katagan, Kocak, Ozturk, Ergen, Kocatas, Onen, Kirkim, Bakir, Kurt, Dagli, Acik, Dogan and Ozcan2008); on the other hand, farmed mussel populations have been largely overlooked, with only two relevant studies accomplished (Perera et al., Reference Perera, Ballesteros and Turon1990; Mengoli, Reference Mengoli1998), despite the great expansion of mussel aquaculture industry during the last decades (Smaal, Reference Smaal2002). Moreover, temporal and spatial trends of epibionts have not been taken into consideration.
The study of epibionts fouling farmed mussels becomes of rising interest since they may have important implications for farming operational practices. Biofouling, in general, is of ecosystem-wide importance and may have beneficial or detrimental, direct or indirect effects on the basibionts, i.e. substrate organisms which host the epibionts (Wahl, Reference Wahl1989). Thus, the presence of sponges on farmed bivalves is considered positive, since they protect shellfish from predators and other harmful epibionts by secreting bioactive compounds or camouflaging (Armstrong et al., Reference Armstrong, McKenzie and Goldsworthy1999; Ross et al., Reference Ross, Thorpe and Brand2004; Farren & Donovan, Reference Farren and Donovan2007). On the contrary, ascidians are interpreted as typical damaging organisms (Arakawa, Reference Arakawa1990; Santacroce et al., Reference Santacroce, Conversano, Vlora, Colao and Centoducati2008); they often aggregate in large numbers and the accumulated biomass highly stresses farmed mussels, even dislodging them from the socks. Since fouling reduces product quality and market value (Campbell & Kelly, Reference Campbell and Kelly2002) it is a necessity to remove these organisms. However, this procedure, often demanding detachment by hand, severely adds to operational cost in bivalve aquaculture (Ross et al., Reference Ross, Thorpe and Brand2004); cleaning procedures are both labour intensive and stressful to the product and frequent handling may negatively affect growth and survival of bivalves (Taylor et al., Reference Taylor, Southgate and Rose1997).
Considering all the above, the main goal of the present work was to assess spatial patterns and temporal dynamics of sessile epibionts fouling farmed Mediterranean mussels to address the issue of whether the observed interactions can be assigned as positive or negative. This was accomplished by estimating diversity, cover and abundance of the biota (colonial and solitary) settled on farmed Mytilus galloprovincialis Lamarck, 1819 in the north Aegean, where extended farming installations of the species exist. The relationships of the above parameters with biometric variables of the mussel population were also examined to assess any possible impact on its growth.
MATERIALS AND METHODS
Study area
The study area is located in Thermaikos Gulf, a shallow-water embayment in the north-western Aegean Sea (eastern Mediterranean). Thermaikos Gulf is among the most disturbed marine areas in Greece, receiving discharges from large river systems along with sewage and industrial effluents from the city of Thessaloniki (Chintiroglou et al., Reference Chintiroglou, Antoniadou and Krestenitis2006). Fishing, aquaculture, navigation and recreational activities take place in the Gulf. Water circulation follows a cyclonic pattern, driven mainly by the prominent northward winds (Krestenitis et al., Reference Krestenitis, Kombiadou and Savvidis2007). The abiotic parameters follow a seasonal trend: the water column is homogeneous from autumn to spring, whereas a thermocline appears during the intermediate period; salinity decreases in spring, when the inflow of the adjacent rivers is maximized (Hyder et al., Reference Hyder, Simpson, Christopoulos and Krestenitis2002). These hydrological features result in large concentrations of organic matter and nutrients, especially in the more sheltered north-western part.
Along the north-western coast of the inner Thermaikos Gulf, a protected area under the Ramsar Convention (i.e. Chalastra), covering about 1.35 km2 with a maximum depth of 24 m, has been planned for mussel farming development according to local authorities' decisions; this area hosts 30% of Greek farmed mussels (Konstantinou et al., Reference Konstantinou, Krestenitis, Latinopoulos, Pagou, Galinou-Mitsoudi and Savvidis2012). The farming activity was initiated in the early 1980s, quickly intensified (the number of units doubled in the 1990s), and further expanded along the eastern and western coasts of the Gulf, where today several units exist (Konstantinou et al., Reference Konstantinou, Krestenitis, Latinopoulos, Pagou, Galinou-Mitsoudi and Savvidis2012). The annual production of these cultures reached 35,000 tons in 2000 favouring the dispersal of M. galloprovincialis over the entire Gulf (Antoniadou et al., Reference Antoniadou, Sarantidis and Chintiroglou2011a).
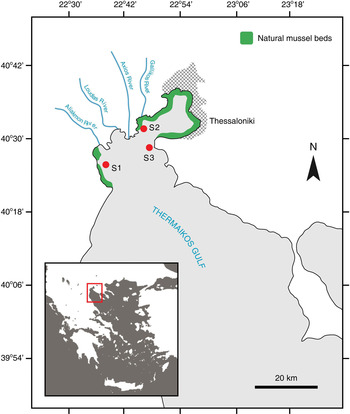
For the purposes of our study three long-line mussel cultures were selected as sampling stations to maximize geographical coverage (Figure 1); their depth reaches 10 m. Stations differ in principal environmental parameters, i.e. salinity, nutrient concentration, organic content, and terrigenous loads depending on their proximity to the river runoff system of Gallikos, Axios, Loudias, and Aliakmon (GALA). S1 is strongly affected by the GALA system; S2 is additionally severely influenced by sewage, agricultural, and industrial effluents from the city of Thessaloniki, whereas S3 is much less affected from the above sources. Mussel growth is largely influenced by environmental parameters (Camacho et al., Reference Camacho, Labarta and Beiras1995), being faster under increased nutrient concentrations as previous studies in the same area suggested (Kravva et al., Reference Kravva, Staikou and Triantaphyllidis2007).
Map of Thermaikos Gulf, showing the location of sampling stations.

Field sampling—treatment of samples
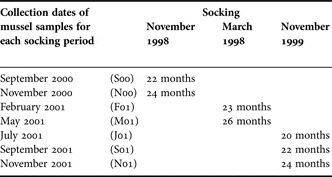
At each station thirty socks (each 3 m long and 15 cm in diameter) were immersed in November (1998 and 1999) and March (1999), i.e. at the main socking periods in the study area; they were kept immersed for about two years (23 ± 3 months) to ensure the similar age of mussels, so as the settled fouling community was at comparable succession stage. Sampling was carried out on seven periods from September 2000 to November 2001 (details on the sampling protocol are given in Table 1). At each station and sampling three socks were randomly selected and twenty mussels (mean shell length 65 mm) were collected from the upper (1 m depth) and the lower (4 m depth) part of the sock, covering approximately an area of 25 × 15 cm and fixed in 9% formalin. Concurrently, the main abiotic factors, i.e. temperature, salinity, dissolved oxygen, and pH were measured in the water column with a CTD (SeaBird SBE-19) and water clarity was estimated with a Secchi disc.
Field sampling protocol: deployment of socks and collection dates of mussel samples for each socking period at the three sampling stations.

In the laboratory, each mussel was examined under a magnifying lamp to count all sessile, solitary, epibionts, and to estimate percentage cover of colonial ones using an index ranging from 1 to 8 as follows: 1 = present (relative cover too small to be estimated); 2 = up to 10% of shell area; 3 = from 10 to 20%; 4 = from 20 to 30%; 5 = from 30 to 40%; 6 = from 40 to 60%; 7 = from 60 to 80%; and 8 = from 80 to 100%. Then, each mussel was measured for shell length (L) to the nearest mm with an electronic calliper, and for total wet weight (W) and tissue wet weight (Wt) to the nearest mg using an electronic scale. Weight measurements were used to estimate the condition index of mussels (CI) expressed as (Wt/W) × 100 (Hickman & Illingworth, Reference Hickman and Illingworth1980). The collected epibionts were subsequently identified to the species level. All specimens of each species were counted to estimate abundance, and weighted, using an electronic scale (0.01 mg precision) to estimate biomass as formalin wet weight.
Data analyses
The structure of sessile epibiotic assemblage settled on the mussels was analysed by calculating diversity as species richness (S), and the following parameters for each species: presence (P) estimated as the number of samples (20 mussels covering approximately 375 cm2), in which each epibiotic species was found; sock presence (Pb), the number of sock parts; temporal presence (Pt), the number of temporal samplings; and spatial presence (Ps), the number of sampling stations. For colonial species mean relative cover (C) was estimated. For solitary species mean abundance (N) and dominance (D) were estimated, as population density, i.e. the number of epibionts found per m2, and as the percentage species density, respectively; Shannon–Wiener (H′) diversity index and Pielou's evenness (J′) were also calculated.
Pearson's correlation coefficient was used to estimate relationships between the mussel biometric characteristics and epibiotic assemblage parameters (Sokal & Rohlf, Reference Sokal and Rohlf1987).
Analysis of variance (GLM ANOVA) was used to examine differences in abundance and diversity among sampling sites (three-level fixed factor), periods (seven-level fixed factor nested on sites), and depths (two-level fixed factor nested on periods). Prior to the analyses, data were tested for normality with the Anderson–Darling test, while the homogeneity of variances was tested using Cohran's test and, when necessary, data were log-transformed (Underwood, Reference Underwood1997). The Fisher LSD test was used for post hoc comparisons, when appropriate. ANOVAs were performed using the SPSS software package (IBM SPSS statistics version 19).
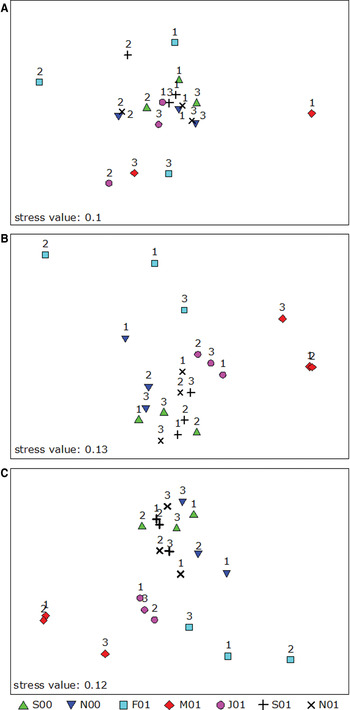
Multivariate analyses were used to compare the similarity of sessile epibiotic assemblages settled on the mussels; colonial and solitary species were treated first separately on the basis of relative cover and numerical abundance data, respectively, and then altogether using square-root transformed numerical data (Anderson & Underwood, Reference Anderson and Underwood1994). Non-metric multidimensional scaling ordination (nMDS) via Bray–Curtis distances on relative cover for colonial species and mean abundance data for solitary species was used to visualize temporal changes in composition of the epibiotic assemblage and across sampling sites. Analysis of similarity (ANOSIM) was carried out to test for spatial (sampling sites, three-level factor) and temporal (sampling periods, seven-level factor) differences in composition of epibiotic assemblage and similarity of percentage analysis (SIMPER) to identify the species responsible for the temporal and spatial patterns observed. The procedure of matching biotic to environmental patterns (BIOENV) was used to examine which environmental parameters were related to the observed ordination of the epibiotic assemblage composition and the degree of this relation. Multivariate analyses were performed with the PRIMER package (Clarke & Gorley, Reference Clarke and Gorley2006).
RESULTS
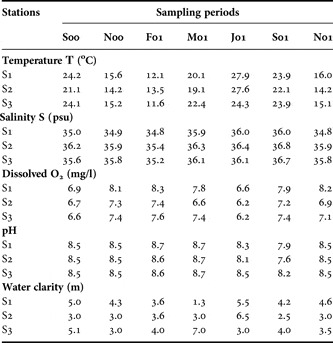
The recorded abiotic parameters showed a similar temporal pattern with slight differences between stations. Temperature ranged from 11.6 to 27.9oC, salinity 34.8–36.8 psu, dissolved oxygen 6.2–8.3 mg/l, pH 7.6–8.7, and water clarity 1.3–7 m (Table 2).
Mean value of the measured physical and chemical parameters of the water column at the three mussel farms (S1 to S3) at each sampling period (S00 to N01; for abbreviations see Table 1).

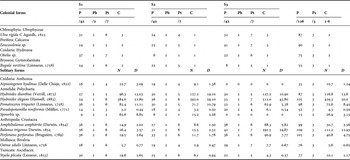
In total 15 species of sessile epibionts were found on the shells of the 2520 mussels examined (Table 3); polychaetes were the most speciose group followed by crustaceans; the latter were represented exclusively by barnacles.
Community parameters of epibionts fouling farmed Mytilus galloprovincialis populations. P, presence on samples (out of 42 for each station and out of 126 in total); Pb, sock presence (out of 2); Pt, temporal presence (out of 7); Ps, spatial presence (out of 3); C, relative cover; N, mean population density (number of individuals/m2); D, mean dominance.

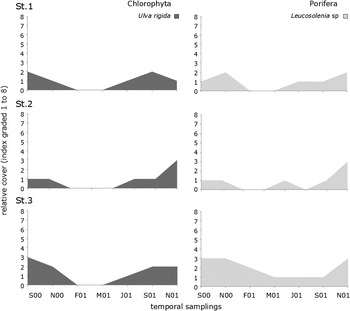
Colonial forms overgrew from 10% to about 20% of the mussel shell. The green alga Ulva rigida and the calcareous sponge Leucosolenia sp. showed the highest coverage followed by the hydrozoan Obelia sp. and the bryozoan Bugula neritina. Differences in presence and relative cover were detected in both spatial and temporal scales (Table 3). Thus, the total cover of U. rigida, Leucosolenia sp., and Obelia sp. was decreased at S2, the latter having very low frequency of appearance (less than 15% of samples); B. neritina showed increased cover at S1, whereas Leucosolenia sp. at S3. The location in sock parts did not affect relative cover of colonial epibionts with the exception of Leucosolenia sp., whose cover was limited near the bottom edge of the sock. All the above species showed a common temporal pattern with their cover decreasing during the cold period of the year, mostly from February to June (see Figure 2 for details on cover dynamics of most dominant species).
Temporal trends in relative cover of the most dominant colonial epibionts across sampling stations. For abbreviations see Table 1.

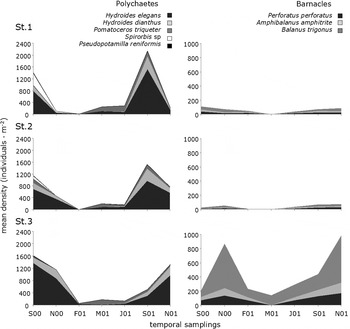
Considering solitary organisms 40,614 specimens were counted; polychaetes dominated in presence and abundance followed by crustaceans (see Figure 3 for details on their temporal dynamics at the three mussel farms), anthozoans, and ascidians (Table 3). On average 16 individuals were collected per shell. Polychaetes were represented by four species among which Hydroides elegans was the most abundant in all surveyed farms; its average density reached 320 individuals per metre. The ascidian Styela plicata, was another dominant epibiont, mostly in terms of biomass (50% of total wet weight).
Temporal trends in mean density of the most dominant solitary epibionts across sampling stations. For abbreviations see Table 1.

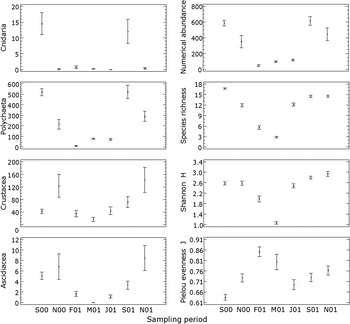
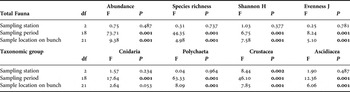
Most species were present in all three stations, except for Spirorbis sp. and Aiptasiogeton hyalinus that were absent from S3. Hydroides elegans was the most dominant and abundant species in mussel farms, followed by H. dianthus at S1 and S2 and by Balanus trigonus at S3 (Figure 3). Significant temporal differences in both diversity and abundance of solitary species were detected (ANOVA results in Table 4) following a decreasing trend in the cold period of the year (Figure 4). The relevant spatial differences were not significant; barnacles constituted the only exception showing increased abundance in S3 (Figure 3). The location of mussels on sock parts affected the associated epibionts excluding the case of A. hyalinus, where the relevant differences were not significant (Table 4); an opposite trend was observed in diversity and abundance with increased values at the upper and the deep part of the bunch, respectively.
Diversity and abundance of solitary epibionts and abundance of each dominant taxon over sampling periods. Bars represent standard error (S00 to N01, for abbreviations see Table 1)

Analysis of variance results for spatial (i.e. mussel farm and location on socks) and temporal (period of sampling) effects on the abundance and diversity of solitary epibionts (colonial species were included only in the case of species richness). Significant differences in bold.

Pearson's r correlation coefficient showed that none of the estimated biometric characters of mussels was significantly related to the epibiotic assemblage parameters, i.e. diversity, abundance or biomass (P > 0.05). The only significant correlations (P < 0.05) were assessed considering the condition index (CI) of mussels that was negatively related with epibiotic diversity (r = −0.299), abundance (r = −0.275), and biomass (r = −0.396).
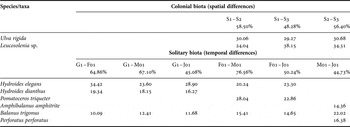
Multivariate analyses (Figure 5) showed that the structure of the fouling assemblage on cultured mussels followed contrasting patterns for colonial and solitary species, with the former (Figure 5A) manifesting primarily a spatial and the latter (Figure 5B) a temporal pattern of change. ANOSIM results confirmed the above schema. The location of sampling stations significantly affected the similarity of colonial epibionts (R = 0.192, P < 0.05) in contrast with the sampling period (P > 0.05). The green alga U. rigida and the calcareous sponge Leucosolenia sp. contributed mainly to the above pattern (SIMPER results, Table 5). The sampling period significantly affected the structure of solitary epibionts (R = 0.681, P < 0.05) in contrast with the location of sampling stations (P > 0.05). Polychaetes and barnacles modulated the relevant biotic pattern (SIMPER results, Table 5). BIOENV analysis showed that temperature combined with salinity and with water clarity were the only environmental parameters related, though very weakly, to the biotic pattern of colonial (r s = 0.154) and solitary organisms (r s = 0.152).
Non-metric multidimensional scaling ordination of the epibiotic community structure across sampling stations (1 to 3) and periods (S00 to N01, for abbreviations see Table 1) for colonial biota (A), solitary biota (B), and total sessile biota (C), based on Bray–Curtis similarity index.

SIMPER results. Species contribution to at least 50% among-groups dissimilarity (S1–S3 = sampling stations, G1 = S00, N00, S01, N01) analysing colonial and solitary biota, separately (for abbreviations see Table 1).

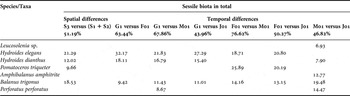
When analysing the whole sessile epibiotic community structure, incorporating solitary and colonial species (Figure 5C), significant spatial (R = 0.126, P < 0.05) and temporal (R = 0.456, P < 0.05) patterns of change were detected; the latter however, were more prominent. Pair-wise comparisons showed the discrimination of S3 from both S1 and S2 (P < 0.05), mainly due to the increased abundance of Hydroides and Balanus species (SIMPER results, Table 6). With respect to sampling period, socks collected in February, March and July 2001 were discriminated among each other and from all the other periods(P < 0.05) that formed a separate group (G1); the abundance of one colonial and six solitary species contributed to the above differences (SIMPER results, Table 6). BIOENV analysis showed that temperature combined with water clarity were the only measured environmental parameters related, though very weakly, to the biotic pattern of sessile biota (r s = 0.158).
SIMPER results. Species contribution to at least 50% among-groups dissimilarity (S1–S3 = sampling stations, G1 = S00, N00, S01, N01) analysing colonial and solitary sessile biota, in total (for abbreviations see Table 1).

DISCUSSION
Diversity and dominance of epibionts
The shell of mussels, including the common Mediterranean mussel M. galloprovincialis, constitutes a living substratum favourable for settlement of various sessile organisms (Tsuchiya & Nishihira, Reference Tsuchiya and Nishihira1986; Chintiroglou et al., Reference Chintiroglou, Damianidis, Antoniadou, Lantzouni and Vafidis2004; Borthagaray & Carranza, Reference Borthagaray and Carranza2007). On farmed populations, algae, bryozoans, barnacles, polychaetes, and ascidians are the most dominant groups (Perera et al., Reference Perera, Ballesteros and Turon1990; Lesser et al., Reference Lesser, Shumway, Cucci and Smith1992; Mengoli, Reference Mengoli1998; de Sa et al., Reference de Sa, Nalesso and Paresque2007; Woods et al., Reference Woods, Floerl and Hayden2012), almost exclusively represented by opportunistic species. In the present study all species found are considered r-selected, and therefore able to quickly colonize mussel shells (Antoniadou et al., Reference Antoniadou, Sarantidis and Chintiroglou2011a).
The four colonial species are conspicuous foulers in shellfish farms (Igic, Reference Igic1994; Guenther & De Nys, Reference Guenther and De Nys2006; de Sa et al., Reference de Sa, Nalesso and Paresque2007; Louro et al., Reference Louro, Christophersen, Magnesen and Roman2007; Woods et al., Reference Woods, Floerl and Hayden2012). Most of them, collected from the lip of mussel shells in the present study, have been reported as preferable colonizers of specific shell areas. For Obelia this trend has been attributed to a hydrodynamic mechanism, i.e. exploitation of high water currents due to filter feeding activity and low friction (Cerrano et al., Reference Cerrano, Bavestrello, Calcinai, Cattaneo-Vietti, Chiantore, Guidetti and Sara2001; Guenther & De Nys, Reference Guenther and De Nys2006).
Solitary forms massively settled on mussels. The most abundant among them, H. elegans and H. dianthus are typical fouling species (Bianchi & Morri, Reference Bianchi and Morri2001; Nedved & Hadfield, Reference Nedved, Hadfield and Costerton2008), very tolerant in unfavourable environmental conditions (Igic, Reference Igic1994; Bianchi, Reference Bianchi1981), and able to form large aggregations on artificial structures, including maricultures (Link et al., Reference Link, Nishi, Tanaka, Zavala, Kupriyanova and Yamakita2009). The most dominant, H. elegans is considered as the most typical fouler in the Mediterranean (Kocak et al., Reference Kocak, Ergen and Cinar1999) with severe negative impacts due to its ability of quickly colonizing newly submerged surfaces, including biotic ones and often creating thick aggregations of calcified tubes in a very short time (Nedved & Hadfield, Reference Nedved, Hadfield and Costerton2008; Antoniadou et al., Reference Antoniadou, Sarantidis and Chintiroglou2011a). Its fouling behaviour enhances dispersal ability of larvae over vast distances as suggested by the close genetic relatedness of its populations (Pettengill et al., Reference Pettengill, Wendts, Schug and Hadfield2007); the role of mussel farms to the expansion of serpulid populations has been highlighted by Antoniadou et al. (Reference Antoniadou, Sarantidis and Chintiroglou2011a). Among barnacles, B. trigonus is commonly a dominant species in fouling communities (Garcia & Moreno, Reference Garcia and Moreno1998; Thiyagarajan et al., Reference Thiyagarajan, Harder and Qian2003). Along with H. elegans and H. dianthus, it has been assigned among the worst invasive species in the Mediterranean (Zenetos et al., Reference Zenetos, Cinar, Pancucci-Papadopoulou, Harmelin, Furnari, Andaloro, Bellou, Streftaris and Zibrowius2005). The ascidian S. plicata, which dominated in Thermaikos mussels in terms of biomass, is an opportunistic species with great reproductive abilities, which can quickly form dense populations in eutrophic areas, often dominating fouling communities (Panagiotou et al., Reference Panagiotou, Antoniadou, Krestenitis and Chintiroglou2007). Of the other two solitary species, A. hyalinus and Ostrea edulis, recorded in the present study, the former has not been previously reported from farmed mussels, although it fouls mussels growing on piers, docks and buoys in ports (Birkemeyer, Reference Birkemeyer1996; Karalis et al., Reference Karalis, Antoniadou and Chintiroglou2003; Cinar et al., Reference Cinar, Katagan, Kocak, Ozturk, Ergen, Kocatas, Onen, Kirkim, Bakir, Kurt, Dagli, Acik, Dogan and Ozcan2008). The latter used to appear in large populations in the studied area but they collapsed in the 1990s due to combined effects of pollution, overfishing and infections (Virvilis & Angelidis, Reference Virvilis and Angelidis2006). Thus, the presence of oyster spats on farmed mussels can be viewed as encouraging for population recovery.
Comparing the diversity of sessile epibionts of M. galloprovincialis natural beds (D'Anna et al., Reference D'Anna, Giaccone and Riggio1985; Tsuchiya & Bellan-Santini, Reference Tsuchiya and Bellan-Santini1989; Topaloglu & Kihara, Reference Topaloglu and Kihara1993; Karalis et al., Reference Karalis, Antoniadou and Chintiroglou2003; Chintiroglou et al., Reference Chintiroglou, Damianidis, Antoniadou, Lantzouni and Vafidis2004; Cinar et al., Reference Cinar, Katagan, Kocak, Ozturk, Ergen, Kocatas, Onen, Kirkim, Bakir, Kurt, Dagli, Acik, Dogan and Ozcan2008; Antoniadou et al., Reference Antoniadou, Sarantidis and Chintiroglou2011a) with that of farmed populations (Perera et al., Reference Perera, Ballesteros and Turon1990; Mengoli, Reference Mengoli1998; Santacroce et al., Reference Santacroce, Conversano, Vlora, Colao and Centoducati2008) over the Mediterranean, a rather similar pattern emerges; an average of 25 species, almost the same, are being recorded in both cases. In contrast, the abundance of epibionts display evident differences; almost all sessile forms demonstrate much higher density in farmed populations. Similar conclusions are obtained, when considering non-Mediterranean mussels or other farmed bivalves (Lesser et al., Reference Lesser, Shumway, Cucci and Smith1992; de Sa et al., Reference de Sa, Nalesso and Paresque2007). The above pattern can be linked with the fact that most farms are installed in sheltered, shallow-water, coastal bays, where nutrients and organic matter accumulate (Lesser et al., Reference Lesser, Shumway, Cucci and Smith1992; Leblanc et al., Reference Leblanc, Landry and Miron2003; Santacroce et al., Reference Santacroce, Conversano, Vlora, Colao and Centoducati2008). Moreover, the epibiotic assemblages settled on farmed mussels are always in initial stages of ecological succession, since mussel socks are regularly removed and processed for human consumption; consequently, the development of the associated assemblages towards a more advanced succession stage through colonization by k-strategists is inhibited. The observed similarity in the diversity of epibionts between mussel farms and fouling assemblages developing in ports and estuaries (Tursi et al., Reference Tursi, Matarrese, Scalera Liaci, Montabaro and Cecere1984; Karalis et al., Reference Karalis, Antoniadou and Chintiroglou2003; Cinar et al., Reference Cinar, Katagan, Kocak, Ozturk, Ergen, Kocatas, Onen, Kirkim, Bakir, Kurt, Dagli, Acik, Dogan and Ozcan2008; Antoniadou et al., Reference Antoniadou, Sarantidis and Chintiroglou2011a) supports the above suggestions.
Temporal and spatial variation of epibiotic assemblage
The sessile epibiotic assemblage examined largely varied in time; most species exhibited fluctuations in presence and abundance, or cover for colonial forms, with a general trend to decrease during the cold season and increase from late summer to autumn. Such a pattern, previously reported in similar studies from natural mussel beds of the Aegean Sea (Karalis et al., Reference Karalis, Antoniadou and Chintiroglou2003; Chintiroglou et al., Reference Chintiroglou, Damianidis, Antoniadou, Lantzouni and Vafidis2004), is probably related to species life cycles and the prevailing environmental conditions. High biomass and cover during the warm period have been recorded for the alga U. rigida in spring (Malea & Haritonidis, Reference Malea and Haritonidis2000), the colonies of the bryozoan B. neritina and the hydrozoan Obelia from spring to summer (Lambert, Reference Lambert1991; Cifuentes et al., Reference Cifuentes, Krueger, Dumont, Lenz and Thiel2010) and Leucosolenia species in late summer and autumn (Orton, Reference Orton1914; Anakina & Drozov, Reference Anakina and Drozdov2001). Considering solitary forms, a pronounced seasonal recruitment peak in summer triggered by high temperature has been reported for serpulids, such as H. elegans and P. triqueter (Qiu & Qian, Reference Qiu and Qian1998; Campbell & Kelly, Reference Campbell and Kelly2002) and also for B. trigonus (Garcia & Moreno, Reference Garcia and Moreno1998; Qiu et al., Reference Qiu, Thiyagarajan, Leung and Qian2003).
An alternative explanation for the observed temporal variability derives from differences in socks' immersion. All socks immersed in November of two successive years (1998 and 1999) and retrieved either at 22 or 24 months showed high similarity in the structure of the supported sessile epibiotic communities, considering both the colonial and solitary organisms. When socks were retrieved a little earlier (at 20 months) some differences were observed mostly due to a decrease in Hydroides species densities. In socks immersed in March, Hydroides abundance was further decreased, whereas Pomatoceros density increased. These opposite trends in abundance, being stronger at longer lasting immersions (i.e. at socks retrieved after 26 months), possibly suggest competition between Hydroides and Pomatoceros, with the former species being superior competitor; it seems that only when the abundance of Hydroides is suppressed, can the population of Pomatoceros prosper in the studied mussel farms. Succession experiments have showed that serpulid abundance undergoes strong temporal variability, according both to the season in which succession started and to the period of immersion (Antoniadou et al., Reference Antoniadou, Voultsiadou and Chintiroglou2010, Reference Antoniadou, Voultsiadou and Chintiroglou2011b). With respect to immersion season, serpulid worms are particularly favoured when succession starts in winter or autumn (Antoniadou et al., Reference Antoniadou, Voultsiadou and Chintiroglou2011b) and this can explain the very high numbers recorded when socks were immersed in November compared with the relevant ones immersed in March. Both Hydroides elegans and Pomatoceros triqueter, which mainly contributed to the observed temporal patterns, can breed throughout the year in the Mediterranean with peaks during late spring to late autumn (Bianchi, Reference Bianchi1981; Castric-Fey, Reference Castric-Fey1983; Qiu & Qian, Reference Qiu and Qian1997). However, large between-year and between-season variations in recruitment have been reported (Cotter et al., Reference Cotter, O'Riordan and Myers2003). Abiotic factors, such as reduced salinity and temperature may inhibit serpulid recruitment, settlement and metamorphosis. Moreover, biotic processes are involved in serpulid recruitment (see Kupriyanova et al., Reference Kupriyanova, Nishi, Ten Hove and Rzhavsky2001 for a thorough review); for example the presence of Bugula colonies has been shown to enhance the settlement of Hydroides (Bryan et al., Reference Bryan, Kreider and Qian1998). With respect to immersion period, a positive relationship of Pomatoceros abundance according to the length of immersion has been reported, whereas Hydroides species largely fluctuated in time (Antoniadou et al., Reference Antoniadou, Voultsiadou and Chintiroglou2011b, Reference Antoniadou, Vafeiadou and Chintiroglouc). In our case, although the studied assemblages were at comparable succession stages (i.e. 20 to 26 months of immersion), some differences were observed in conformity to the previously described pattern. The species reproductive strategies and life spans (the longevity of Pomatoceros triqueter has been estimated around three years, whereas Hydroides elegans lives about one year—Kupriyanova et al., Reference Kupriyanova, Nishi, Ten Hove and Rzhavsky2001) are probably involved in the production of the above patterns, combined with other abiotic and biotic factors as well. Obviously, additional research is required controlling the factor of time (Underwood & Anderson, Reference Underwood and Anderson1994) to comprehend the temporal trends of the epibiotic assemblages settled on farmed mussels as succession proceeds.
In contrast with that clear temporal pattern observed, the sessile epibiotic assemblage was rather homogeneous at the spatial scale of this study. The three surveyed mussel farms supported quite similar epibionts, both in terms of diversity and density in Thermaikos Gulf, probably because they all exist in generally similar environmental conditions, under the influence of the GALA river system. One exception regarding the high abundance of barnacles in S3 in comparison to the other two stations, might imply local biotic trends, due to the high temperatures and reduced salinity recorded in summer at S1 and S2; both these parameters are negatively impacting Balanus recruitment (Thiyagarajan et al., Reference Thiyagarajan, Harder and Qian2003) and consequently the abundance of adult populations. Biotic interactions among sessile species are probably also involved; for example, Obelia species have been reported to inhibit the settlement of barnacle larvae, and this relationship became stronger under high prey densities (Johnson & Shanks, Reference Johnson and Shanks1997).
Besides the thoroughly analysed sessile biota, a number of vagile organisms have been found among mussels during the present work. Although not examined in detail, the following genera were identified: Stylochus, Leptoplana (Platyhelminthes), Phyllodoce, Marphysa, Lepidonotus, Eunice, Nereis, Perinereis (Polychaeta), Corophium, Caprella (Amphipoda) Sphaeroma (Isopoda), Athanas, Alpheus, Palaemon, Monodaeus, Pilumnus, Pisidia (Decapoda), Anadara, Chlamys, Lima (Bivalvia), Bittium (Gastropoda), Ophiothrix (Ophiuroidea), Paracentrotus, Psammechinus (Echinoidea) and Blennius (Pisces). Several of these organisms are predators, and accordingly have the potential to severely affect the structure of the sessile epibiotic mussel community. For example, flatworms and crabs are prominent consumers of barnacles (Standing, Reference Standing and Mackie1976; Buschbaum, Reference Buschbaum2002); thus, the increased density of barnacles at S3 can be attributed to low predation pressure due to declining flatworm populations at this site. However, as the sessile epibiotic community creates a complicated biotic construction over mussel shells, a comprehensive study of the entire biotic complex and the associated vagile fauna seems necessary to elucidate interactions among the organisms involved and the emerging biotic patterns.
Local-scale variation in environmental conditions might be the reason for the observed distinct spatial pattern when colonial epibionts were separately analysed. The divergence of farm S2 in most samplings, the mussels of which were less covered with colonial epibionts such as Obelia sp., and the higher cover of Leucosolenia sp. replaced by B. neritina at S3 might be related to the influence of fluvial sediment transport and deposition in Thermaikos Gulf. Thus, the reduced impact of fine sediments in S3, due to its greater distance from the GALA system (Krestenitis et al., Reference Krestenitis, Kombiadou and Savvidis2007), possibly explains the higher presence of Leucosolenia sp., since sponges are negatively affected by siltation (Carballo et al., Reference Carballo, Vega, Cruz-Barraza, Yáñes, Nava, Ávila and Wilson2008). Likewise, the higher impact of sewage, agricultural and industrial effluents in the S2 area may explain the limited presence of Obelia sp., as the species can tolerate moderate pollution impact (Igic, Reference Igic1994). As for B. neritina, the observed differences are most likely related to biotic factors, mainly competition for space, since it is a worldwide fouler, highly resistant to pollution (Piola & Johnston, Reference Piola and Johnston2006). Its decline at S3 can be attributed to the strongest competition for space with barnacles on the heavily fouled mussels, since it is an inferior competitor (Piola & Johnston, Reference Piola and Johnston2006). Another possible explanation derives from differences in mussel growth rate. At S2 accelerated growth of mussels due to increased nutrient concentrations has been reported (Kravva et al., Reference Kravva, Staikou and Triantaphyllidis2007) that might negatively affect the coverage of colonial epibionts.
The synthesis of sessile epibionts on farmed mussels may differ over the Mediterranean. The dominant fouling Hydroides species and Balanus trigonus found in the present study have been reported on farmed M. galloprovincialis shells in Italy (Mengoli, Reference Mengoli1998), but not in Spain, where they were observed in oyster cultures (Perera et al., Reference Perera, Ballesteros and Turon1990). It appears that epibiotic assemblages fouling farmed mussels are shaped by various factors, biotic (e.g. life cycle of organisms and interactions) and abiotic (e.g. water mass characteristics and management practices used by farmers) and further research is required to explain and predict biotic patterns.
Relationships between sessile epibionts and mussels
The known relationships between bivalves and their epibionts have been considered beneficial for the former since the presence of the latter reduces potential physical stress and promotes escape from predators (Laudien & Wahl, Reference Laudien and Wahl2004; Cerrano et al., Reference Cerrano, Calcinai, Bertolino, Valisano and Bavestrello2006; Farren & Donovan, Reference Farren and Donovan2007; but see Buschbaum & Saier, Reference Buschbaum and Saier2001).
However, in the particular case of suspended cultures, where the mussels are hovering in the water column not allowing easy access to predators, this relationship might turn harmful by reducing growth and survivorship of farmed bivalves (de Sa et al., Reference de Sa, Nalesso and Paresque2007; Daigle & Herbinger, Reference Daigle and Herbinger2009). More specifically, epibionts might have severe implications for their basibiont by: (i) obstructing water flow, consequently reducing food availability, since most follow the same feeding mode with farmed bivalves (Arakawa, Reference Arakawa1990; Claereboudt et al., Reference Claereboudt, Bureau, Cote and Himmelman1994; Taylor et al., Reference Taylor, Southgate and Rose1997); (ii) reducing oxygen supply (Wallace & Reisnes, Reference Wallace and Reisnes1985); (iii) hindering vital functions of bivalves, such as valve opening (Lesser et al., Reference Lesser, Shumway, Cucci and Smith1992; Lodeiros & Himmelman, Reference Lodeiros and Himmelman1996); (iv) increasing dislodgement risk due to overweight (Witman & Suchanek, Reference Witman and Suchanek1984; Santacroce et al., Reference Santacroce, Conversano, Vlora, Colao and Centoducati2008); and (v) favouring infestations and causing high spat mortality (Mortensen et al., Reference Mortensen, Van der Meeren, Fosshagen, Hernar, Harkestad, Torkildsen and Bergh2000).
Contrasting results report no effect on growth (Widman & Rhodes, Reference Widman and Rhodes1991; Lesser et al., Reference Lesser, Shumway, Cucci and Smith1992; Leblanc et al., Reference Leblanc, Landry and Miron2003) or even propose beneficial effects, i.e. increased food availability and subsequent promotion of growth in cultivated species (Ross et al., Reference Ross, Thorpe, Norton and Brand2002). The assessment of the overall impact on farmed bivalves becomes even more complicated if we take into account interactions among epibiotic species. For instance, the extensive cover of sponges and tunicates, although inhibiting growth of farmed bivalves (Santacroce et al., Reference Santacroce, Conversano, Vlora, Colao and Centoducati2008), might act positively for the latter by inhibiting as well the settlement and overgrowth of other invertebrate species, such as barnacles, which are a major problem in shellfish cultures (Armstrong et al., Reference Armstrong, McKenzie and Goldsworthy1999; Cano et al., Reference Cano, Campos and Roman2000).
The results of the present study showed that epibionts negatively affected farmed mussel populations. However, this impact was rather weak, possibly due to the absence of boring species, such as sponges (genus Cliona), and polychaetes (genus Polydora). Boring organisms are often found in mussel beds (Chintiroglou et al., Reference Chintiroglou, Damianidis, Antoniadou, Lantzouni and Vafidis2004; Cinar et al., Reference Cinar, Katagan, Kocak, Ozturk, Ergen, Kocatas, Onen, Kirkim, Bakir, Kurt, Dagli, Acik, Dogan and Ozcan2008) and have been associated with: (i) increased mortality; (ii) decreased condition index; and (iii) loss of market quality (Kent, Reference Kent1979). Although further data are required to generalize the consequences of epibiosis on farmed mussels, undoubtedly biofouling causes severe problems to farmers by reducing growth and demanding laborious handling of the final product. Besides the condition index, no other biometric characteristic of mussels was correlated with the epibiotic community parameters; this was not unexpected, since the fouling community was examined at comparable succession stage, as safeguarded by selecting mussel socks of similar age (20–26 months) and size structure (mean shell length of farmed mussels at 65 mm). All epibionts found were suspension feeders as previously observed (Santacroce et al., Reference Santacroce, Conversano, Vlora, Colao and Centoducati2008). Thus, in our case as well, the reduced growth of mussels may be explained by food competition between epibionts and their basibiont. Nevertheless, since food is not a limiting factor in Thermaikos, epibionts are probably not trophic competitors (Lesser et al., Reference Lesser, Shumway, Cucci and Smith1992; Mazouni et al., Reference Mazouni, Gaertner and Deslous-Paoli2001; Leblanc et al., Reference Leblanc, Landry and Miron2003; Santacroce et al., Reference Santacroce, Conversano, Vlora, Colao and Centoducati2008). It is most likely that the adverse effect on mussel growth is linked with high dislodgement risk and energy consumption required to support heavily fouled shells instead of investing in somatic growth, as has been previously suggested for M. galloprovincialis cultures in the Mediterranean (Santacroce et al., Reference Santacroce, Conversano, Vlora, Colao and Centoducati2008). Clogging of valves cannot be excluded, since many epibionts prefer to colonize the lip area (Cerrano et al., Reference Cerrano, Calcinai, Bertolino, Valisano and Bavestrello2006; Guenther & De Nys, Reference Guenther and De Nys2006) as also observed in the present study.
CONCLUDING REMARKS
According to our results, the sessile epibiotic assemblage fouling farmed populations of the common Mediterranean mussel hosts a diversity comparable to that observed on natural mussel beds; the former, however, supported increased abundance/cover of epibionts, possibly due to the high trophic status in the areas of mussel aquaculture installations. The examined epibiotic assemblage showed increased similarity at the spatial scale of this study; however, taking into account the few relevant data from the Mediterranean, increased variability at broad spatial scales can be suggested. Most epibionts manifested strong temporal variability, probably related to their life cycle and prevailing environmental conditions. Epibionts negatively impacted farmed mussel populations; however, this impact was rather weak and further data are required to generalize the consequences of epibiosis on farmed mussels. According to our data, in agreement with previous relevant works, the shell of M. galloprovincialis is a suitable substratum for the settlement of several organisms, hosting a diverse sessile epibiotic community and thus, supporting the contribution of mussels in ecosystem engineering processes. Serpulids, barnacles, and ascidians together with other less contributing epibionts, such as algae, hydrozoans, and bryozoans, form a complex biotic construction over mussel shells, enhancing habitat complexity and providing space for settlement to many vagile organisms. A comprehensive study of the entire sessile biotic complex and the associated motile fauna would improve our comprehension of the relationships among the organisms involved and elucidate the mechanisms of these processes and their significance for the basibiont and the benthic environment, as well.
ACKNOWLEDGEMENTS
We are grateful to the mussel farmers Charalampidis and Liolios, and the captains and the crew of the shell-fishing vessels ‘Agios Petros’ and ‘Agios Nikolaos’ for their help during samplings. We are also grateful to the two anonymous referees for their constructive criticism and comments that highly improved our manuscript.