Introduction
Soybean seed traits such as 100-seed weight (100SW), protein content (PRC) and oil content (OIC) have important roles in the determination of the quality of soy foods and feeds. It is commonly understood that these three traits are controlled by multiple genes. Currently, there are more than 119 quantitative trait loci (QTL) for 100SW, 139 QTL for PRC and 131 QTL for OIC reported in SoyBase (www.soybase.org).
Annual wild soybean (Glycine soja Sieb. et Zucc.) with characteristics of small seed, high PRC and low OIC is acknowledged to be the wild progenitor of domesticated soybean (Broich and Palmer, Reference Broich and Palmer1980). However, unwanted linkages often thwart the successful incorporation of beneficial exotic genes into commercial lines. Chromosome segment substitution lines (CSSLs) may solve the problem to a certain degree by separating the whole genome into segments with the linked genes/QTL going to different segments. To explore and utilize the favourable alleles present in wild soybean, Wang et al. (Reference Wang, He, Yang, Xiang, Zhao, Xing and Gai2012, Reference Wang, He, Yang, Xiang, Zhao and Gai2013a, Reference Wang, He, Yang, Xiang, Xing, Zhao and Gaib) developed a set of 151 wild soybean CSSLs, designated as SojaCSSLP1, with all the substituted segments covering the whole genome of a wild soybean (N24852) in the genetic background of an elite cultivated soybean (NN1138-2).
In the present study, SojaCSSLP1 soybean lines were used to locate and evaluate wild segments for 100SW, PRC and OIC. It is expected that the wild segments related to the three seed-quality traits can be identified and characterized in comparison with the QTL mapping results obtained from the cultivated soybean, so that allele differentiation and evolution from the wild to the cultivated soybean can be revealed.
Materials and methods
The 151 CSSLs of SojaCSSLP1 along with their two parents were used for QTL/segment analysis. The lines were tested in a completely randomized block design experiment with three replications, one row per plot, 50 cm row spacing, 20 plants per row and 10 cm interval between plants. The 100SW was scored as g/100 seeds. The PRC and OIC were determined as percentages by near-infrared reflectance.
It is known that different procedures use different genetic models and algorithms that may not always be applicable to a specific population. Due to the extreme skewing of alleles towards the recurrent parent in SojaCSSLP1, four kinds of genetic statistical models were used to investigate the association between the phenotype and the G. soja substituted segment, including single-marker analysis (SMA, P< 0.01) and interval mapping (additive regression model) of the software Map Manager QTX (Manly et al., Reference Manly, Cudmore and Meer2001), inclusive composite interval mapping (ICIM, RSTEP-LRT-ADD model) of ICIM version 3.0 (Li et al., Reference Li, Ye and Wang2007), and mixed linear composite interval mapping (mixed linear model) of QTLNetwork 2.0 (Yang et al., Reference Yang, Hu, Hu, Yu, Xia, Ye and Zhu2008), based on the soybean consensus genetic linkage map (Song et al., Reference Song, Marek, Shoemaker, Lark, Concibido, Delannay, Specht and Cregan2004).
Results and discussion
The widespread segregation of 100SW, PRC and OIC among the lines (Table S1, available online) provided an opportunity for detecting QTL/segments for these traits.
Determination and evaluation of wild segments for 100SW
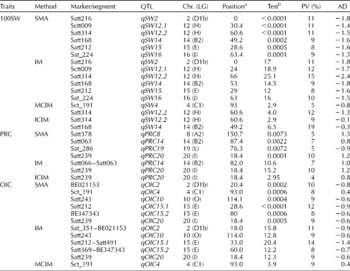
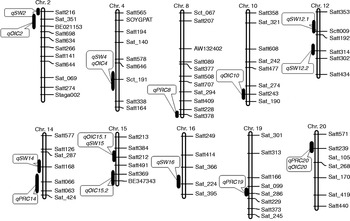
Seven wild segments were identified and found to be associated with 100SW. The phenotypic variance (PV) explained by individual QTL/segments ranged from 5 to 15%, and the additive effects for wild alleles varied from − 2.4 to − 0.8 g (Table 1 and Fig. 1). The loci on segments Sct_191, Sctt009, Satt314, Satt168 and Satt212 were near to or in the same region as the QTL detected in other G. max crosses (Mian et al., Reference Mian, Bailey, Tamulonis, Shipe, Carter, Parrott, Ashley, Hussey and Boerma1996; Orf et al., Reference Orf, Chamse, Jarvik, Mansur, Cregan, Adler and Lark1999; Lee et al., Reference Lee, Park, Lee, Park and Boerma2001; Hoeck et al., Reference Hoeck, Fehr, Shoemaker, Welke, Johnson and Cianzio2003; Liu et al., Reference Liu, Fujita, Yan, Sakamoto, Xu and Abe2007; Li et al., Reference Li, Pfeiffer and Cornelius2008a, Reference Li, Jiang, Zhang, Qiu, Liu, Li, Gao, Chen and Hub; Zhang et al., Reference Zhang, Zhao and Gai2008; Zhou et al., Reference Zhou, Xing, Chen and Gai2010) (Table S2, available online). Two other segments, Satt216 and Sat_224, were newly identified in the present study, indicating that the two alleles from G. soja probably do not exist in the cultivated soybean.
Quantitative trait loci (QTL)/segments for 100-seed weight (100SW), protein content (PRC) and oil content (OIC) detected in SojaCSSLP1

Chr., chromosome; LG, linkage group; PV, phenotypic variance explained by the QTL; AD, additive effect of allele from Glycine soja; SMA, single-marker analysis; IM, interval mapping; MCIM, mixed linear composite interval mapping; ICIM, inclusive composite interval mapping.
a The position of the QTL in the LG based on the consensus map (Song et al., Reference Song, Marek, Shoemaker, Lark, Concibido, Delannay, Specht and Cregan2004).
b P value, likelihood ratio value, logarithm of odds value and F value from the SMA, IM, ICIM and MCIM, respectively.
Ten chromosomes (Chr.) that harboured the quantitative trait loci/segments for 100-seed weight, protein content and oil content in SojaCSSLP1.

Determination and evaluation of wild segments for PRC
Four wild segments were identified and found to be associated with PRC. According to the SMA, the PV explained by individual QTL/segments varied from 5 to 10%, and all the G. soja alleles increased PRC, except Sat_286 (Table 1 and Fig. 1). The four QTL/segments could be detected in other G. max crosses (Mansur et al., Reference Mansur, Orf, Chase, Jarvik, Cregan and Lark1996; Brummer et al., Reference Brummer, Graef, Orf, Wilcox and Shoemaker1997; Vollmann et al., Reference Vollmann, Schausberger, Bistrich and Lelley2002; Chung et al., Reference Chung, Babka, Graef, Staswick, Lee, Cregan, Shoemaker and Specht2003; Tajuddin et al., Reference Tajuddin, Watanabe, Yamanaka and Harada2003; Kabelka et al., Reference Kabelka, Diers, Fehr, LeRoy, Baianu, You, Neece and Nelson2004; Zhang et al., Reference Zhang, Wang, Luo, Zhang, He, Wu, Gai and Chen2004; Nichols et al., Reference Nichols, Glover, Carlson, Specht and Diers2006; Reinprecht et al., Reference Reinprecht, Poysa, Yu, Rajcan, Ablett and Pauls2006) (Table S2, available online). Therefore, no new loci/segments were found in SojaCSSLP1, which implied that allele differentiations had already occurred on these loci/segments among the G. soja and G. max parental lines.
Determination and evaluation of wild segments for OIC
Six G. soja segments were identified and were found to be associated with OIC. The PV explained by individual QTL/segments varied from 8 to 14%. All the G. soja-derived alleles reduced OIC, except Sct_191 (Table 1 and Fig. 1). In comparison with the previous literature, the six QTL/segments could also be detected in other G. max crosses (Diers et al., Reference Diers, Keim, Fehr and Shoemaker1992; Lee et al., Reference Lee, Bailey, Mian, Carter, Shipe, Ashley, Parrott, Hussey and Boerma1996; Sebolt et al., Reference Sebolt, Shoemaker and Diers2000; Csanádi et al., Reference Csanádi, Vollmann, Stift and Lelley2001; Specht et al., Reference Specht, Chase, Macrander, Graef, Chung, Markwell, Germann, Orf and Lark2001; Chung et al., Reference Chung, Babka, Graef, Staswick, Lee, Cregan, Shoemaker and Specht2003; Tajuddin et al., Reference Tajuddin, Watanabe, Yamanaka and Harada2003; Fasoula et al., Reference Fasoula, Harris and Boerma2004; Kabelka et al., Reference Kabelka, Diers, Fehr, LeRoy, Baianu, You, Neece and Nelson2004; Nichols et al., Reference Nichols, Glover, Carlson, Specht and Diers2006; Reinprecht et al., Reference Reinprecht, Poysa, Yu, Rajcan, Ablett and Pauls2006; He, Reference He2008; Wen et al., Reference Wen, Zhao, Zheng, Liu, Wang, Wang and Gai2008; Liu et al., Reference Liu, Zhou, Yu, Chen and Gai2009; Qi et al., Reference Qi, Wu, Han, Sun, Du, Liu, Jiang, Hu and Chen2011) (Table S2, available online). Therefore, in the present study, no new alleles/segments were identified in the G. soja parent as well as in SojaCSSLP1.
Relationship between 100SW, PRC and OIC
From the mapping results, the G. soja segment Satt239 was found to be associated with a positive PRC effect and a negative OIC effect. This might be the QTL/segment basis of a negative correlation between PRC and OIC (r= − 0.69, P< 0.0001), also reported by Chung et al. (Reference Chung, Babka, Graef, Staswick, Lee, Cregan, Shoemaker and Specht2003). However, there were three and five other G. soja alleles/segments responsible for the increase in PRC and OIC, respectively, located on eight different chromosomes. This leads to the possibility of combining G. soja favourable alleles of PRC and OIC. Thus, it is possible to combine the G. soja segments Satt378 and Satt063 for an increase in PRC with the G. soja segment Sct_191 for an increase in OIC to develop cultivars with both contents increased. Of the 13 QTL on 11 segments for 100SW and OIC, the G. soja segment Sct_191 was found to be associated with a negative 100SW effect and a positive OIC effect, and the G. soja segment Satt212 was found to be associated with negative effects for both 100SW and OIC. This opposite situation might be the reason for the obvious non-correlation between the two traits (r= − 0.01).
Evolutionary allele changes in seed-quality traits during and after domestication
According to our results, all the seven G. soja segments for 100SW in SojaCSSLP1 had negative effects, while both positive and negative effects were detected for the other two traits. This means that the selection direction and pressure on 100SW were basically the same and intensive to make it from the G. soja as low as 1.0 g to the cultivated soybean as great as more than 60 g in the germplasm collection. However, the selection direction and selection pressure for PRC and OIC were not as uniform and strong as those for 100SW. Therefore both positive and negative effect alleles/segments resulted in the latter two traits.
Supplementary material
To view supplementary material for this article, please visit http://dx.doi.org/10.1017/S147926211400029X
Acknowledgements
The authors thank all those who participated in the research for their assistance. This study was supported by the National Key Basic Research Program of China (2011CB1093 and 2010CB1259), the National High-tech R&D Program of China (2011AA10A105 and 2012AA101106), the Natural Science Foundation of China (30900902 and 31071442), the MOA Public Profit Program (200803060) and the MOE 111 Project (B08025).