Introduction
The village or indigenous chickens (Gallus gallus domestica) of Cameroun are unselected populations kept under traditional management practices for millennia. They are mostly reared in a backyard system with low input. They provide better health and wealth to rural households thanks to their well appreciated high-grade proteins through meat and eggs (Moula et al., Reference Moula, Farnir, Salhi, Iguer-Ouada, Leroy and Antoine-Moussiaux2012). They therefore contribute significantly to poverty alleviation and food security of more than 60 percent of families living in rural areas in Cameroon (HakoTouko et al., Reference HakoTouko, Keambou, Han-Jun, Bembide, Cho, Skilton, Djikeng, Ogugo, Manjeli, Tebug, Zoli and Osama2013). However, the breeding stock is almost always renewed every year due to high mortalities. Bad management practices and disease outbreaks are the main causes with the Newcastle disease alone resulting more than 70 percent of avian mortalities in endemic areas (Buza and Mwamhehe, Reference Buza and Mwamhehe2001; Mtileni et al., Reference Mtileni, Muchadeyi, Maiwashe, Chimonyo and Dzama2012; HakoTouko et al., Reference HakoTouko, Keambou, Han-Jun, Bembide, Cho, Skilton, Djikeng, Ogugo, Manjeli, Tebug, Zoli and Osama2013). Vaccination can be a good approach to solve the problem but its implementation in rural areas is not cost effective and most of the vaccines used are neither thermo-stable nor available, especially for remote areas. In such context, having the fittest and prolific genotypes which can resist or survive to disease outbreaks is a challenge and selection for disease resistance or tolerance is believed to be a long term strategy
Disease resistance is a poly-factorial trait with low to moderate heritability. It is controlled by environmental and genetic factors (Jie and Liu, Reference Jie and Liu2011), including the major histocompatibility complex B (MHC-B) (Lamont, Bolin and Cheville, Reference Lamont, Bolin and Cheville1987; Taylor, Reference Taylor2004) and quantitative trait loci (QTL) scattered throughout the genome (Yonash et al., Reference Yonash, Cheng, Hillel and Cahaner2001; Biscarini et al., Reference Biscarini, Bovenhuis, van Arendonk, Parmentier, Jungerius and van der Poel2010). For these reasons, the expected genetic progress after selection for one or a few candidate genes might be low and time consuming. Besides, alleles or genes conferring resistance to a disease can express an opposite response against another disease or a different strain of the same pathogen (McBride et al., Reference McBride, Cutting, Schierman, Strebel and Watanabe1981). The whole genome selection has been proposed (Fulton, Reference Fulton2012) but this approach is very expensive for developing countries. The selection for differential antibody responsiveness to vaccines or wild pathogen strains is an alternative (HakoTouko et al., Reference HakoTouko, Keambou, Han-Jun, Bembide, Cho, Skilton, Djikeng, Ogugo, Manjeli, Tebug, Zoli and Osama2013) and exploration of the genetic diversity of genes or QTLs involved in the tolerance or resistance process is a prerequisite toward this step.
The chicken MHC-B is a cluster of immune function genes commonly identified by serological typing with polyclonal antisera produced by immunizations between birds having different haplotypes (Fulton et al., Reference Fulton, Juul-Madsen, Ashwell, McCarron, Arthur, O'Sullivan and Taylor2006). It is located on the micro-chromosome 16. MHC region includes the BF, BG and BL genes as well as many other immune-related genes. It is the terminology used to distinguish between the MHC as originally identified as the B blood group locus from the MHC-Y which is a genetically unlinked separate cluster of MHC-like genes. The function of BF-encoded class I molecules is to present the antigen peptides resulting from the proteolysis of endogenous tumoural and viral proteins to T8 cytotoxic lymphocytes. BL-encoded class II molecules are responsible of presenting the antigen peptides resulting from the proteolysis of extracellular proteins to T4 lymphocytes (Chazara, Reference Chazara2010). The MHC-B is known for its implication to disease resistance or susceptibility to numerous pathogens. It is the case for fowl cholera (Jie and Liu, Reference Jie and Liu2011), avian leucosis virus (Yoo and Sheldon, Reference Yoo and Sheldon1992), Marek's disease virus (Bacon, Hunt and Cheng, Reference Bacon, Hunt and Cheng2001), Rous sarcoma tumour virus (Taylor, Reference Taylor2004), Salmonella (Cotter, Taylor and Abplanalp, Reference Cotter, Taylor and Abplanalp1998) and Newcastle disease (Lwelamira et al., Reference Lwelamira, Kifaro, Gwakisa and Msoffe2008; HakoTouko et al., Reference HakoTouko, Keambou, Han-Jun, Bembide, Cho, Skilton, Djikeng, Ogugo, Manjeli, Tebug, Zoli and Osama2013). Serological typing is applied on inbred lines for the development of serological reagents with the majority being derived from the White Leghorn breed (Fulton et al., Reference Fulton, Juul-Madsen, Ashwell, McCarron, Arthur, O'Sullivan and Taylor2006). It is limited by cross-reactivity and not effective on outbred populations (Kroemer, Guillemot and Auffray, Reference Kroemer, Guillemot and Auffray1990; Fulton, Young and Bacon, Reference Fulton, Young and Bacon1995). Inbred lines contain limited combinations of BG, BF and BL genes. In outbred populations, novel alleles and combinations of alleles lead to difficulties of producing haplotype-specific antisera, resulting in inaccurate haplotype identification. An accurate typing of outbred chicken populations is important for the development of new serological reagents as well as for differential antibody responsiveness related studies. Studies have been done on the molecular typing of the MHC-B, also known as the core MHC, using the microsatellite markers LEI0258 andMCW0371, mapped to chromosome 16 (McConnell et al., Reference McConnell, Dawson, Wardle and Burke1999; Buitenhuis et al., Reference Buitenhuis, Rodenburg, Van Hierden, Siwek, Cornelissen, Nieuwland, Crooijmans, Groenen, Koene, Korte, Bovenhuis and Van der Poel2003). These markers are closely located to genes of the MHC-B and successfully investigated as genetic markers for MHC haplotype using polyclonal allo-antisera (Fulton et al., Reference Fulton, Juul-Madsen, Ashwell, McCarron, Arthur, O'Sullivan and Taylor2006; Chazara, Reference Chazara2010). The objective of this study was to identify existing and new MHC-B microsatellite haplotypes in Cameroon chicken populations prior to their evaluation for differential antibody responsiveness to vaccines or infections.
Materials and methods
Sample collection
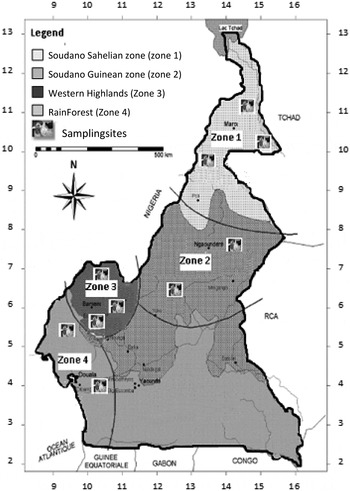
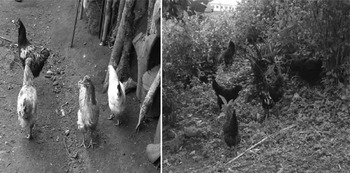
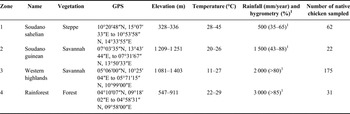
Adult chickens were randomly sampled in four agro-ecological zones of Cameroon (Figure 1) according to their GPS coordinates and the importance of the family poultry production. The names of agro-ecological zones (ecotypes) are according to “Institut de la Recherche Agronomique pour le Développement (IRAD Cameroon)”. The description of agro-ecological zones of Cameroon has been reported (Fotsa et al., Reference Fotsa, Poné, Bordas, Tixier-Boichard and Rognon2011). Table 1 shows the characteristics of agro-ecological zones and the number of chickens sampled per zone. Some local phenotypes of the native chickens of Cameroon in their natural environment are shown in Figure 2.
Cameroon map showing the four sampled agro-ecological zones and sampling sites. Note: Geographical point coordinates are shown on horizontal and vertical graduated axes.

Various phenotypes of Cameroon native chickens.

Characteristics of agro-ecological zones and number of chickens sampled per zone.

1 Hygrometry.
Blood samples were collected and stored on Whatman FTA filter cards (Whatman International Ltd). A total of 366 chickens of both sexes were sampled, of which 290 were native chickens, 32 were from commercial breeds comprising two broiler lines (21 chickens) and Lohmann brown layers (11 chickens) reared countrywide and suspected to be the main vector of genetic introgression of exotic strains within-country native chicken populations. An additional 54 samples from 13 Korean chicken populations were used as out-groups.
PCR amplification and genotyping of MHC-B microsatellite markers
Two highly polymorphic MHC-B microsatellite markers, LEI0258 and MCW0371 (Fulton et al., Reference Fulton, Juul-Madsen, Ashwell, McCarron, Arthur, O'Sullivan and Taylor2006), were used. The DNA was extracted by the boiling method and duplex PCR was done using 50 ng of genomic DNA with 10 pmol of each primer in a total PCR volume of 10 μl using 6 μl of ready to used Dream Taq PCR Master Mix (2X) (Fermentas) and 3.6 μl water of nuclease-free. The primer sequence were CACGCAGCAGAACTTGGTAAGG forward and AGCTGTGCTCAGTCCTCAGTGC reverse for LEI0258 and CTGCTCCGAGCTGTAATCCTG forward and TTTCATGGCATCCTAAGATG reverse for MCW0371. The optimal PCR conditions were determined by gradient PCR using aTECHNE TC-PLUS PCR machine. PCR using optimal conditions was performed with a9800 Fast Thermal Cycler (Applied Biosystems) using the following thermal cycling conditions: initial denaturation of 5 min at 95 °C followed by 30 cycles of 30 s denaturation at 94 °C, 45 s primer annealing at 60 °C and 1 min primer extension at 72 °C, and then a final extension step of 10 min at 72 °C. Allele sizes relative to an internal size standard (GENESCAN-500(LIZ)) were analysed on an automated DNA sequencer (ABI PRISM® 3730) and scored with Genemapper version 4.1.
Statistical analysis
Genetic diversity indices such as allele frequencies, mean number of alleles (Na), observed (Ho) and expected (He) heterozygosities, and polymorphism information contain (PIC) were calculated for each population using Microsatellite Toolkit (Park, Reference Park2001). Allelic richness (i.e. the corrected mean allele number in the standardized sample size, AR) was calculated using FSTAT 2.9.3 (Goudet, Reference Goudet2001). Analysis of molecular variance (AMOVA) was achieved using Arlequin 3.5.1.3 according to the procedure of Weir and Cockerham (Reference Weir and Cockerham1984). Wright's F-statistics (within population inbreeding [F IS], total inbreeding [F IT], and among population genetic differentiation [F ST]) for each locus and overall population and pair wise F ST values were obtained with STAT using the variance-based method of Weir and Cockerham (Reference Weir and Cockerham1984). Unbiased estimate of exact P-values were obtained using the Markov Chain Monte Carlo (MCMC) algorithm (Guo and Thompson, Reference Guo and Thompson1992). Genetic relationships among populations were estimated by constructing a dendrogram based Nei's D A genetic distances Nei, Reference Nei1972) using UPGMA method implemented in PHYLIP version 3.5 with 1 000 bootstraps (Felsenstein, Reference Felsenstein2009).
Results
Genetic diversity
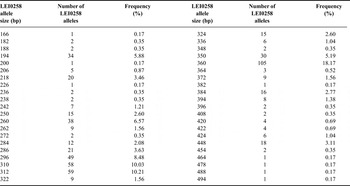
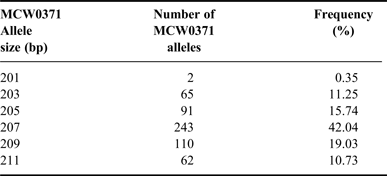
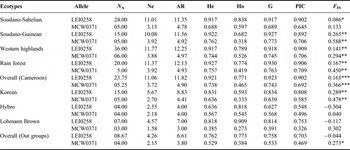
The two MHC-B markers amplified a total of 48 alleles, of which 6 alleles (201 to 211 bp) at MCW0371 and 42 alleles (166 to 494 bp) at LEI0258 (Table 2). LEI0258 and MCW0371 allele sizes amplified as well as their frequencies are presented in Tables 3 and 4. Genetic diversity indices for each native chicken ecotype and for the out-groups are presented in Table 5. The least values observed for Na, Ne and AR were 10.00, 7.00 and 8.06, respectively. The highest values for the same parameters were 21, 7.82 and 8.61, respectively. Overall, the lowest values were observed in the Soudano-Guinean ecotype while the highest were in the western highlands. The two microsatellite markers used were highly informative with a PIC greater than 0.70. Overall, genetic diversity indices were higher in Cameroon population compared to out-groups. The marker LEI0258 was the most polymorphic. The AMOVA (Table 6) revealed 5.70 percent of variation among Cameroon ecotypes and 11.29 percent variation among individuals within ecotypes. The greatest variability (83.00 percent) was among individuals.
Allelic patterns and F-statistics for each loci across Cameroonian native chicken populations.

*** P < 0.0001.
N A, total number of allele; ASR, allele size range; F IS, within population inbreeding; F IT, total inbreeding; F ST, among population genetic differentiation.
Sizes in base pair (bp), frequencies (%) and numbers of LEI0258 allele sizes observed in the local chicken population of Cameroon. Please make that the data of out-groups are not included!

Sizes in base pair (bp), frequencies (%) and numbers of MCW0371 allele sizes observed in the local chicken population of Cameroon.

Diversity parameters in four Cameroonian native chicken ecotypes over the studied MHC-B markers.

*,**,***P < 0.5, P < 0.01 and P < 0.001, respectively.
N A, total number of alleles; Ne, number of effective alleles; AR, Allelic richness; He, expected heterozygosity; Ho, observed heterozygosity; G, gene diversity over loci; PIC, polymorphism information contain; F IS, within population inbreeding.
Analysis of molecular variance of MHC markers (LEI0258 and MCW0371) across Cameroon native chicken agro-ecological zones.

** P < 0.01.
Genetic differentiation and relationships among populations
The global inbreeding coefficients of overall populations, among population and within population (F IT, F ST and F IS) were 0.26, 0.04 and 0.22, respectively (Table 2), leading to an overall F IS of 0.26. All were highly significant (P < 0.001) for both LEI0258 and MCW0371 loci. For all native chicken ecotypes the F IS showed a significant (P < 0.001) deficit in heterozygotes ranging from 0.11 in Soudano-Sahelian to 0.41 in Soudano-Guinean.
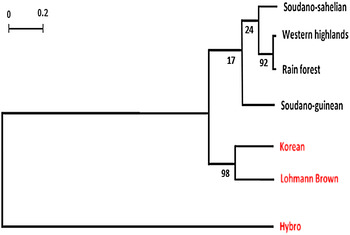
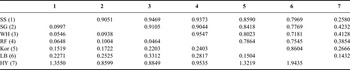
Nei's genetic distance (D A) (Table 7) was lower between within-country ecotypes of chickens compared to out-groups. Within-country ecotypes, the smallest D A (0.046) was observed between Rain forest and Western highlands while the largest (0.10) was between Rain forest and Soudano-Guinean. As it is expected (Figure 3), local chicken ecotypes are closely related to each other but distant to exotic strains (out-groups). Soudano-Sahelian ecotype is close to Western highlands and then to Rain forest than to Soudano-Guinean.
Dendrogram based Nei's D A genetic distances using UPGMA method.

Nei's D A genetic identity (above diagonal) and genetic distance (below diagonal).

SS, Soudano-Sahelian; SG, Soudano-Guinean; WH, Western highlands; RF, Rain forest; Kor, Korean; LB, Lohmann brown; HY, Hybro.
Discussion
A total of 42 alleles ranging from 166 to 494 bp for LEI0258 were detected in this study while allele sizes of 181–552 bp (Fulton et al., Reference Fulton, Juul-Madsen, Ashwell, McCarron, Arthur, O'Sullivan and Taylor2006) and182–539 bp (Chazara, Reference Chazara2010) have been reported.
The absolute number of alleles (42) is greater than 24 alleles reported by Lwelamira et al. (Reference Lwelamira, Kifaro, Gwakisa and Msoffe2008; for Tanzanian chickens) and 29 alleles by Fulton et al. (Reference Fulton, Juul-Madsen, Ashwell, McCarron, Arthur, O'Sullivan and Taylor2006) but smaller than 52 alleles reported on 80 different populations or lines of Africa, Asia and Europe by Chazara (2013). The number of alleles can vary according to sample size, population or breed (HakoTouko et al., Reference HakoTouko, Keambou, Han-Jun, Bembide, Cho, Skilton, Djikeng, Ogugo, Manjeli, Tebug, Zoli and Osama2013). In fact, very few or limited combination of alleles do exist in selected populations. This has been confirmed in inbred, experimental and commercial lines (Juul-Madsen et al., Reference Juul-Madsen, Dalgaard, Salomonsen, Heller, Eterradossi, de Wit, Mundt, Raue and van den Berg2006; Muir et al., Reference Muir, Wong, Zhang, Wang, Groenen, Crooijmans, Megens, Zhang, Okimoto, Vereijken, Jungerius, Albers, Lawley, Delany, MacEachern and Cheng2008) and in this study with 36 LEI0258 alleles in the Western highland chicken ecotype (unselected population). Chazara et al. (2013) reported a higher LEI0258 number of allele (18) in local chicken population of Benin as compared to Cameroon (15) but, lower allele number in local populations of Ghana (14), Ivory Coast (9) and Morocco (10). The same authors reported the lowest LEI0258 allele number in commercial and experimental chicken lines, namely INRA Immune Response 2 (4) and Brown egg layer B (6). The real number ofLEI0258 alleles detected in 290 Cameroon chicken samples might certainly be greater than the 42 observed. In this study, allele sizes relative to an internal size standard were analysed by genotyping. Therefore, same alleles identified in our study may carry different nucleotide sequences while different alleles with small size differences across separate studies may share same sequences.
In this study, the highest genetic diversity parameters observed among local chicken in the Western highlands (agro-ecological zone 3) are in conformity with those of Fotsa et al. (Reference Fotsa, Poné, Bordas, Tixier-Boichard and Rognon2011) and Keambou et al. (Reference Keambou, Hako, Ommeh, Bembide, Ngono, Manjeli, Wamonje, Nzuki, Wanjala, Wamalwa, Cho, Skilton and Djikeng2014) using neutral markers. The highest genetic diversity in zone 3 can be tribute to a wide range of altitudes and climate variants (1–2 alternating dry and raining seasons) (Fotsa et al., Reference Fotsa, Poné, Bordas, Tixier-Boichard and Rognon2011). This zone exhibits the most diversified geographical and agro-ecological characteristics compare to other four zones (Keambou, Reference Keambou2013). Environmental factors are known to be significant on disease outbreaks and severity and then, may also affect the MHC haplotype distribution. The highest diversity of local chicken in the agro-ecological zone 3 is reinforced by the fact that it represents the most important zone as family poultry production is concerned with up to 56 percent of the national native chicken population(Teleu and Ngatchou, Reference Teleu and Ngatchou2006; Keambou et al., Reference Keambou, HakoTouko, Bembide, Ngono and Manjeli2013). As expected, our results are consistent with the highest phenotypic diversity observed in Western highlands than in Rain forest (Fotsa et al., 2008), In Western highlands (Keambou et al., Reference Keambou, Manjeli, Tchoumboue, Teguia and Iroume2007) than in Soudano-Guinean and Soudano-Sahelian zones (Haoua, Reference Haoua2010). In theory, phenotypic characteristics are a combination of genotypic and environmental factors as well as interaction between both (Harlt, Reference Harlt1980). The lowest genetic diversity observed in this study in Soudano-Guinean populations confirms that of Keambou (2014, using neutral markers). It could be attributed to the production system and importance accorded in the area to other domestic animal species like cattle and small ruminants, to the detriment of local chickens kept as small close flocks by women (Haoua, Reference Haoua2010; Keambou et al., Reference Keambou, Hako, Ommeh, Bembide, Ngono, Manjeli, Wamonje, Nzuki, Wanjala, Wamalwa, Cho, Skilton and Djikeng2014).
The clear segregation of within-country ecotypes and crossbreds (Lohmann Brown and Hybro) by the Nei's D A distances can be explain either by a genetic originality or specificity of Cameroon chicken populations or by the fact that Cameroon native chickens are outbred with more allelic combinations than the commercial ones with fewer allelic combinations.
Conclusion
The following findings can be concluded from the present study:
-
• The genetic diversity of Cameroon indigenous chicken as described by previous phenotypic characterization and genetic characterizations studies using neutral markers is confirmed with functional markers, namely LEI0258 and MCW0371 of the MHC-B.
-
• Cameroon native chicken population is clustered in three distinct groups according to agro-ecological zones (ecotypes) and their genetic make-up for LEI0258 and MCW0371 loci. The genetic diversity of the Cameroon native chicken MHC-B is very rich and potential resource for the development of new serological reagent adapted to chicken outbred populations.
Acknowledgements
We gratefully acknowledge the financial support provided to the Biosciences eastern and central Africa Hub at the International Livestock Research Institute (BecA-ILRI Hub) by the Australian Agency for International Development (AusAID) through a partnership between Australia's Commonwealth Scientific and Industrial Research Organisation (CSIRO) and the BecA-ILRIHub; and by the Syngenta Foundation for Sustainable Agriculture (SFSA); the Bill & Melinda Gates Foundation (BMGF); and the Swedish Ministry of Foreign Affairs through the Swedish International Development Agency (Sida), which made this work possible. We sincerely thank the International Foundation for Science (IFS) for providing funding for sample collection and the field work in Cameroon, the association “Symbiose des Compétences pour l'Emploi et le Développement” (SyCED) for providing facilitators on the field for sample collection. Great thanks to my host institution, the University of Dschang and the Faculty of Agronomy and Agricultural Sciences for training, farm and laboratory facilities and especially the staff of the laboratory of Animal Health (LASAN) of the Department of Animal production. Bramwel W Wanjala for reading the manuscript and valuable comments.
Statement of interest
The authors declare that they have no competing interests.