While political scientists have long studied the number of parties in party systems, they have paid less attention to a different, but just as important, variable: electoral volatility. Electoral volatility – the total change in the percentage of seats or votes won or lost by all parties between elections – ranges widely between regions (older democracies in more developed regions tend to have lower volatility than new democracies in developing regions) and within regions (even amongst new democracies in the same region, volatility scores vary significantly). Too much volatility can generate uncertainty for voters, shorten the time horizons of parties and politicians, and force frequent renegotiations of legislative coalitions.Footnote 1 Too little volatility can create permanent winners and losers and give too much ‘slack’ to incumbents.Footnote 2 Important as volatility is to the health of party systems, however, our ideas about the causes of volatility remain underdeveloped. Recent work has advanced our understanding of several factors shaping volatility levels, including the age of the democracy, institutions and institutional change, economic performance, the time period in which the democracy came into being, and social factors such as the salience of class and ethnic divisions.Footnote 3 But much work remains to be done, particularly on the last category of explanation. In spite of a general belief that social factors should affect volatility patterns, this topic remains under-theorized and empirical results have been inconclusive.
I address this void by developing and testing new ideas about the social origins of electoral volatility. Unlike earlier work, which focused on the intensity or salience of social cleavages, I look at the size and configuration – the ‘demographics’– of politically salient social groups. I argue that electoral volatility should be highest in countries where either no group is large enough to form a majority on its own or a majority group contains within itself a second smaller majority group, the presence of which creates a potential co-ordination dilemma for voters who belong to both groups. Moreover, electoral volatility should be lowest in countries where one, and only one, group forms a majority.
I explore the relationship between social demographics and electoral volatility in a large sample of African countries. While my theoretical conjectures apply to electoral volatility in general, for practical reasons I operationalize the concept as legislative seat volatility. I examine legislative volatility rather than executive volatility because of the challenge of comparing presidential and parliamentary systems and the prevalence of two-round majority run-off presidential systems in Africa, and I calculate volatility based on seats rather than votes because of data availability issues. I also conduct robustness checks for a smaller sample of vote volatility scores.
Africa represents an excellent laboratory for exploring the impact of social structure on party systems. Students of African elections agree that ethnicity heavily influences voting and party behaviour in most African countries, generating a homogeneity of cleavage structures that makes it easier to operationalize and test hypotheses about the impact of social structure on party systems. Furthermore, most African countries are presidential and/or have small district magnitudes (often both). Consequently, although African political institutions are not homogeneous, most create strong incentives to seek majorities. Institutional factors that might affect volatility are – to a large extent – held constant for these countries.
In keeping with expectations, I find a strong relationship between legislative seat volatility and ethnic demographics in Africa: legislative seat volatility is lowest when a single ethnic group can form a majority on its own and higher when there are multiple majorities or none at all. My results survive the addition of multiple controls, including the effective number of parties (ENP), which also bears a strong relationship to legislative seat volatility. Moreover, factors found to be significant in other regions (the age of the democracy, economic performance) bear little relationship to volatility in this African sample. Brief case studies of Ghana, South Africa and Benin support the causal logic developed in this article. There are two explanations for the divergence between my results and those of previous studies. First, previous studies suffered from a gap between the theoretical relationships proposed and the actual empirical tests conducted (in particular, social divisions were improperly operationalized). Secondly, my results may attest to the unique power of ethnicity in Africa. In either case, by showing a link between social diversity and volatility in Africa and offering a novel theoretical account for it, this article offers an important contribution to the literature on comparative party systems.
Electoral volatility
The negatives of high electoral volatility are well known.Footnote 4 Mainwaring and Scully include volatility as a key component of institutionalization and suggest that, when volatility is high, ‘democratic politics is more erratic, establishing legitimacy is more difficult, and governing more complicated’.Footnote 5 On the flip side, low electoral volatility can also be a problem, especially when it is symptomatic of the permanent exclusion of one portion of the electorate from power.Footnote 6 In short, too much electoral volatility can be a bad thing, but so can too little.
Electoral volatility varies both across regions and within regions over time. Newer democracies have higher levels of electoral volatility than older democracies in Europe and North America. Bartolini and Mair report low levels of electoral volatility for Western Europe over the 1885–1985 period (the highest average score was France, at 15).Footnote 7 In contrast, Latin America, Eastern Europe and the Former Soviet Union, as well as Africa all had high levels of electoral volatility (typically in the 24–28 range).
The most prominent explanation for these variations holds that volatility is simply a growing pain of democratic consolidation. Parties are weak and have only superficial ties to populations and co-ordination problems are rife because information on party support levels is lacking.Footnote 8 Another explanation, recently put forth by Mainwaring and Zoco, suggests that it is not the age of the democracy but rather the period in which it was born that affects volatility levels.Footnote 9 Democracies that came into being during the early twentieth century, when parties played a more central role in mobilizing voters, formed stronger, less volatile party systems than democracies born later.
Neither the ‘growing pains’ nor the ‘time of birth’ hypotheses explain large variations in volatility levels amongst new democracies, however. Studies by Mainwaring and Scully, Bielasiak, and Kuenzi and Lambright show significant variations in Latin America, Eastern Europe and Africa.Footnote 10 The African countries perhaps display the largest levels of variation, ranging from highly volatile (Madagascar, Niger, Benin and Togo, all above 50) to frozen (Malawi and Mozambique, below 5). The age of the democracy cannot account for these patterns: Africa’s oldest and most stable democracies, born about the same time – Mauritius and Botswana – occupy the top and bottom ends of the distribution. Moreover, the time of birth cannot explain variations amongst new democracies as all of these have come into being at the end of the twentieth century. So what does?
Existing studies have found the greatest support for economic and institutional factors. Roberts and Wibbels find that economic performance affects Latin American volatility, as do several institutional variables.Footnote 11 Tavits explores how institutional and economic factors play out over time as party systems stabilize,Footnote 12 and Mainwaring and Zoco confirm several findings for a large cross-national sample, particularly those related to economic performance and party number.Footnote 13
Building on Lipset and Rokkan, as well as Bartolini and Mair, several of these studies also examine the relationship between volatility and social factors like class and ethnicity.Footnote 14 Most start with the intuition that volatility should be lowest in countries where there are clear, well-defined, politically salient social cleavages that structure politics. Unfortunately, the results of these studies have been inconclusive. Roberts and Wibbels find support, as do Mainwaring and Zoco, for some class-related variables but not others;Footnote 15 Tavits gets results for urban/rural cleavages but not ethnic heterogeneity.Footnote 16 As scholars of party systems from Duverger on have argued for the importance of both institutional and social factors,Footnote 17 these negative findings are surprising and may relate to difficulties in operationalizing concepts. While most studies purport to test the relationship between the salience of social cleavages, they use measures that capture the size and distribution of different groups. Mainwaring and Zoco, for example, use the fraction of the economically active population that works in blue-collar jobs as a proxy for the strength or salience of class divisions.Footnote 18 Yet a country can have a large number of blue-collar workers but not have a strong class division. Similarly, Tavits wants a measure of the salience of ethnic differences, but uses instead an index of ethno-linguistic fractionalization (ELF), which measures the number and size of groups.Footnote 19 Thus, the measures used in previous studies did not match the hypotheses they were testing.Footnote 20
I circumvent these problems by developing new ideas about the social origins of volatility that focus on the size of groups rather than their salience. I also control for salience by looking at a region of the world – sub-Saharan Africa – where one particular type of cleavage (ethnicity) dominates politics in most countries. As my variables more closely fit my theory, my tests improve upon earlier efforts to examine the social origins of volatility.
Social demographics and electoral volatility
Two prior literatures provide insights into the relationship between cleavage structures and electoral volatility: the literature on cabinet stability, and that on co-ordination failure. This section harvests these literatures for new ideas about the relationship between group demographics and volatility.
One of the most persistent findings in the literature on cabinet duration in parliamentary democracies is that majoritarian governments (those formed by a single party with a majority of seats in parliament) are more stable than either coalition or minority governments. The intuition behind this finding is straightforward: governments unified by a single party are less likely to fall apart due to internal bickering than governments formed by multiple parties in coalition. And governments that can count on party discipline to ensure a majority of votes in parliament are less likely to be dissolved via a no-confidence vote than governments that must court the support of other parties to stay in office. Minority parties must also worry about the majority coming together to propose a new government.Footnote 21
This suggests a societal analogy for electoral volatility: societies characterized by a large group that constitutes a majority of the voting population should produce less volatile party systems than societies without such a group. The logic behind this hypothesis is simple: parties that capture the support of a single majority group have little reason to court new support. Furthermore, voters supporting these parties have little reason to abandon ship for a party unlikely to win. Thus, the constituency of these parties should be stable. In contrast, parties supported by a single minority group have incentives to seek additional voters. This is true even if the minority is the largest group in the country: the party must always worry that the majority, although divided into multiple groups and supporting multiple parties, will unite to deprive it of power. Indeed, this incentive for the majority to unite under the banner of a single party is a further source for electoral shifts. Consequently, volatility should be higher in these systems. Volatility should also be higher in situations where a party formed from a coalition of groups captures a majority: groups may squabble over the distribution of benefits and consequently dissolve their partnership, causing support for the party to evaporate.Footnote 22 We might expect systems without a majority group to alternate between uneasy minorities winning a plurality and unstable electoral majorities composed of multiple groups. Societies characterized by a large group that constitutes a winning coalition on its own should, therefore, produce less volatile party systems than societies that do not have such a group. This hypothesis dovetails nicely with recent work that sees group size as pivotal to a variety of political outcomes, including elections.Footnote 23
Though intuitive, this logic must be augmented with an understanding of electoral co-ordination problems. Co-ordination failure occurs when voters with common interests split their support between two or more candidates or parties instead of concentrating them.Footnote 24 The logic of winning coalitions outlined above assumes that voters in the majority group will co-ordinate successfully, focusing all of their support on a single party. Should they prove unable to do this, however, their numerical dominance may fail to translate into electoral stability as voters swing from party to party between elections.
Although there are many sources of co-ordination failure, I focus here on one that derives from group demographics. In particular, if the large group divides into smaller groups, parties may arise to mobilize these smaller groups, and hence split the vote of the larger one. If none of these smaller groups can rule on its own, this kind of co-ordination failure is likely to be short-lived: voters and elites should have a clear focal point for co-ordination (the larger group). But if one of these smaller groups can rule on its own (so there are multiple winning coalitions in the country), co-ordination failure may be more endemic.
When might we see multiple majority groups? This possibility arises when groups nest within one another. Nesting means that large ethnic groups can be divided into several smaller ethnic groups, which can in turn be divided into even smaller ethnic groups, and so on. Furthermore, like Russian matryoshka dolls, the larger groups perfectly contain the smaller ones, so identities do not cross-cut. For example, at the highest level of aggregation, the country of Benin can be divided into southerners (70 per cent) and northerners (30 per cent). Each of these groups can then be broken into sub-groups. The southerners break down into the Fon (around 56 per cent) and the Yoruba-Nagot (around 14 per cent), and these sub-groups divide into a third set of groups (the Gun, the Aizo, etc.).Footnote 25
Nesting is significant because it opens the door for multiple winning coalitions. By definition, if the population of a country can be divided only one way, then only one group can exceed 50 per cent. However, if the population divides multiple ways – as it does when ethnic groups are nested – then multiple groups can exceed 50 per cent. In Benin, there are two winning coalitions: southerners and Fon. Following the logic laid out earlier, Fon voters face a co-ordination problem. On the one hand, they might prefer to go with the smaller winning coalition (the Fon), under the rationale that a smaller coalition means less sharing. On the other hand, the larger winning coalition (southerners) offers more insurance. While recent demographic models assume that voters will opt for the smaller group to minimize sharing,Footnote 26 this is not obvious. Studies of parliamentary cabinets, for example, have suggested that oversized cabinets arise precisely due to the need to include more parties than necessary (to have some insurance in case something goes wrong). It is likely that voters and elites vary in terms of their risk aversion, and therefore some opt to choose the larger safer group, whereas others choose the smaller riskier one. If this occurs, co-ordination failure emerges. In the next election, voters attempt to correct, switching their support in an effort to co-ordinate. Over repeated elections, co-ordination failure induces volatility.
In contrast, South Africa presents a starkly different scenario. South Africa divides into four racial groups at the highest level of aggregation, and none of these groups (including Africans, the largest at 76 per cent of the population) contains a sub-group exceeding 50 per cent of the population. Zulus, an African sub-group, are the largest at 22 per cent. Given this demographic configuration, Africans should face little confusion over how to vote and co-ordination problems should be minimal. Parties might emerge that attempt to divide the African vote along ethnic lines, but they are unlikely to get much support. Hence, volatility should be low in South Africa, but high in Benin.
Both Benin and South Africa can be contrasted with cases like Ghana, where the largest group (the Akan) is only 44 per cent of the population. In these cases, there is no winning coalition. Following the logic laid out earlier, Ghana should exhibit greater volatility than countries with a single winning coalition.
Altogether, the logic of coalition formation, combined with the logic of co-ordination failure, suggests the following expectations: if there is a single winning coalition for the country (a group larger than 50 per cent that cannot be subdivided into another group larger than 50 per cent), we should expect to see stability (the South African example). If there is no winning coalition for the country (no group exceeds 50 per cent), then we should expect volatility (the Ghana example). And if there are multiple winning coalitions (the group larger than 50 per cent can be subdivided into at least one smaller group that is also larger than 50 per cent), then we should also expect to see volatility (the Benin example).Footnote 27
A few caveats should be noted. First, the above logic assumes an institutional structure that creates incentives for coalescence amongst political competitors, i.e. one that rewards parties that achieve majorities. Two types of institutions are likely to create these incentives: small district size and presidentialism (especially when executive and legislative elections are concurrent).Footnote 28 If these institutions are absent, then the logic above may need to be modified because parties may no longer place as much value on achieving a majority.
A second caveat is that voting is based exclusively on group identity. Cross-cutting influences like policy preferences that are not perfectly correlated with group identity must be minimal. Such policy preferences (or preferences based on an alternative identity like class) may split the coherence of groups and make alternative coalitions possible.
Altogether then, we should see electoral stability when there is a single winning coalition, volatility otherwise, conditional on being in an institutional environment that creates incentives to seek majorities and a social environment in which group identity drives voting behaviour to the exclusion of other considerations.
A focus on African ethnic groups
Nothing in the prior analysis assumes that ‘groups’ need to be ethnic groups. Indeed, assuming that group identity is a strong predictor of voting behaviour, many sorts of groups might be relevant to explaining volatility. However, the remainder of this article focuses analysis on a specific type of group (ethno-linguistic) and a particular region of the world (Africa). There are several advantages to studying volatility in the African context.
First, ethnicity is politically relevant in most African countries. In a recent survey of African elections, Nicolas van de Walle notes ‘the low salience of ideology for [African] parties is unmistakable … Ideological differences have been minor across parties, and debates about specific policy issues have been virtually non-existent’. He also contends that ‘election campaigns have been conducted almost entirely on the basis of personal and ethno-regional appeals for support’.Footnote 29 This is not to say that African politics concern only ethnic politics: numerous studies find evidence of performance voting.Footnote 30 Others have noted the significance of rural/urban divisions.Footnote 31 To the extent that performance or urban/rural divisions open up a second or third ‘dimension’ of politics in Africa, the logic discussed earlier may be weakened. However, many of these studies also acknowledge the important role of ethnicity in shaping voting behaviour. Moreover, ethnic considerations may drive performance evaluations in the first place, as when voters give co-ethnic politicians higher performance ratings than those who are not.Footnote 32 Hence, African politics may more closely approximate single dimensionality than other areas of the world, suggesting that the model should fit better in Africa. It also means that cleavage structures are more comparable in Africa than elsewhere, where one country might be divided by region, another by class, another by religion, and so on.
Secondly, the institutional structures of most African countries create strong incentives for politicians to seek majorities. Presidentialism is by far the dominant regime type amongst African democracies: only four multiparty democracies in Africa have parliamentary systems (Botswana, Lesotho, Mauritius and South Africa). Moreover, large district proportional representation is almost as rare in Africa as parliamentarism, being found only in a handful of cases (South Africa, Benin, Namibia and Mozambique are the only ones relevant to this article). Thus, with the exception of South Africa, all African cases to date have either a presidential system, or low district size, or both, with most having both. As a result, there are strong institutional incentives for coalescence in African systems: parties and politicians have every reason to seek an electoral majority. The logic outlined earlier should be highly relevant in Africa – unlike areas of the world where parliamentary structures are combined with proportional representation.
One drawback to focusing on Africa is the quality of its elections. Some observers, like Bratton, have been pessimistic about African elections, citing low turnover rates, declining levels of participation, and high levels of fraud.Footnote 33 Others, like Lindberg, have been more optimistic: when electoral quality is measured systematically using a wide range of indicators and plotted over time, African elections display enormous variation and average quality appears to be improving over time (countries that have managed to have three elections, like most in the sample used here, have reasonably high quality results).Footnote 34 While Lindberg may be too positive (recent elections in Kenya, Nigeria and Zimbabwe indicate that fraud and violence remain very real components of the African electoral context), he is correct to note that electoral quality is a variable, not a constant, in Africa. Consequently, I control for election quality in my specifications.
Data and results
The dependent variable for this analysis is legislative (lower house) seat volatility levels.Footnote 35 I calculate volatility in two ways: first, using the Pederson index;Footnote 36 secondly, using Birch’s index of volatility based on continuous parties.Footnote 37 The Pedersen index is the more standard measure, employed by virtually all previous studies of volatility. However, as it conflates volatility generated by new parties entering the scene with volatility generated by voters moving between existing parties, it is also useful to break the volatility into its constituent parts. This is accomplished by the Birch measure, which looks only at volatility between parties contesting both elections.Footnote 38 I calculate the two measures for all sub-Saharan African countries that have held back-to-back multiparty legislative elections as of the spring of 2007, have not experienced coups or other authoritarian interludes between elections, and are included in Scarritt and Mozaffar’s ethnicity dataset.Footnote 39 This produces a dataset with ninety-five observations of volatility (based on 128 elections) spread over thirty-three countries, most of which come from the post-1990 period. On average, countries had 2.5 volatility scores. The maximum number of volatility scores (8) occurred in Botswana and Mauritius, which also had the earliest volatility scores. The mean Pedersen volatility score for the sample was 26 (similar to Kuenzi and Lambright, who reported a mean score of 28);Footnote 40 the mean Birch score was 18. While the dataset is not particularly large (similar in size to those used in several previous studies of volatility), it is big enough to enable some exploratory statistical analysis.
The key independent variables are demographic: no winning coalition, a single winning coalition, and multiple winning coalitions.Footnote 41 The dataset includes thirteen observations of multiple winning coalitions (from three countries), thirty-three observations of no winning coalitions (from thirteen countries), and forty-nine observations of single winning coalitions (from seventeen countries). In addition, I also included several controls suggested by the literature. To control for the age of the party system, I used the number of periods contained in the dependent variable. Prior studies have found that party systems stabilize over time, and therefore age should dampen volatility. I also included a measure for the average (over the two elections in the volatility score) ENP. Several authors have found this variable to have a significant positive relationship to volatility: the more parties there are, the higher the level of volatility.Footnote 42 I followed Mainwaring and Zoco and included a dummy variable for presidential systems.Footnote 43 And I included a measure of economic growth (the growth rate of per capita income between the first election year and the year before the final election year).Footnote 44 Roberts and Wibbels, Tavits, and Mainwaring and Zoco have all found poor economic growth to correlate with higher volatility levels.Footnote 45
I also included several additional controls. To deal with possible effects of the electoral system (and my use of seat volatility instead of vote volatility), I employed a measure for average district magnitude.Footnote 46 To address concerns over the quality of African elections, I used Freedom House Scores of election quality: 0 indicates that the election was not free; 1 that it was partially free; and 2 that the election was fully free.Footnote 47 And I included a dummy variable that takes the value of 1 if there was a coalition in either the first or second election to control for any effects this might have had.
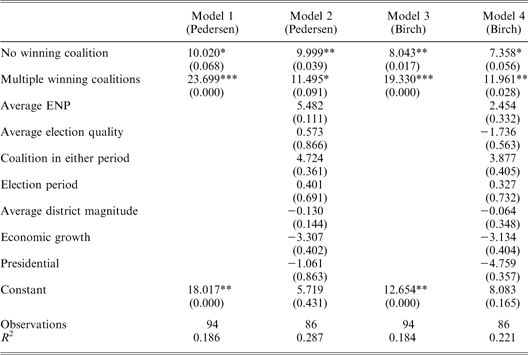
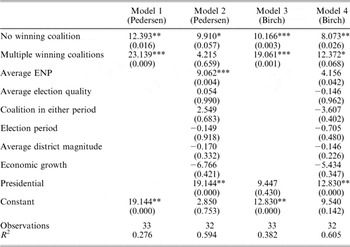
Because the data include repeated observations for several countries, there are two ways to approach statistical analysis: treat each volatility score as an independent observation, pooling observations across time and countries, or average volatility scores for each country to create a single cross-section of data. Each technique has advantages and disadvantages. In utilizing the pooled data, I can better control for factors that affect individual elections and election periods. Furthermore, countries that have had more elections receive higher representation in the sample. Using the data that have not been averaged also produces a larger number of observations, although this can be misleading because there are repeated observations for each country and some of the independent variables are time invariant. In contrast, by using the cross-section, I avoid artificially inflating the number of observations. I also avoid problems of time dependency and country-specific effects that might be present in the larger data. Moreover, averaging the data evens out the effects of idiosyncratic elections. As there are pluses and minuses to each option, I present results from both. Table 1 shows ordinary least squares (OLS) models for the larger pooled sample of unaveraged data. To deal with possible correlation of errors across observations from the same country, I report robust standard errors clustered by country. I dropped the most egregious outlier in the sample (Niger between 1996 and 1999)Footnote 48 and ran several robustness checks.Footnote 49Table 2 shows OLS models for the cross-section of averaged data. In both tables, the dependent variable in the first two columns is the Pedersen index; the second two columns, the Birch index. Models 1 and 3 are bare-bones specifications, including only the demographic variables. Models 2 and 4 include the full set of controls.
Ordinary Least Squares Models of Volatility
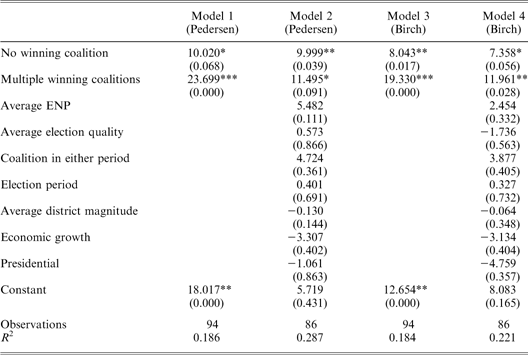
Notes: The sample contains multiple elections per country. Robust p values in parentheses, standard errors clustered by country. * Significant at 10%; ** significant at 5%; *** significant at 1%.
Ordinary Least Squares Models of Volatility, with Elections Averaged by Country

Note: p values in parentheses. * Significant at 10%; ** significant at 5%; *** significant at 1%.
As the results in Tables 1 and 2 make clear, the demographic variables exhibit consistent, strong correlations with electoral volatility. In Table 1 (the pooled sample), the demographic variables are positive and statistically significant across all specifications. Election periods with a single winning coalition (the omitted category) are 4 to 24 points lower on the volatility index than those with either no winning coalition or multiple winning coalitions. Table 2 (the averaged cross-section), shows similar results. The only model in which a demographic variable (multiple winning coalition) is not significant is Model 2 in Table 2 (the Pedersen index, full set of control variables). The coefficients on multiple winning coalitions are generally larger than those on no winning coalitions, but this variable is also more sensitive to the inclusion of control variables, probably because there are fewer observations in the multiple winning coalitions category. It is also more fragile in robustness checks.Footnote 50
The ENP also shows a consistent correlation with volatility. One additional effective party translates into an increase of 2–9 points on the volatility index. Interestingly, the results for ENP were much stronger using the Pedersen data, suggesting that the causal relationship between ENP and volatility does not operate at the voter level (switching between existing parties) but rather as new parties enter and leave politics. Prior work all suggested that more parties meant less ideological space and smaller differences between them, and thus greater shifting by voters and higher volatility.Footnote 51 The strong correlation between ENP and volatility in the African sample – where ideological differences are not pronounced and have little impact on voting behaviour – and the stronger results for the Pedersen index, however, cast doubt on this causal logic. Whatever connects ENP and volatility, it probably does not exclusively or even primarily run through voter responses to ideological differentiation – at least in Africa.
In comparison, the remaining control variables bear little relation to electoral volatility in the African sample. Average district size, presidentialism, the presence of coalitions, and the quality of elections were never significant correlates of volatility.Footnote 52 Time as a democracy also bore no relationship and neither did growth in per capita income. These latter two findings are surprising and contradict results from Latin America and Europe.Footnote 53 The insignificance of democratic endurance on volatility suggests that, while African countries have experimented widely with democracy, they have yet to make progress in the process of consolidation.Footnote 54 In general, the absence of results for the control variables underlines the importance and robustness of the results for the demographic variables and ENP. In this sample of countries, social factors – namely the size and distribution of ethnic groups – are the strongest correlates of volatility.
Three brief case studies
As is evident from the previous section, cross-national analysis shows a strong correlation between group demographics and volatility in Africa. However, statistical analysis of this sort cannot shed light on the causal mechanics of the relationship. To address this concern, I consider three volatility scores that ‘fit the curve’, i.e. demonstrate the correlation between group demographics and volatility revealed in the statistical analysis: Ghana (1996–2000), South Africa (1999–2004) and Benin (1999–2003). Ghana is an example with no winning coalition, South Africa has a single winning coalition, and Benin has multiple winning coalitions. All three cases display the expected relationships (Ghana and Benin had high volatility, South Africa low). All countries were evaluated as partially or fully free at the time of the elections and no country experienced boycotts during the elections. The goal of this analysis is not to establish the correlation – this has been done already – but rather to evaluate the causal mechanics behind the correlation. Do they match the theory proposed earlier? How and in what way?
Ghana 1996–2000
In Ghana, the largest politically salient group, the Akan, represents 44 per cent of the population.Footnote 55 Ghana therefore falls in the ‘no winning coalition’ category and should experience high electoral volatility. Ghana’s volatility score of 23 for the 1996–2000 bears out this expectation, a point not far off the regression line described by the results in Table 1. But does it also conform to the causal logic outlined earlier, i.e. do unstable combinations of ethnic blocs drive volatility?
The 2000 election in Ghana was important because the main opposition party – the New Patriotic Party or NPP – was finally able to wrest control from the incumbent Jerry Rawlings and the National Democratic Congress (NDC), which had ruled in one guise or another for approximately twenty years. In fact, the fates of the NPP and NDC changed dramatically between election periods: in 1996, the NDC took 133 seats to the NPP’s 60, while in 2000, the NPP took 100 seats to the NDC’s 92. As these two parties represented most of the legislature’s 200 seats in both years, shifts between them account almost exclusively for Ghana’s volatility during the 1996 to 2000 period.Footnote 56 Explaining volatility therefore boils down to explaining the reversal in fortune between the NDC and the NPP. Did shifting ethnic blocs have anything to do with it? If so, what?
Many explanations have been offered for the rise of the NPP in 2000 and most have nothing to do with ethnicity. Van Walraven suggests that a faltering economy, corruption scandals, the lack of internal democracy within the NDC, the departure of Rawlings, and the improved campaign skills and resources of the NPP all contributed to the fall of the NDC in 2000.Footnote 57 However, ethnicity also played a role in these elections. Both the NDC and NPP had loyal ethnic clienteles that neither economic woes nor leadership challenges dislodged. During the 1996 and 2000 elections, the NDC won all or almost all seats in Volta, the home region of the Ewe, while the NPP won all or almost all seats in Ashanti, the home region of the Ashanti.Footnote 58 Furthermore, as the Ashanti and Ewe are both minority groups (the Ashanti represent about 28 per cent of the total population, the Ewe 13 per cent), neither party could build a majority based only on its ethnic enclave. In keeping with the logic outlined earlier, both courted support amongst other groups and regions of the country – namely, the non-Ashanti Akan in the central areas and non-Akan in the north. Often these courtship efforts featured explicit attempts to appear multi-ethnic. Nugent writes that ‘each of the parties, both large and small, was at pains to project itself as a party of the entire nation’.Footnote 59 Gyimah-Boadi notes that the NPP ‘worked hard to overcome its image as an Asante-dominated party by electing an ethnically and regionally balanced executive … and by balancing its presidential ticket with a Muslim vice-presidential candidate from the Northern Region, Alhaji Aliu Mahama’.Footnote 60 The NDC also ran a northerner (Martin Amidu) as its vice-presidential candidate and – in spite of its heavy support amongst Ewe – featured an ethnically balanced slate of candidates in which Ewes were ‘if anything … conspicuous by their absence’.Footnote 61 Thus, both parties made attempts to build multi-ethnic electoral coalitions.
Finally, shifts in support patterns in the central and northern regions put the NPP in power in 2000. While the NDC took the majority of seats in the five central and three northern regions of the country in 1996, in 2000 the NPP captured the majority of seats in the central areas and picked up a few seats in the north as well.Footnote 62 The shift was even more dramatic in the presidential election, where the NPP greatly improved its showing in the northern regions.Footnote 63 Hence, the reversal in fortunes between the NDC and NPP resulted from shifting voting patterns in the northern and (especially) the central regions of the country – evidence that suggests that the NPP’s efforts to broaden its electoral base beyond the Ashanti were successful, particularly amongst the non-Ashanti Akan.
In sum, the defection of sizeable numbers of non-Ashanti Akan and non-Akan voters from the NDC to the NPP explains the rise of the NPP in 2000 and Ghana’s high volatility score for the 1996 to 2000 period. This confirms the theoretical expectations presented earlier in this article: parties with ethnic clienteles too small to secure power on their own courted the support of additional groups and the shifting loyalties of these groups produced volatility.
South Africa 1999–2004
South Africa falls in the single winning coalition category: Africans form an easy majority with 76 per cent of the population, while the Zulu (largest sub-group of Africans at 22 per cent) fall well short. Given the theoretical expectations laid out earlier, we would expect Africans to form a stable voting bloc: if they co-ordinate, they capture power with a wide margin. If they splinter, they risk losing everything. And indeed, South Africa’s volatility score of 8 for the 1999–2000 period aligns with this expectation. South Africa therefore fits the overall correlation between demographics and stability. Does it also match the causal story?
South Africa has a fairly concentrated party system (average ENP for 1999 and 2004 was 2). The African National Congress (ANC) won about two-thirds of the votes in both elections. The limited volatility that did exist between 1999 and 2004 was primarily a function of small shifts in support between opposition parties. Explaining low volatility in South Africa therefore boils down to explaining the solidity of ANC support. Is this a function of African bloc voting? In a word: yes. Although scholars debate the causes of racial bloc voting in South Africa,Footnote 64 all agree that Africans have almost uniformly supported the ANC.
Moreover, the (very limited) exceptions to bloc voting themselves prove illuminating. African political entrepreneurs have offered up many alternatives to the ANC, including some that are explicitly ethnic or regional. The most famous of these is the IFP in KwaZulu-Natal, which is built around the politicization of Zulu ethnic identity, but others exist as well (the United Democratic Movement in the Eastern Cape, the United Christian Democratic Party in the North West Province, and several other smaller regional parties). However, none of these bids by elites to fracture the African voting bloc has been especially successful. The IFP captured perhaps half or slightly more than half of the Zulu votes in 1994, but its support has dwindled since then with the decline of violence in KwaZulu-Natal and the co-option of IFP elites by the ANC.Footnote 65 Other regional/ethnic parties have been far less successful.Footnote 66 Thus, while there have been attempts to splinter the ANC’s hold over the African electorate – to ‘de-coordinate’ the African bloc – they have largely failed. Low volatility in South Africa, therefore, represents not so much a lack of elite efforts to introduce new parties but resistance on the part of voters to these efforts.
In sum, the existence of a stable bloc of African voters loyal to the ANC explains South Africa’s low volatility score. Although ethnic differences exist amongst Africans, these have not produced successful challenges to ANC hegemony. Thus, South Africa confirms the logic about the relationship between ethnic demographics and volatility laid out earlier.Footnote 67
Benin 1999–2003
Like many West African countries, Benin contains a prominent north/south split, where the north contains about 30 per cent of the population and the south 70 per cent. If the south were to vote as a bloc, it would easily command a majority and dominate politics. At the same time, nested within the south is a smaller group, the Fon, which also is a majority group.Footnote 68 Moreover, the ‘Fon’ is actually an umbrella grouping of many smaller groups, including one that is also called the Fon.Footnote 69 Thus, Benin offers an example of a multiple winning coalition case. Benin has also had extremely high volatility levels – amongst the highest in the sample. Over three election periods (1991–95, 1995–99 and 1999–2003), its Pedersen score averaged 45 points. In the 1999–2003 period (the focus here), Pedersen volatility was 55. Benin therefore supports the correlation uncovered earlier in this analysis. The question here involves causality: why does Benin experience high volatility in spite of having a majority group? Does volatility arise because of co-ordination failure amongst southern voters? And if there is co-ordination failure in the south, does the nested nature of groups there contribute to it?
Benin’s volatility relates to several factors, one of which involves its institutional design. Benin combines majority run-off presidentialism with proportional representation in the legislature (eighteen districts, eighty-three total seats). The run-off system encourages the proliferation of parties (small parties run in the first round and then barter support in the second) and proportional representation lowers the barriers to entry. As a result, the ENP in Benin was a staggering 6.5 during the 1991–2003 period.Footnote 70 This almost certainly contributed to volatility levels. In 1999, ten parties won seats in the election; in 2004, the number increased to twelve and included several new ones.
Institutional explanations for volatility are limited, however. Many of the parties in 1999 and 2004 were small and exerted little influence over volatility levels. In 1999, four parties controlled 70 per cent of the seats between them (Renaissance Benin (RB), FARD, the PRD and the PSD). None of these four parties were newcomers to legislative elections. In 2004, the same four parties (FARD and PSD now in a formal coalition called the UBF) again controlled about 70 per cent of the seats. Thus, while Benin has a large (and shifting) number of parties, the same set of parties dominated both the 1999 and 2004 elections (and this was true of previous elections as well). Indeed, shifts in support between existing parties represent a more important source of volatility than shifts to new parties. For example, RB won twenty-one (out of eighty-three) seats in 1995, twenty-seven seats in 1999, and fifteen in 2004 – big shifts. Moreover, another important source of volatility between 1999 and 2004 was the decision by FARD and the PSD to enter into a formal coalition under the banner of a new party, the UBF, which took a plurality of seats (and more seats than FARD and PSD combined had taken in 1999). Institutions offer limited explanations for shifts in support between existing parties or the formation and success of coalitions.
Idiosyncratic events and evaluations of performance also account in some part for the varying success of different parties. In 2003, RB lost some of its support due to splits and defections in the two years prior to the election, and some of this support no doubt shifted to the UBF.Footnote 71 Earlier elections saw RB lose support because of disenchantment with its leader (Nicéphore Soglo, who won the presidency in 1991) and concerns about corruption.Footnote 72
However, any explanation of volatility in Benin during the 1999–2003 period (and more generally) would be incomplete without a discussion of the role of ethnicity. Each of Benin’s four major parties is associated with ethnic and regional groups.Footnote 73 FARD (associated with former military dictator Mathieu Kérékou) is a party of the north, winning most of its support in the departments of Atacora and Borgou. The PSD, PRD and RB are all parties of the south. The PSD wins almost all of its votes in the southwest department of Mono, an enclave of the Adja people. The PRD hails from the southeast department of Ouémé, home of the Goun, Nagot, Torri and Ouémé people (all part of the broad Fon grouping). And RB is associated with the Fon located in and around the old Fon Dahomey Kingdom in the central region of the south (now the departments of Zou and Atlantique). The southern electorate is therefore divided, in spite of what would seem to be large incentives to unite into a bloc.
Moreover, the failure of the south to co-ordinate contributes in two important ways to Benin’s volatility. First, while the south is generally divided, it is not consistently divided – as reflected in the fate of the Renaissance Benin party. RB never wins many votes in the north of the country and almost always wins solid support in its home territories (Zou and Atlantique). Its varying success reflects its ability to garner support in non-home regions of the south: in 1999, when it took twenty-seven seats, it clearly won votes outside of Dahomey Fon strongholds; in 2003, when it only took fifteen seats, much of this support had collapsed and it was left only with its core supporters. An important component of Benin’s volatility in 1999–2003, therefore, stemmed from the shrinking ability of the RB to win general southern support.Footnote 74 Secondly, southern divisions contribute to the varying success of ‘northern’ parties. This has certainly been true of the second round of presidential elections; it has also been true in legislative elections, most notably 2003 when the PSD formally aligned with the ‘Kérékiste’ FARD to form the UBF. In sum, the varying degree of division in the south represents an important source of volatility in Benin, confirming part of the theory laid out earlier: Benin lacks the electoral stability of South Africa in part because the southerners of Benin, unlike the Africans of South Africa, have not formed a cohesive, united bloc that sticks together consistently across elections.
Due to the absence of detailed ethnographic or statistical studies of voting and ethnicity in southern Benin, the second component of the theory – how (and if) the peculiar nested structure of the south contributes to co-ordination failure – is more difficult to evaluate. Theory suggests that southern voters should be torn between a general southern voting bloc and a Fon-only voting bloc (where Fon here refers to the broader Fon grouping, not the narrow one centred on the old Dahomey Kingdom). As noted above, southern voters do seem to alternate between voting as a southern-based bloc (i.e. for RB), and voting with smaller, more localized groups. However, it is difficult to know what role (if any) the intermediate group plays in this alternation: are some voters motivated by a pan-Fon identity when they vote RB? Or is their allegiance to the south more general? Nesting seems to matter in explaining the co-ordination problems of southern groups, but precisely how it matters remains opaque.
Therefore, we can confirm some but not all of the causal logic of the theory: volatility in Benin indeed is related to co-ordination failure within the numerically dominant south, and co-ordination failure stems at least in part from the nested nature of the groups there, but precisely how nesting produces co-ordination failure is a question for future research.
Conclusion
Scholars of electoral systems have focused increasing attention of late on electoral volatility, recognizing that extremes in volatility, both at the high and low ends, can present serious complications to the process of democratic consolidation. As one scholar put it, ‘the successful consolidation of democracy requires enough uncertainty to keep losers in the political game, but not so much that elections become a lottery’.Footnote 75 Recent work has documented large variations in volatility levels in emerging democracies all around the world and has developed and tested ideas about how the age of the democracy, the point at which it was founded, its economic performance and its institutions affect these variations. Scholars have also considered the social origins of volatility, working from the long-held intuition that electoral systems reflect both social and institutional factors. Results in this latter endeavour have been weaker, however, perhaps reflecting a mismatch between theories and how they are tested.
This article offers several important innovations over prior work. First, moving beyond traditional theories that focus on the depth and salience of social cleavages, I propose a novel hypothesis about how the size and distribution of groups shape volatility levels. I argue that countries with one, and only one, majority group should have less volatility than countries with no majority group or countries with multiple nested majority groups. Secondly, unlike much previous work, my empirical tests closely match my theoretical concepts. Finally, by focusing on Africa, I am able partially to neutralize competing factors: the nearly uniform centrality of ethnicity to politics in Africa means that the salience and nature of social divisions is comparable across units of analysis; and the pervasiveness of majoritarian institutions reduces the impact of institutional variation on outcomes and increases the validity of my theories.
While the size of the African sample warrants caution, the consistency and strength of the results across statistical models and case studies are nevertheless noteworthy. Africa is both similar to and different from other regions of the world. Like all previous studies, I find a strong correlation between the ENP and volatility – although it is unlikely that the standard explanation for this relationship (policy polarization) explains the correlation in Africa. Unlike previous studies, however, I find no evidence that either growth in per capita income or length of time as a democracy affect African volatility patterns. And, perhaps most importantly (and contrary to previous work), I find that social demographics bear a strong correlation to volatility patterns in Africa. As anticipated by theory, African countries with a single majority ethnic group have systematically lower volatility levels than countries with no majority ethnic group or countries with multiple nested majority groups. Across statistical analysis and case studies, results are particularly robust for the difference between countries with no winning coalition and those with an undivided majority group. These results highlight the value of closely matching theory with empirical work. Furthermore, they also reveal the importance of looking not just at the size of groups,Footnote 76 but also taking into account co-ordination problems within groups: as the case study of Benin demonstrated, being large is helpful in politics only if groups can maintain internal coherence. When splintered (like Benin’s south), dominant groups fail to control politics and generate substantial volatility as coalitions within them form and fail. It is to be hoped that future work will expand on this beginning, studying the many other sources of co-ordination failure in majority groups and how they shape political outcomes.