INTRODUCTION
In intertidal ecosystems organisms are distributed in a particular way, occurring at specific levels along a height axis, from the lower to the upper shore (Underwood, Reference Underwood1981; Araújo et al., Reference Araújo, Bárbara, Sousa-Pinto and Quintito2005; Martins et al., Reference Martins, Thompson, Hawkins, Neto and Jenkins2008). Zonation patterns of macroalgal assemblages in general are recognized to be the result of the effects of biological factors such as competition and grazing as well as physical factors such as wave action, aerial exposure, irradiance, temperature ranges and time available for nutrient exchange (see Lobban & Harrison, Reference Lobban and Harrison1994; Choi & Kim, Reference Choi and Kim2004). The causes underlying the distribution patterns of organisms in intertidal rocky systems have been approached by many authors (see Araújo et al., Reference Araújo, Bárbara, Sousa-Pinto and Quintito2005) and the zonation patterns of the littoral region have been studied all over the world, with comparisons made between sheltered and exposed sites and between different types of substratum (Neto, Reference Neto2000a). In addition, because it is the interface between land and sea, the intertidal experiences environmental pressures from both realms (Simkanin et al., Reference Simkanin, Power, Myers, McGrath, Southward, Mieskowska, Leaper and O'Riordan2005). Several studies have been conducted dealing with seasonal fluctuations of macroalgal assemblages or with temporal changes in abundances of intertidal species (Morgan & Mathieson, Reference Morgan and Mathieson1983; Neto, Reference Neto2000a; Pedersén & Snoeijs, Reference Pedersén and Snoeijs2001). These studies, although laborious and time-consuming, are necessary to compile data of seaweed abundance within a whole year and along several years. These data are very relevant to understand ecological process, detect anthropogenic influence and even demonstrate possible effects of climate change. In fact, in recent years, studies showing the effects of climate change on organisms have become more prevalent within the scientific literature of terrestrial, freshwater and marine ecosystems from the tropics to the poles (Parmesan & Yohe, Reference Parmesan and Yohe2003; Root et al., Reference Root, Price, Hall, Schneider, Rosenzweig and Pounds2003; Simkanin et al., Reference Simkanin, Power, Myers, McGrath, Southward, Mieskowska, Leaper and O'Riordan2005).
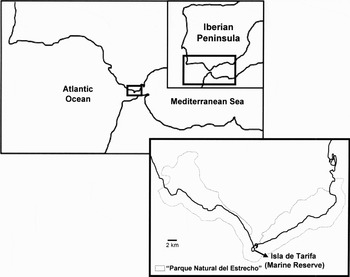
The Strait of Gibraltar is a biogeographical zone in which organisms of the Mediterranean Sea and the Atlantic Ocean, along one axis, and of Europe and Africa along the other, overlap (Guerra-García et al., Reference Guerra-García, Cabezas, Baeza-Rojano, Espinosa and García-Gómez2009). It is a very important geographical–geological region formed in the final phases of the Pliocene period, being the boundary for the Mediterranean region (to the east), the Lusitanian region (to the north-west) and the Mauretanian region (to the south-west). Seaweeds are, in many aspects, ideal organisms for the study of biogeographical patterns on shallow, marine rocky shores: they are ubiquitous primary producers, attached and non-motile, and easy to collect and preserve (Bolton et al., Reference Bolton, Leliaert, De Clerck, Anderson, Stegenga, Engledow and Coppejans2004). The ‘Parque Natural del Estrecho’ (Straits Natural Park) (Figure 1) was declared a protected area in 2003. It is a maritime–terrestrial park along 54 km of coastline in southern Spain and includes highly diverse and structured marine communities (García-Gómez et al., Reference García-Gómez, Corzo, López-Fe, Sánchez-Moyano, Corzo, Rey, Guerra-García and García-Asencio2003). Inside the Park, Tarifa Island is considered as a marine reserve, and constitutes the most interesting enclave of the park regarding the marine habitat (Guerra-García & García-Gómez, Reference Guerra-García and García-Gómez2000). Tarifa Island is the most southern point of Europe, just between the Mediterranean Sea and Atlantic Ocean, with 21 hectares and 2 km of coastline. The unique biogeographical position, together with the substrate heterogeneity and the military access restrictions for a long time, has contributed to maintain very diverse rocky shore intertidal ecosystems. In spite of the importance of knowing the seasonal fluctuations of intertidal algae for adequate programmes of management and conservation in protected areas, there is a lack of these kinds of studies in the Strait of Gibraltar, and other areas of the Iberian Peninsula. Most of the approaches in southern Spain are based on community description on a spatial scale (Guerra-García et al., Reference Guerra-García, Sánchez-Moyano, Corzo, Moreno and García-Gómez2000) and no studies are available dealing with temporal variation of macroalgal biomass along the year.
Study area showing the location of ‘Parque Natural del Estrecho’ in the Strait of Gibraltar.

On the other hand, arthropods, and more specially the crustaceans, have been often used in macrophytobenthic studies to show relationships of predation and competition or to establish the environmental patterns that control the communities (García-Raso, Reference García-Raso1988; Costello & Myers, Reference Costello and Myers1987; Poore, Reference Poore1994; Sánchez-Moyano & García-Gómez, Reference Sánchez-Moyano and García-Gómez1998). Zonation patterns of marine algae and invertebrates, especially mussels, barnacles, snails and limpets, have been intensively studied, while only a few researches have studied the zonation patterns of epibenthic crustaceans in spite of being usually the dominant group of associated macrofauna. Furthermore, there is also a lack of studies dealing with seasonal fluctuations of intertidal crustaceans associated with seaweeds.
For all these reasons, the objective of the present work was to characterize the seasonal fluctuations of intertidal seaweeds and associated crustaceans along two years of study and to explore possible changes in algal biomass and how these changes could affect to the associated community.
MATERIALS AND METHODS
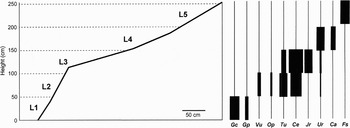
The study was conducted at the most southern point of Tarifa Island (Punta Marroquí, 36°00′00.7″N 5°36′37.5″W) (Figure 1). The height of the intertidal range in this location is 250 cm approximately (Figure 2) and we considered 5 levels to establish the zonation of the intertidal algae (level 1: from zero tidal level to 0.5 m; level 2: 0.5–1 m; level 3: 1–1.5 m; level 4: 1.5–2 m and level 5: 2–2.5 m). A ruler, set square and rope were used to establish the different heights. The first height was the zero tidal level and the process was continued until the vertical height of 2.5 m had been achieved, coinciding with upper limit of the intertidal community (see also Fa et al., Reference Fa, Finlayson, García-Adiego, Sánchez-Moyano and García-Gómez2002; Guerra-García et al., Reference Guerra-García, Maestre, González and García-Gómez2006). In each height, three replicates (quadrats 20 × 20 cm) were sampled. The surface was scraped and all macroalgae and associated fauna were collected. Samples were taken every two months from the different intertidal levels (December 2005 to December 2007). The samples were fixed in ethanol 80%, brought to laboratory and sieved using a mesh size of 0.5 mm. Peracarid crustaceans were sorted and separated in the different groups: Amphipoda (Gammaridea and Caprellidea), Tanaidacea and Isopoda. No cumaceans or mysids were found during the study. The main seaweeds were identified to species level and the volume of each species was estimated as the difference between the initial and final volume when placed into a graduated cylinder with a fixed amount of water (see Pereira et al., Reference Pereira, Lima, Queiroz, Ribeiro and Santos2006; Guerra-García et al., Reference Guerra-García, Cabezas, Baeza-Rojano, Espinosa and García-Gómez2009). The dry weight of each seaweed was also measured (after 24 hours at 70°C), and correlations between volume and dry weight were established. Abundance of crustaceans was expressed in number of individuals per m2. In each sampling, water temperature and salinity were measured using a conductivimeter WTW LF-323.
Schematic diagram of the intertidal selected for the study in Tarifa Island. Representation of the vertical distribution of algal species. Gc, Gelidium corneum; Gp, Gymnogongrus patens; Vu, Valonia utricularis; Op, Osmundea pinnatifida; Tu, turf of Caulacanthus/Gelidium; Ce, Corallina elongata; Jr, Jania rubens; Ur, Ulva rigida; Ca, Chaetomorpha aerea; Fs, Fucus spiralis.

The affinities among stations based on the macroalgal biomass were established through cluster analysis using UPGMA (unweighted pair group method using arithmetic averages) and the Bray–Curtis similarity index. The relationships between crustacean assemblages, represented by total abundances (ind/m2) and macroalgal composition were studied by canonical correspondence analysis (CCA). Multivariate analyses were carried out using the PRIMER package (Clarke & Gorley, Reference Clarke and Gorley2001) and the PC-ORD programme (McCune & Mefford, Reference McCune and Mefford1997).
RESULTS
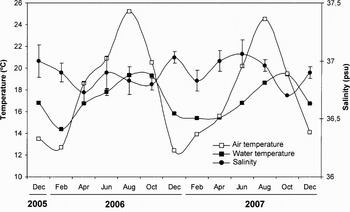
Salinity values were more or less constant (around 37 psu) along the two years of study, while water temperature ranged from 14.4°C (February) and 19.4°C (August and October) (Figure 3). Maximum air temperatures were registered in August, while the maximum of water temperatures were slightly delayed towards October. Both studied years showed a similar trend.
Data (mean ± SD) of salinity, air temperature and water temperature in the study area.

In connection with the spatial patterns of seaweeds along the intertidal, level 1 (0–0.5 m) was dominated by Gelidium corneum (Hudson) J.V. Lamouroux (=G. sesquipedale) and Gymnogongrus patens (Goodenough and Woodward) J. Agardh (Figure 2). The level 2 (0.5–1 m) was mainly constituted by Valonia utricularis (Roth) C. Agardh, Osmundea pinnatifida (Hudson) Stackhouse (=Laurencia pinnatifida) and a turf of Caulacanthus ustulatus (Mertens ex Turner) Kützing and several species of Gelidium. Corallinacea algae (Corallina elongata J. Ellis and Solander and Jania rubens (Linnaeus) J.V. Lamouroux) were dominant in level 3 (1–1.5 m), although C. elongata was also important in level 2. Ulva rigida C. Agardh was present from levels 2 to 4 while Chaetomorpha aerea (Dillwyn) Kützing was restricted to level 4. Fucus spiralis Linnaeus was the only species found in level 5 (Figure 2).
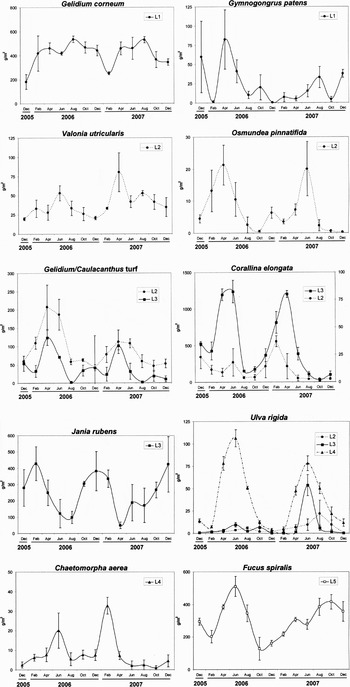
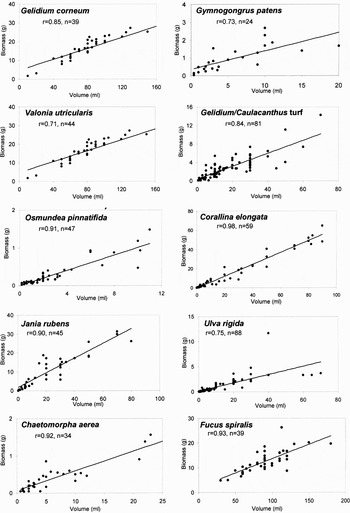
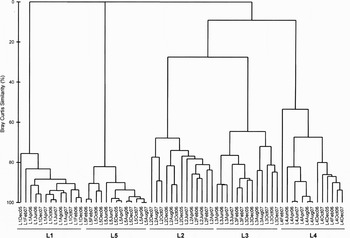
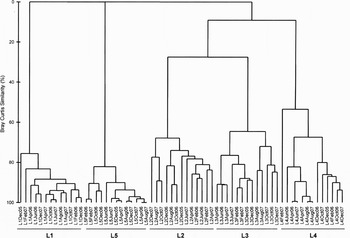
There were conspicuous seasonal fluctuations of biomass in the macroalgal assemblage (Figure 4). Most of species showed higher values of biomass in late spring and beginning of summer. Gelidium corneum and Gymnogongrus patens from level 1 (with the highest influence of sublittoral zone) did not show clear and repeatable seasonal patterns: G. corneum showed highest values of biomass in August and lowest values in December–February, while G. patens showed an irregular behaviour depending on the year. All the dominant seaweeds of level 2 (V. utricularis, O. pinnatifida and Gelidium/Caulacanthus turf) showed peaks of abundance in April–June and minimum values in October–December. Corallina elongata and Jania rubens from the platforms of level 3, showed an opposite behaviour: C. elongata showed biomass higher than 1000 g/m2 in April–June and values lower than 100 g/m2 in August–October–December, while biomass of J. rubens was higher in December–February and lower in April–August (Figure 4). The green algae Ulva rigida increased its biomass during late spring and summer, with maximum values measured in June during the two years. Chaetomorpha aerea showed a similar pattern for the first year, but in the second year the peak was reached in February instead of August. Fucus spiralis, the only species recorded in level 5, also showed a different seasonality depending on the year: during 2006 this algae reached maximum values in June, while maximum biomass was measured in October during the second year (Figure 4). Values of biomass and volume were significantly correlated (P < 0.01) for all the macroalgal species (Figure 5). In spite of the seasonal fluctuations measured for most of the species, the composition of each intertidal level was rather constant along the whole year, as shown by the cluster analysis based on algal biomass at each sampling event every two months from December 2005 to December 2007 (Figure 6). Levels 1 and 5 were the most different from the remaining levels, according to the Bray–Curtis similarity index, while levels 2 and 3 showed a similarity close to 30%.
Seasonal fluctuations of algae biomass (g/m2) in each intertidal seaweed. L, level. Values are mean ± SD.

Correlation plots of biomass/volume for the studied species of microalgae.

Dendrogram resulting from the cluster analysis based on the seaweeds matrix of biomass values.
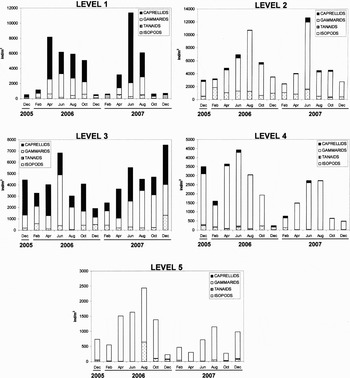
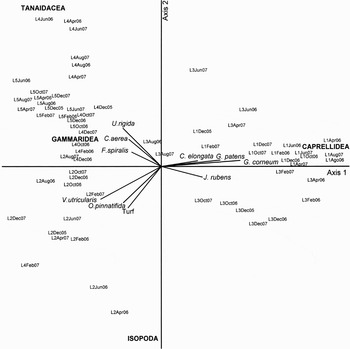
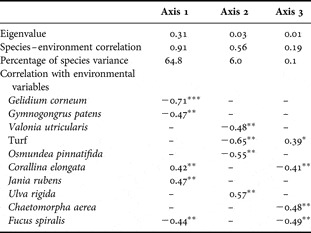
A total of 25,749 crustaceans were collected during the present study from the intertidal of Tarifa Island (15,688 gammarids, the most represented group, 7227 caprellids, 2770 isopods and 64 tanaids). The highest abundances of crustaceans were measured in levels 1, 2 and 3 (Figure 7). Caprellids were the dominant taxa in levels 1 and 3, associated to G. corneum and C. elongata respectively, while gammarids dominated levels 2, 4 and 5. Caprellids were absent in level 5. Isopods were more represented in levels 2 and 3, although they were present in all levels. Tanaids were the less abundant taxa, being more represented in levels 4 and 5. In connection with seasonal fluctuations, patterns were similar in all the intertidal levels: highest densities from April to October (late spring and summer), coinciding with peaks in biomass of most algal species, and lowest densities from December to February (winter). The axis 1 of the CCA analysis absorbed 64.8% of the total variance and correlated mainly with G. corneum (Figure 8; Table 1). This axis separated levels 1 and 3, dominated by caprellids from the remaining levels (2, 4 and 5) dominated by gammarids. The second axis explained only 6% of the total variance and separated level 2, dominated by gammarids and isopods, from levels 4 and 5, also with gammarids being the most important group, but with higher representation of tanaids.
Seasonal fluctuations of crustacean densities (ind/m2) in each intertidal level.

Graph representation of the samplings, crustacean group and seaweeds with respect to the first two axes of the canonical correspondence analysis.

Summary of the results of the canonical correspondence analysis: *P < 0.05; **P < 0.01; ***P < 0.001.

DISCUSSION
The main intertidal seaweeds of Tarifa Island showed a perennial behaviour. The species were present along the whole year, although maximum values of biomass were registered during late spring and beginning of summer for most of algae. This fact probably determined that the associated crustaceans were also present throughout the whole year. This seasonality is likely to be related to cyclic variations in environmental factors such as seawater temperature, day-length and wave action (Neto, Reference Neto2000a). Relationships between these environmental factors and the abundance and seasonality of seaweeds have been widely discussed and it has been reported that the maximum values of biomass and plant length are coincident with summer seawater temperature and longer day-lengths (Soeder & Stengel, Reference Soeder, Stengel, Stewart and Pierce1974; Kautsky & van der Maarel, Reference Kautsky and van der Maarel1990; Neto, Reference Neto2000a). The present study reflects that in Tarifa Island, Strait of Gibraltar, although higher water temperatures are measured by the end of summer, the peaks of algal biomass are measured earlier (from April to June) and many of the dominant seaweeds suffer an important decrease of biomass in August. This is probably due to extremely high air temperatures (occasionally over 40°C) measured during some days of July and August (personal observation), which are surely critical for most of macroalgae. In fact, intertidal seaweeds are periodically exposed to air where they experience a variety of potentially stressful environmental conditions, including nutrient limitation, high temperature, desiccation and osmotic stress (Davison & Pearson, Reference Davison and Pearson1996).
On the other hand, in the 1970s a paradigm emerged that upper limits were set by physical factors and lower limits by biological interactions (Connell, Reference Connell1972). Neto (Reference Neto2000b) during an ecological study of intertidal algal communities in the Azores, found that at the upper levels of the intertidal, the higher values of biomass were recorded in winter, when the wave action was higher and the air temperature lower, and the contrary was observed at the lower levels, with higher biomass in summer. This could explain the higher values measured during winter 2007 for Fucus spiralis, located in the higher level of the study area in Tarifa Island. In the Mediterranean waters of the Iberian Peninsula, peaks of algal biomass have been measured also in late spring (Sala & Boudouresque, 1997), as in the present study for most of algal species. On the north-west coast of the Yellow Sea, Zhuang et al. (Reference Zhuang, Chen, Zhang and Cao2004) reported that macroalgal biomass peaked in August, while the species diversity peaked in April. Neto (Reference Neto2000a) measured higher biomass of Ulva rigida in summer months. Ballesteros (Reference Ballesteros1988) found that Corallina elongata from the subtidal levels at the Mediterranean coast of Spain showed its maximum biomass peak towards winter instead of spring–summer as measured in the present study for intertidal C. elongata from the Strait of Gibraltar. This is probably related with physical factors affecting the intertidal (mainly dessication in summer, winter storms, higher temperature range between winter and summer, etc.) which affect differently the subtidal area. Gelidium corneum, the other of the dominant algae of the present study together with C. elongata, is usually related to unpolluted areas, with low sediment loading and high exposure levels, and can be considered good indicator of undisturbed habitats (Gorostiaga et al., Reference Gorostiaga, Santolaria, Secilla and Diez1998; Díez et al., Reference Díez, Secilla, Santolaria and Gorostiaga1999, Reference Díez, Santolaria and Gorostiaga2003). In fact, Tarifa Island, differently from other strongly anthropogenic areas of southern Spain, has been maintained in an excellent state of conservation. Anadón & Fernández (Reference Anadón and Fernández1986) measured higher biomass in spring–summer for this species on the northern coasts of the Iberian Peninsula, similarly to the results obtained in the present study. Gelidium corneum is the main raw material used for agar production in Morocco and the industrial exploitation of this alga is an important part of the economy of this country; however the species is in danger of being overexploited (Mouradi-Givernaud et al., Reference Mouradi-Givernaud, Hassani, Givernaud, Lemoine and Benharbet1999; Zidane et al., Reference Zidane, Orbi, Sqalli, Zidane, Talbaoui, Hasnaoui and Fakhaoui2006). Probably, the collections of these algae for industrial purposes should be conducted in summer months, when algae are more developed, although their presence is maintained along the whole year.
Seasonal fluctuations of crustaceans were, in general terms, coincident with seasonality of seaweeds, having higher biomass from April to August. However, in spite of the important biomass decrease of level 3 algae (mainly due to Corallina elongata) in summer because of the high temperatures, crustacean densities maintained values above 2000 ind/m2. On the other hand, Gelidium corneum at level 1 maintained a similar biomass throughout all the year (200–500 g/m2 approximately) and crustacean associated, mainly caprellids, showed important fluctuations with more than 5000 ind/m2 in April–October and less than 500 ind/m2 in December–February. These patterns indicate that crustacean density in the intertidal is not only influenced by distribution and abundance of algae as substrate, but also by external factors, such as hydrodynamism, oxygen, weather conditions, competition or predation, including the particular population dynamics for each species. Probably, the level 1, very close to the subtidal, is more exposed to wave action, and is more sensitive to winter storms, affecting negatively the associated crustaceans, which reduces its density during winter period. Oppositely, crustaceans from level 3 were able to maintain high densities in the platforms of Corallina elongata. Level 3 is not so affected by waves during winter storms. Prathep et al. (Reference Prathep, Marrs and Norton2003), during a study of spatial and temporal variations in sediment accumulation in an algal turf and their impact on associated fauna, found that most organisms were most strongly influenced by sediment accumulation and temporal changes in the turf plants. In the present study Corallina elongata and Jania rubens, the dominant species which shared niche at platforms of intermediate levels, showed an opposite behaviour, probably to avoid competence: C. elongata showed higher biomass in April–June and lower values in August–October–December, while biomass of J. rubens was higher in December–February and lower in April–August. Probably, this particular trend of J. rubens, with different peaks of biomass than most of other seaweed, also positively contributed to maintain high densities of crustaceans in level 3 throughout the whole year, even when C. elongata biomass decreased.
Collecting data over a series of years is rare in ecological literature because it is time-consuming, costly and often not possible (Simkanin et al., Reference Simkanin, Power, Myers, McGrath, Southward, Mieskowska, Leaper and O'Riordan2005). However, knowledge of seasonal fluctuations of seaweeds and associated macrofauna is essential for future monitoring, conservation and for making reliable management decisions, especially in protected areas such as Tarifa Island in the Strait of Gibraltar. The present study constitutes the first baseline approach to the seasonal fluctuations of biomass of the main seaweed at the Strait of Gibraltar, a most interesting biogeographical area between the Mediterranean Sea and the Atlantic Ocean.
ACKNOWLEDGEMENTS
Financial support of this work was provided by the Ministerio de Educación y Ciencia (Project CGL2007-60044/BOS) co-financed by FEDER funds, and by the Consejería de Innovación, Ciencia y Empresa and Junta de Andalucía (Project P07-RNM-02524). Special thanks to the directors of the Parque Natural del Estrecho (Jesús Cabello and Esther Gordo) and to the Comandancia General de la Guardia Civil for providing authorizations and facilitating access to the marine reserve Isla de Tarifa. M. Corzo (Consejería de Medio Ambiente and Junta de Andalucía) kindly provided the data for air temperature measured at the study site. Thanks are also due to M.M. López, M.J. Jiménez, D. Vázquez, I. Pacios, A. García, D. González and J.J. Díaz for assistance in the field and laboratory.