Introduction
Anelaphus villosus (Fabricius) and A. parallelus (Newman) (Coleoptera: Cerambycidae: Cerambycinae: Elaphidiini) are relatively common species of longhorned beetles that inhabit forests of eastern North America, south to Florida and west to Texas, United States of America (Yanega Reference Yanega1996; Bousquet et al. Reference Bousquet, Laplante, Hammond and Langor2017). Adult and larval habits of both species remain poorly described (Gosling Reference Gosling1981; Skiles Reference Skiles1985; Solomon Reference Solomon1995). Although one authority indicated A. villosus and A. parallelus were “notoriously difficult to distinguish” (Lingafelter Reference Lingafelter2007), another stated they were “readily separated” based on external morphology (Skiles Reference Skiles1985). Consistently and accurately distinguishing these two species is important in order to apply ecological knowledge of each to practical and theoretical questions. Anelaphus parallelus, in particular, is considered a pest in some plantation settings (Solomon Reference Solomon1995) but has also contributed to understanding twig-pruning behaviour (Brown and Dombroskie Reference Brown and Dombroskie2019).
Linsley (Reference Linsley1963, pp. 91–92) summarised existing literature and listed several qualitative aspects of physical appearance for A. villosus and A. parallelus. Observed, but not necessarily distinguishing, traits for A. villosus included (1) antennomere 3 distinctly longer than antennomere 4, (2) antennomere 3 subequal to antennomere 5, (3) antennomere 11 longer than antennomere 10, (4) pronotum not longer than broad, and (5) elytra slightly more than three times longer than broad. For A. parallelus, respective observations from Linsley (Reference Linsley1963) included (1) antennomere 3 subequal to antennomere 4, (2) antennomere 5 longer than antennomere 3, (3) antennomere 11 longer than antennomere 10, (4) pronotum usually longer than broad, and (5) elytra over three times as long as broad. Skiles (Reference Skiles1985) revised the taxonomy of certain species of Anelaphus and indicated A. villosus and A. parallelus were readily separated by the more slender form of A. parallelus, and he contraindicated Linsley (Reference Linsley1963) by stating that elytra were no more than three times as long as broad in A. villosus.
Neither Linsley (Reference Linsley1963) nor Skiles (Reference Skiles1985) provided quantitative observations of the traits they described. Qualitative descriptors, such as antennomere 3 being “distinctly longer than” antennomere 4 (Linsley Reference Linsley1963), coupled with definitive statements, such as elytra “no more than three times as long as broad in villosus” (Skiles Reference Skiles1985), make species determinations challenging if antennomere 3 is longer than antennomere 4 but perhaps not “distinctly” so or if the elytra are barely more than three times as long as broad in the same individual. With no sample sizes, no measurement data, and no indication of variability provided, it is difficult to assess the viability of universally applying species names to unknown specimens based on these characters. Even so, the Linsley (Reference Linsley1963) descriptions of antennomere 10 and antennomere 11 were similar for both species, and his descriptions of proportions of the elytra length and width were also indistinguishable. Gosling (Reference Gosling1978) and Bousquet et al. (Reference Bousquet, Laplante, Hammond and Langor2017) indicated that the shape of the pronotum cannot be reliably used to separate these species. Remaining potentially diagnostic traits listed in Linsley (Reference Linsley1963) include relative lengths of antennomere 3 and antennomere 4 and relative lengths of antennomere 3 and antennomere 5. The potential of antennomere 3 and antennomere 5 to distinguish these species was not considered nor discussed in subsequent literature. In practice, qualitative differences in the relative lengths of antennomere 3 and antennomere 4 are used to separate A. villosus from A. parallelus (Skiles Reference Skiles1985; Lingafelter Reference Lingafelter2007; Bousquet et al. Reference Bousquet, Laplante, Hammond and Langor2017). The accuracy of this approach, however, has remained untested.
Taxonomic placement of A. villosus and A. parallelus has been dynamic since they were described, and Lingafelter (Reference Lingafelter2020) recently hypothesised that these two species should be synonymised because “there were no morphological features that consistently allowed for discrimination among these taxa” (Lingafelter Reference Lingafelter2020, p. 16). In addition, Lingafelter (Reference Lingafelter2020) could not distinguish the holotype of Stenocorus villosus Fabricius (referred to here as A. villosus) from the syntype of Elaphidion parallelum (Newman) (referred to here as A. parallelus) based on natural history, proportions of elytra length and width, pronotum length and width, or relative lengths of antennomere 3 and antennomere 4 visually assessed from photographs of the type specimens. Lingafelter (Reference Lingafelter2020) also synonymised other species under A. villosus, but these and other changes to Anelaphus taxonomy hypothesised in that work are not covered here.
We acknowledge that the revised taxonomy of Lingafelter (Reference Lingafelter2020) should be followed here. In this recent taxonomic hypothesis, the former A. parallelus is referred to as A. villosus, and the former A. villosus no longer exists. In order to reduce confusion with these recent name changes in the context of our work, we are following the species concepts of Yanega (Reference Yanega1996), Lingafelter (Reference Lingafelter2007), and Bousquet et al. (Reference Bousquet, Laplante, Hammond and Langor2017) for A. villosus and A. parallelus here. These species concepts need to be confirmed by studying the type series for both of these names and all of their synonyms.
Analysis of molecular data may help to resolve taxonomic concepts of A. villosus and A. parallelus, but no such analysis was considered by Lingafelter (Reference Lingafelter2020) before synonymy. Several authors have submitted genetic sequence information for A. villosus and A. parallelus to the public GenBank (www.ncbi.nlm.nih.gov/genbank) or Barcode of Life Data System (BOLD) (www.boldsystems.org) databases following formal submission criteria. Once deposited, DNA sequence data from unknown specimens can be compared to these reference materials, and the nearest match, based on a similarity statistic, is returned (Meikeljohn et al. Reference Meikeljohn, Damaso and Robertson2019). Intuitively, species or taxonomies determined and described based on morphological criteria should align with molecular criteria, and vice versa.
Despite contradicting statements from authorities regarding the ease of distinguishing A. villosus from A. parallelus, no study provided evidence of the diagnostic capabilities of any trait nor provided an accuracy assessment for a preferred method of assigning species names to individuals: we do not know how well any method of assignment works. Direct comparisons of determinations made with DNA barcoding and those made with morphological traits could not be located.
Here, we measured a sample of determined, curated specimens of A. villosus and A. parallelus contained in the Cornell University (Ithaca, New York, United States of America) insect collection and additional samples collected and determined by the primary author. Some specimens from Cornell University and the primary author were also determined with DNA barcoding of the CO1 gene. Assuming correct species determinations, we evaluated the ability of discriminant functions to accurately distinguish individuals of A. villosus from A. parallelus based on relative differences in the lengths of antennomere 3 and antennomere 4, the trait generally agreed to suit this purpose (Linsley Reference Linsley1963; Gosling Reference Gosling1978; Skiles Reference Skiles1985; Lingafelter Reference Lingafelter2007; Bousquet et al. Reference Bousquet, Laplante, Hammond and Langor2017). Likewise, the utility of antennomere 3 and antennomere 5 (Linsley Reference Linsley1963) for distinguishing these species was evaluated. Additional morphological traits potentially useful in separating A. villosus and A. parallelus were identified from stepwise discriminant analyses. We evaluated the use of discriminant functions generated from these analyses to accurately assign individuals in our sample to A. villosus or A. parallelus. Species assignments from applications of discriminant functions based on morphology were compared with assignments from DNA barcoding.
Methods
DNA extraction, amplification, and sequencing
Anelaphus villosus and A. parallelus specimens used for DNA extractions were from the Cornell University insect collection (n = 2 from central New York state, one collected in 1983, and the other in 2002) or collected within 50 km of Penn Yan, New York between 2012 and 2018 (n = 48; see Brown et al. Reference Brown, Zuefle, Brundage and Cursino2019). Extraction of DNA from leg muscle tissue from each of 50 specimens was carried out using the Nucleospin Tissue Kit (Macherey-Nagel, Düren, Germany), following the manufacturer’s instructions. The universal primer pairs LCO1490/HCO2198 (Folmer et al. Reference Folmer, Black, Hoeh, Lutz and Vrijenhoek1994) were used to amplify the barcode region of the cytochrome oxidase subunit 1 gene (CO1-5P). All endpoint polymerase chain reaction amplification reactions were conducted in the Thermal Cycler GeneAmp PCR System 2700 (Applied Biosystems, Darmstadt, Germany) using the GoTaq Master Mix Kit (Promega, Madison, Wisconsin, United States of America). Thermocycling conditions of the endpoint polymerase chain reaction included an initial denaturation at 94 °C (5 minutes), followed by 35 cycles at 94 °C (denaturation, 45 seconds), 51 °C (annealing, 40 seconds), 72 °C (extension, 45 seconds), and a final extension step at 72 °C (5 minutes). Negative (polymerase chain reaction water substitution) and positive controls were included for each round of reactions. Five microLitres of the amplified products were verified for size conformity by electrophoresis in a 1% agarose gel stained with GelRed (Biotium, Harvard, California, United States of America) and using a GelPilot Mid Range Ladder (QIAGEN, Germantown, Maryland, United States of America) as a DNA standard. The remaining polymerase chain reaction product was purified with Wizard SV Gel and PCR Cleanup System (Promega, Madison, Wisconsin, United States of America). Purified polymerase chain reaction products were independently Sanger-sequenced at the Cornell University Institute of Biotechnology Genomics facility (Ithaca, New York, United States of America) with the same primers used in endpoint polymerase chain reaction. Sequences were manually edited and assembled into a consensus sequence using MEGA 7 (Kumar et al. Reference Kumar, Stecher and Tamura2016). All consensus sequences were cross-checked with records in the National Center for Biotechnology Information GenBank and Barcode of Life DataSystems (BOLD) using the basic local alignment search tool (Altschul et al. Reference Altschul, Gish, Miller, Myers and Lipman1990) and identification tools in BOLD software (Ratnasingham and Hebert Reference Ratnasingham and Hebert2013) to search for similar DNA sequences in the databases and to determine their taxonomic identities.
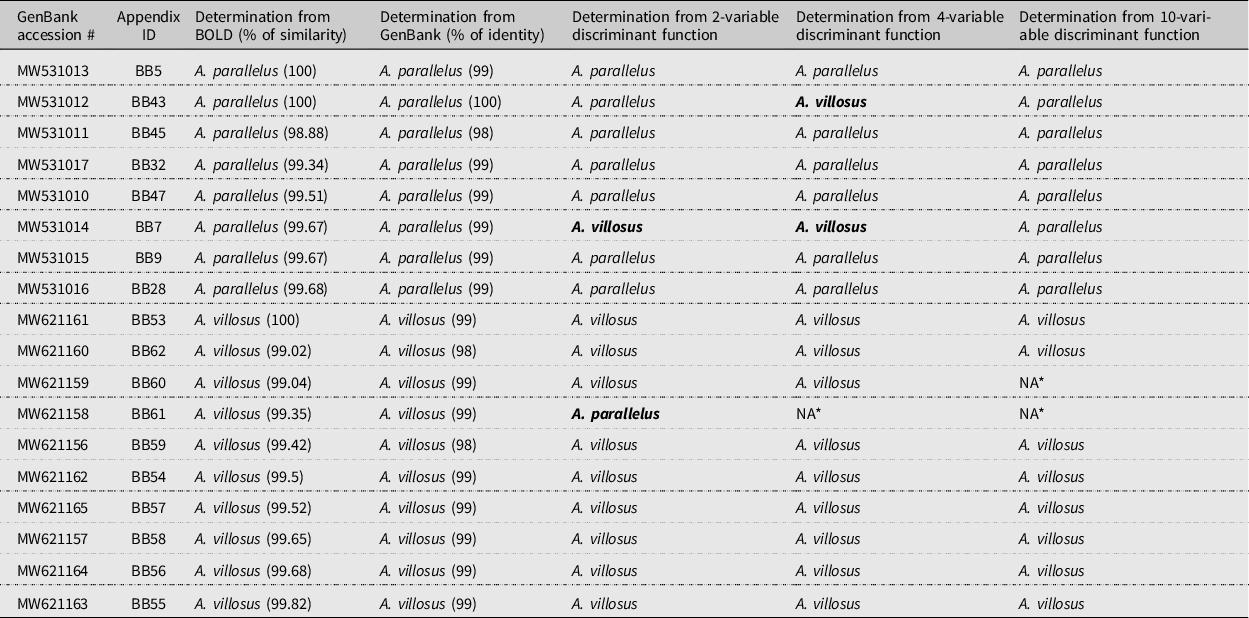
Only specimens with at least a 98 “per cent of similarity” statistic in the BOLD database or at least a 98 “per cent identity” statistic in GenBank (Meikeljohn et al. Reference Meikeljohn, Damaso and Robertson2019) were considered to be accurately identified. Accession numbers for A. parallelus and A. villosus sequences deposited in Genbank are included in Table 1 and are cross referenced with measurements of individual specimens contained in the Supplementary material.
Comparisons of DNA barcoding species determinations and discriminant function determinations of the same specimens of Anelaphus parallelus and A. villosus. The percentage of similarity index (BOLD) and percentage of identity (GenBank) statistics are noted in parentheses. Determinations based on two-variable, four-variable, and 10-variable discriminant functions are provided; determinations in bold font do not match molecular determinations.
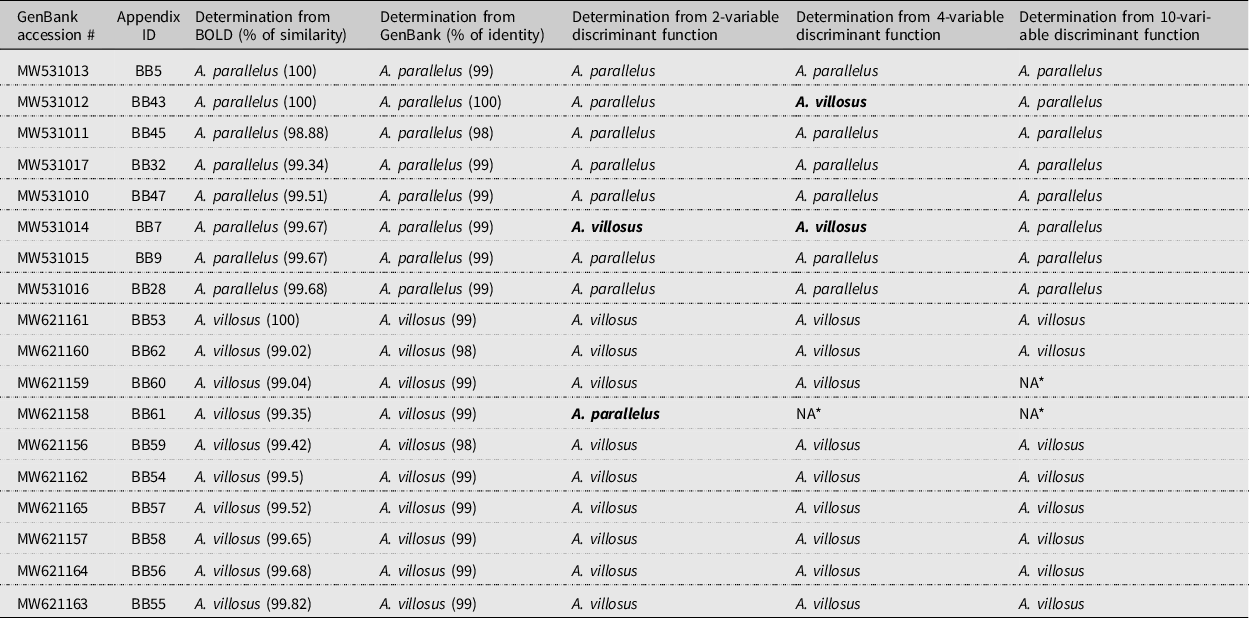
* antennae incomplete.
Samples and measurements
Measurements were collected from curated, determined specimens of A. villosus (n = 40) from the Cornell University insect collection. Intact individuals, nearly all from New York, Pennsylvania, and New Jersey (see Supplementary material), were haphazardly selected from the collections. Ten additional specimens were collected by the primary author between 2016 and 2020 near Penn Yan, New York and determined to be A. villosus with DNA barcoding (n = 50 total A. villosus). Measurements were collected from eight specimens of A. parallelus from the Cornell University collections, 44 additional specimens were collected and determined by the primary author near Penn Yan, New York between 2010 and 2018 (see Brown et al. Reference Brown, Zuefle and Dombroskie2016; Brown and Dombroskie Reference Brown and Dombroskie2019), and eight specimens were collected in the same location and time period determined to be A. parallelus with DNA barcoding (n = 60 total A. parallelus). Voucher specimens are available from the Cornell University Insect Collection (https://cuic.entomology.cornell.edu).
Ocular measurements of each specimen, including those determined with DNA barcoding, were taken through a dissecting microscope at 10.5 × magnification (all measurements except antennomeres) or 45 × magnification (all antennomeres): overall length, head width, elytron length, elytra width, length and width of the pronotum, length of the metafemur, scape width at the broadest point, and lengths of antennomeres 1 through 11, inclusive. Ocular measurements were converted to millimetres and presented to one decimal place. Antenna length, antenna length/body length, antennomere 3/antennomere 4, and elytra length/elytra width were determined from these measurements. It was not possible to measure all characters on every specimen because some characters were either missing or blocked from view.
Statistical analysis
A discriminant function determines the linear combination of morphological variables that best distinguishes taxa (Fisher Reference Fisher1936; Rao Reference Rao1973). There are previous applications of discriminant functions to distinguish arthropod species (Goodwin et al. Reference Goodwin, Valentine and Odell1982; Klimov et al. Reference Klimov, Lekveisishvili, Dowling and Oconnor2004; Hammond and Williams Reference Hammond and Williams2011), but no study, to our knowledge, provided an accuracy assessment of their findings.
Because of the nearly universal application of antennomere 3/antennomere 4 to distinguish A. villosus and A. parallelus (Skiles Reference Skiles1985; Lingafelter Reference Lingafelter2007; Bousquet et al. Reference Bousquet, Laplante, Hammond and Langor2017), discriminant functions based on (1) antennomere 3/antennomere 4 as one variable and (2) the lengths of antennomere 3 and antennomere 4 as two distinct variables were evaluated towards that end. Discriminant functions could not be used to assess the ability of distinguishing species if antennomere 3 was distinctly longer than antennomere 4, because it was not clear how to quantify “distinctly longer”. Antennomere 3 and antennomere 5, listed as potentially diagnostic (Linsley Reference Linsley1963), were also included in discriminant functions as two distinct variables. Additionally, all 23 morphological variables, four of which were a combination of other variables, were entered into stepwise discriminant functions to determine if any variables or linear combinations of variables were useful to distinguish A. villosus and A. parallelus. A significance of P ≤ 0.05 was required for variable retention. Cross-validation (Lachenbruch and Mickey Reference Lachenbruch and Mickey1968) was used to assess correctness of discriminant functions determined from retained variables in distinguishing A. villosus and A. parallelus. Cross-validation considers a sample of n – 1 as the training set. Discriminant functions are then used to assign or classify the one observation not included in the training set (SAS Institute 2014).
The posterior probability of species assignment was also determined for each specimen based on smoothed error-rate estimates (Glick Reference Glick1978; SAS Institute 2014). For each specimen, correct species assignment – assuming that each specimen in the samples was initially identified correctly – with a posterior probability of at least 0.95 was required for an accurate identification. “Accurate identification” is used in this context. Even if discriminant functions subsequently assigned a determined specimen to the correct species, such assignment was not considered accurate unless the associated posterior probability was at least 0.95. Only accurate assignments, as defined here, are reported in Results.
Results
Eighteen of 50 specimens were identified with DNA barcoding as A. parallelus (n = 8) or A. villosus (n = 10) with at least 98% similarity statistics for the BOLD or GenBank databases (Table 1). No DNA was obtained from specimens collected from 2014 or earlier (n = 18), and no DNA, or DNA of insufficient quality or quantity to produce a match in GenBank or BOLD that met our criteria, was obtained from 14 of 32 specimens collected after 2016. No DNA sample submitted for identification returned ambiguous matches (Table 1).
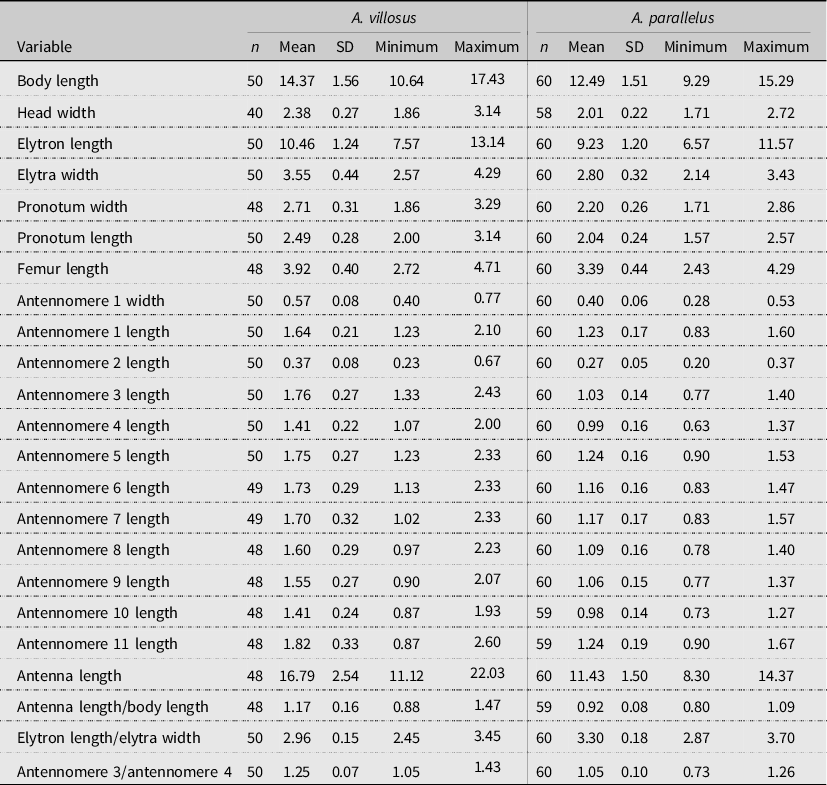
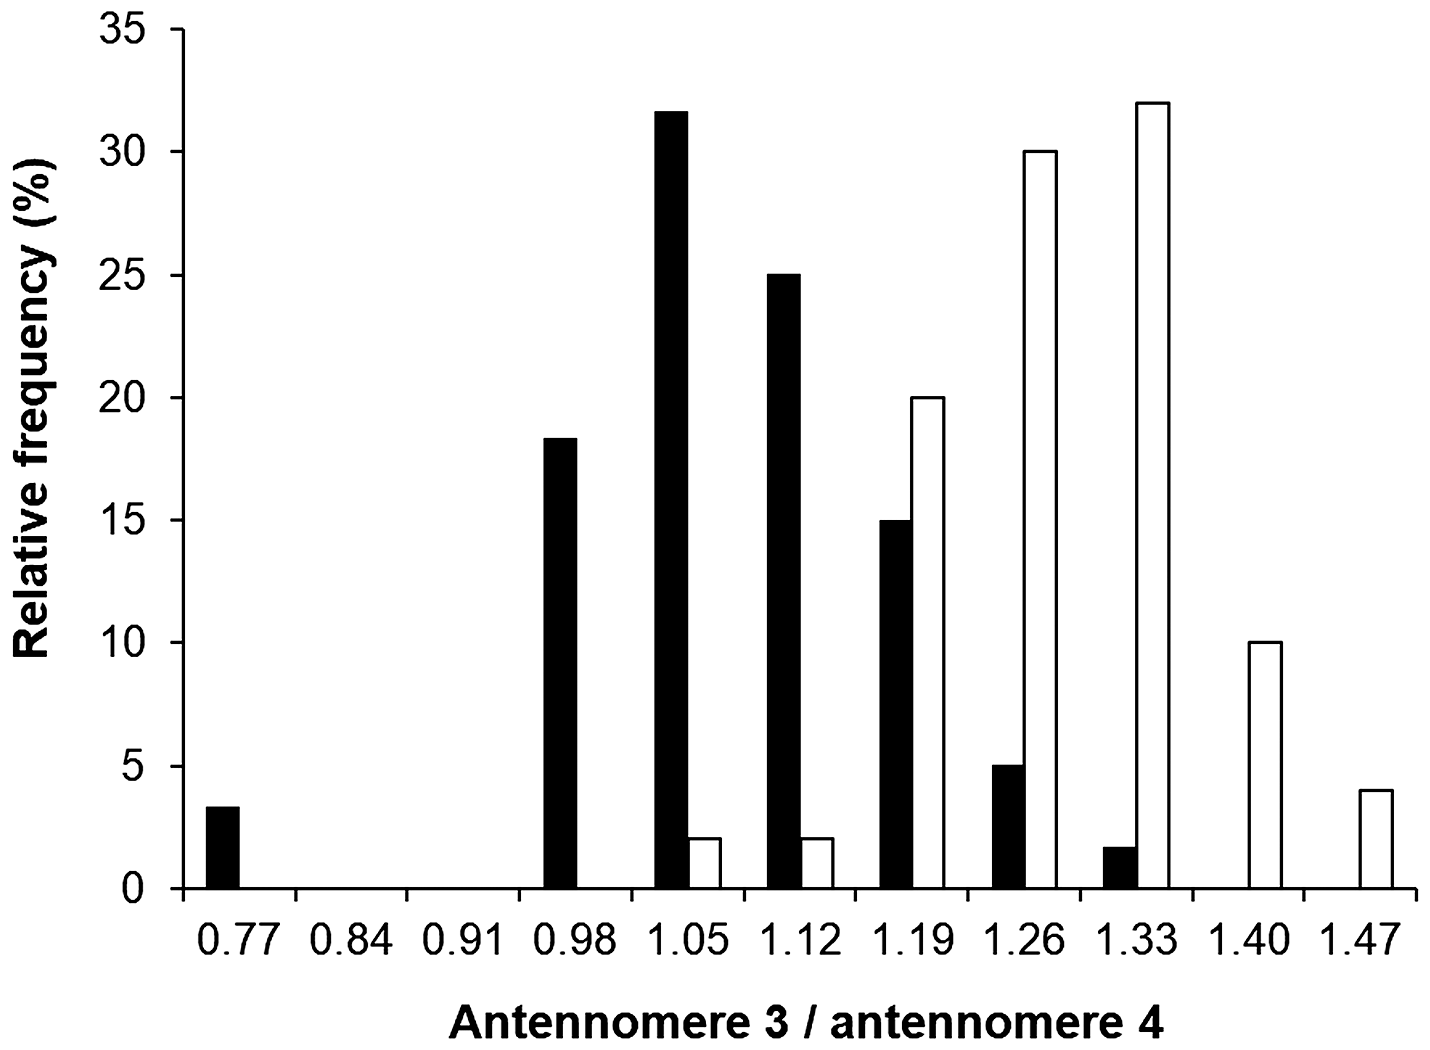
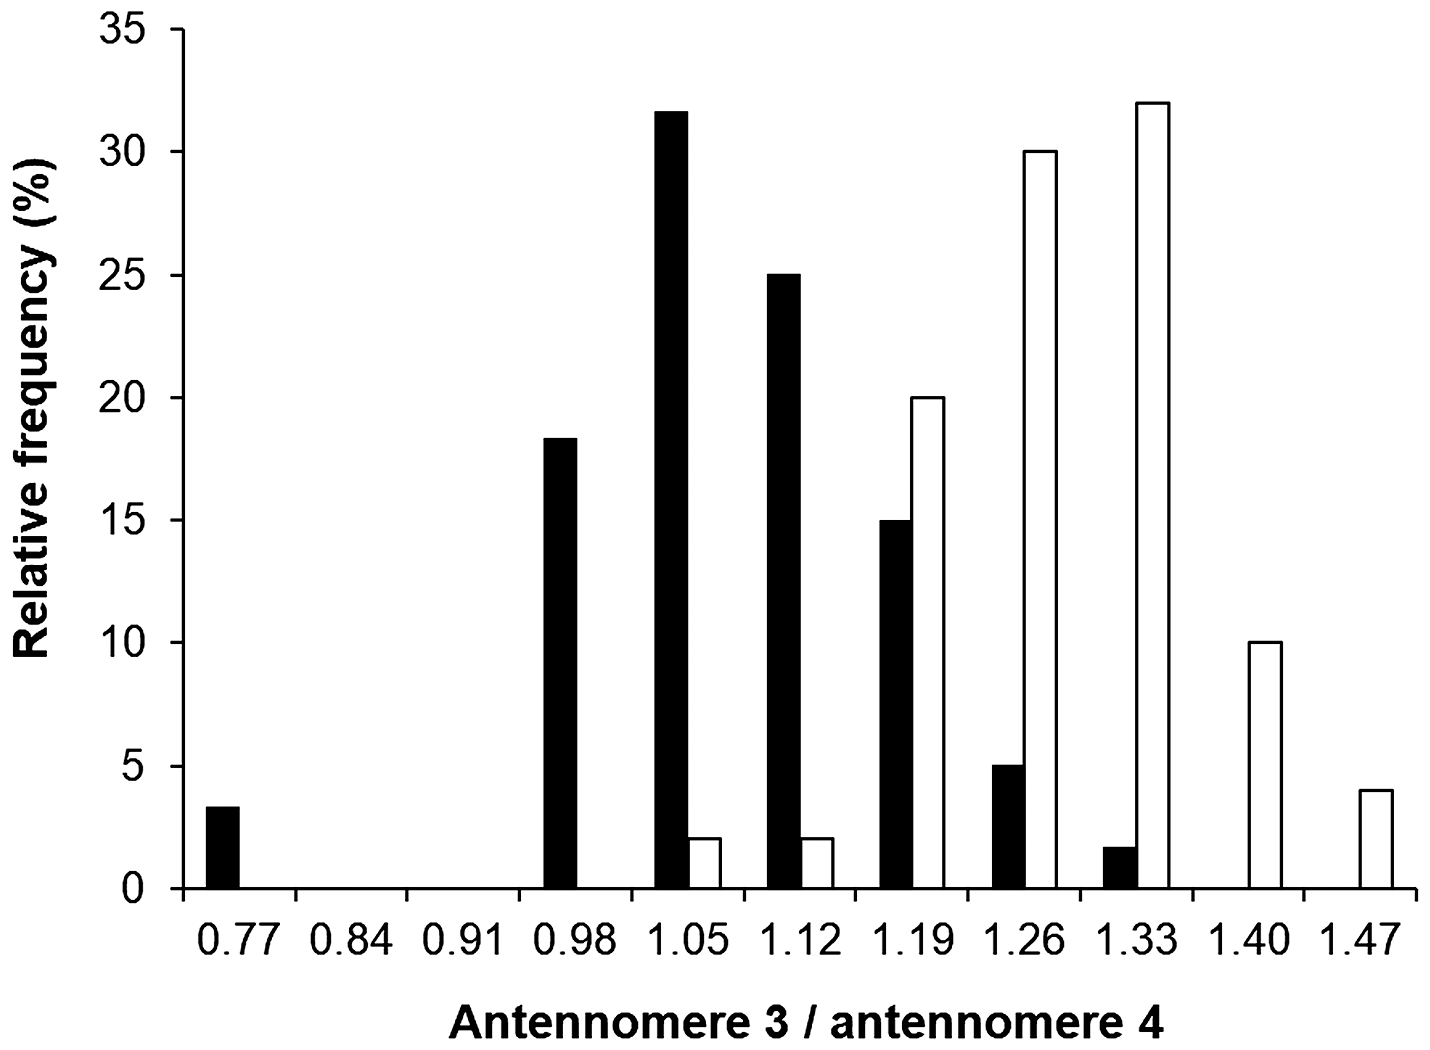
Average measurements and variability statistics from determined specimens of A. villosus and A. parallelus are provided in Table 2, and measurements of individual specimens are provided in the Supplementary material. Values of antennomere 3/antennomere 4 varied within and between species and exhibited overlapping ranges (Fig. 1). The average of antennomere 3/antennomere 4, the trait most commonly used to distinguish A. villosus from A. parallelus, was 1.25 in A. villosus and 1.05 in A. parallelus, with a 98% prediction interval of (1.07, 1.42) and (0.81, 1.28), respectively. Prediction intervals represent a range of possible values associated with an individual, rather than an average response, at a specified level of confidence and are therefore wider than confidence intervals used to indicate a range of average responses (Neter et al. Reference Neter, Kutner, Nachtsheim and Wasserman1996). Based on prediction intervals, if antennomere 3/antennomere 4 is greater than 1.28, the specimen of concern is A. villosus with 99% confidence. If antennomere 3/antennomere 4 is less than 1.07, the specimen of concern is A. parallelus with 99% confidence. Using these cut-off values, 15 of 50 (30%) of A. villosus specimens and 32 of 60 (53%) of A. parallelus specimens could be determined with 99% confidence based on antennomere 3/antennomere 4.
Measurements (mm) of determined specimens of Anelaphus villosus and a. parallelus. SD, standard deviation.
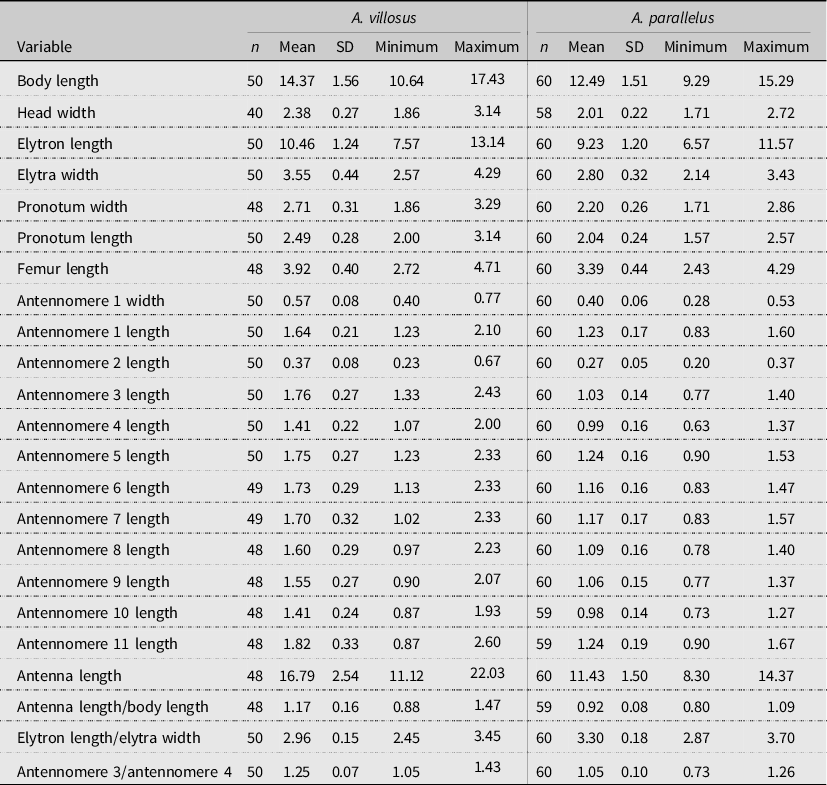
Relative frequencies of the length of antennomere 3/antennomere 4 for Anelaphus villosus (n = 50; open bars) and A. parallelus (n = 60; filled bars).
Sex of individual A. parallelus was determined with the methods of Brown et al. (Reference Brown, Zuefle, Brundage and Cursino2019), and there were no obvious sex-specific differences among A. parallelus specimens in antennomere 3/antennomere 4 values. Eighteen of the 32 A. parallelus with antennomere 3/antennomere 4 values less than 1.07 were female and 14 were male. Similar methods for distinguishing the sexes of A. villosus were not available. Sexing methods for A. villosus provided in Bousquet et al. (Reference Bousquet, Laplante, Hammond and Langor2017) could not be consistently applied.
On average, length of elytra were 3.0 times longer than broad in A. villosus, but 35% of the specimens had elytra that were more than three times longer than broad (Supplementary material). Length of elytra averaged 3.3 times longer than broad in A. parallelus (Table 2), but in 5% of individuals, elytra were less than three times longer than broad (Supplementary material). Elytra length/elytra width was not useful by itself in distinguishing A. villosus from A. parallelus but, as given below, this variable was included in useful discriminant functions.
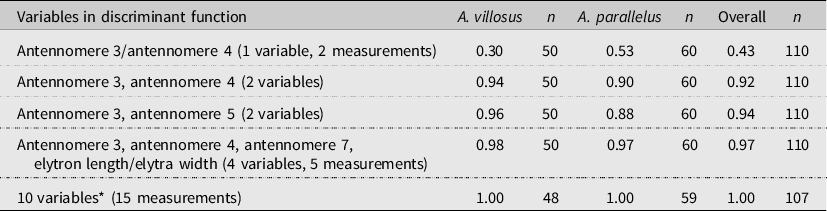
Discriminant functions that included antennomere 3/antennomere 4 as one variable accurately predicted species identity for 30% of A. villosus specimens and 53% of A. parallelus specimens (Table 3), similar to results for prediction intervals. (Accuracy, as defined in the Methods, requires both a correct species assignment and at least a 95% posterior probability of correct assignment for each specimen.) Discriminant functions that included antennomere 3 and antennomere 4 as two variables, however, accurately predicted species membership of 94% of A. villosus individuals and 90% of A. parallelus individuals in the sample, including specimens determined with DNA barcoding (Table 3). To use these discriminant functions, enter the same measurements into each of the following equations. The species associated with the equation that yields the greatest value is assigned to the specimen in question.
 $A. \ villosus\!: - 35.2 + (37.0 \times \rm antennomere \ 3) + (3.8 \times \rm antennomere \ 4)$
 $A. \ parallelus\!: - 13.8 + (7.5 \times \rm antennomere \ 3) + (20.2 \times \rm antennomere \ 4)$
Variables used in discriminant function analyses, the number of measurements required to determine those variables, and the proportion of each species accurately identified with discriminant functions based on those variables. Accuracy is defined as both correct species assignment and posterior probabilities of correct assignment of at least 95%.
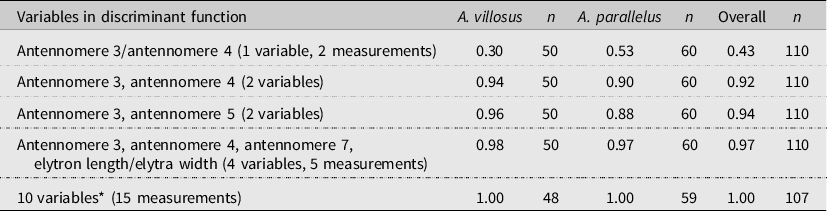
* Width of antennomere 1, lengths of antennomere 2, antennomere 3, antennomere 6, antennomere 9, and antennomere 11, elytron length, elytron length/elytron width, antenna length, and antenna length/body length.
Discriminant functions using antennomere 3 and antennomere 5, described by Linsley (Reference Linsley1963) as potentially diagnostic, resulted in a similar level of accuracy in species assignments as antennomere 3 and antennomere 4 (Table 3). These functions are as follows:
 $A. \ villosus\!: - 35.7 + (28.5 \times \rm antennomere \ 3) + (12.2 \times antennomere \ 5)$
 $A. \ parallelus\!: - 16.7 - (9.1\times \rm antennomere \ 3) + (34.5 \times antennomere \ 5)$
Based on a stepwise discriminant analysis that evaluated all 23 morphological variables, discriminant functions based on four variables determined with five measurements (lengths of antennomere 3, antennomere 4, and antennomere 7, and elytra length/elytra width) achieved greater than 97% accuracy in predicting species membership for all individuals in the sample (Table 3):
 \begin{align*}A. \ villosus\!: &- 199.8 + (88.7 \times \rm antennomere \ 3) - (36.0 \times antennomere \ 4)\\& - (20.1 \times antennomere \ 7) + (110.8 \times [elytra \ length/elytra \ width])\end{align*}
 \begin{align*}A. \ parallelus\!: &- 208.9 + (48.8 \times \rm antennomere \ 3) - (27.1 \times antennomere \ 4)\\& - (5.6 \times antennomere \ 7) + (121.5 \times [elytra\ length/elytra \ width])\end{align*}
Discriminant functions based on 10 variables (width of antennomere 1, lengths of antennomere 2, antennomere 3, antennomere 6, antennomere 9, and antennomere 11, elytron length, elytron length/elytra width, antenna length, and antenna length/body length) determined with 15 measurements predicted species membership for every specimen of both species with greater than 99% accuracy (Table 3). The discriminant functions associated with these 10 variables are as follows:
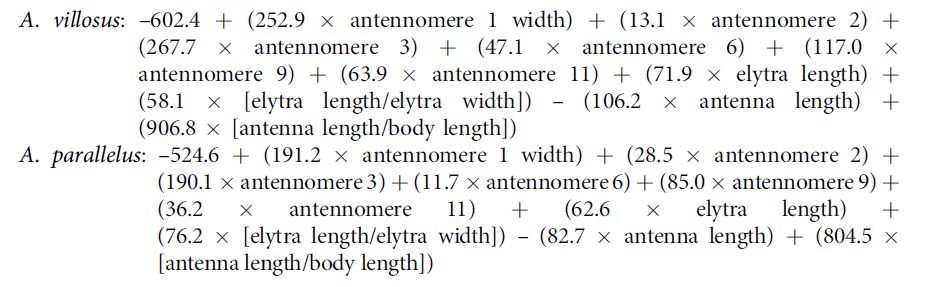
Species assignments determined with the discriminant function based on antennomere 3 and antennomere 4 matched the species assignment from DNA barcoding in 16 of 18 cases (89%; Table 1). Species assignments based on the four-variable discriminant function matched assignments from DNA barcoding in 15 of 17 cases (88%; Table 1), and species assignments based on the 10-variable discriminant function matched assignments from DNA barcoding in 16 of 16 cases (Table 1).
Discussion
Anelaphus villosus and A. parallelus were recently synonymised because neither individual specimens nor type specimens could be distinguished by differences of morphology. Traits used to justify synonymy included indistinguishable proportions of the lengths and widths of the pronotum and elytra and indistinguishable relative lengths of antennomere 3 and antennomere 4 (Lingafelter Reference Lingafelter2020).
Two studies published before this new taxonomic hypothesis reported that proportions of the length and width of the pronotum could not be used to reliably separate A. villosus from A. parallelus (Gosling Reference Gosling1978; Bousquet et al. Reference Bousquet, Laplante, Hammond and Langor2017). Skiles (Reference Skiles1985, p. 306), who revised the taxonomy of certain species of Anelaphus, did not indicate A. villosus and A. parallelus could be distinguished by any aspect of the pronotum. Regarding proportions of elytra length and width, Linsley (Reference Linsley1963, pp. 91–92) indicated elytra were slightly more than three times longer than broad for A. villosus and more than three times as long as broad in A. parallelus. Without further quantification, these were equivalent descriptions. Skiles (Reference Skiles1985, p. 306), however, indicated that elytra were no more than three times as long as broad in A. villosus but agreed with the Linsley (Reference Linsley1963) description for A. parallelus. Gosling (Reference Gosling1978, p. 3) stated only that A. parallelus was “usually more slender” than A. villosus. Lingafelter (Reference Lingafelter2007) did not use proportions of elytra to separate A. villosus from A. parallelus in his key to cerambycids of the eastern United States of America. Disagreement among authorities in the proportion of elytra length and width between these two species, as well as the general lack of use of this proportion to distinguish between them, implies it is not suited for diagnostic purposes. Proportions of elytra length and width were not diagnostic in this study, either.
The only trait examined by Lingafelter (Reference Lingafelter2020) in his taxonomic revision that authorities, including Linsley (Reference Linsley1963), Gosling (Reference Gosling1978), Skiles (Reference Skiles1985), Lingafelter (Reference Lingafelter2007), and Bousquet et al. (Reference Bousquet, Laplante, Hammond and Langor2017), agreed was useful for distinguishing A. villosus from A. parallelus was that antennomere 3 was distinctly longer than antennomere 4 in A. villosus. Lingafelter (Reference Lingafelter2020) found that photographs of type specimens of A. villosus and A. parallelus could not be differentiated using proportions of the elytra, proportions of the pronotum, or relative lengths of antennomere 3 and antennomere 4 (Lingafelter Reference Lingafelter2020, pp. 18–19). The discrepancy between Lingafelter’s Reference Lingafelter2007 and Reference Lingafelter2020 studies regarding the ability of relative lengths of antennomere 3 and antennomere 4 to distinguish A. villosus and A. parallelus was not addressed. Relative lengths of antennomere 3 and antennomere 4 were not provided for A. parallelus in the revised taxonomy because “the ratio of antennomeres cannot be determined due to their orientation in the photograph, but it does not appear significantly distinctive” from that of A. villosus (Lingafelter Reference Lingafelter2020, p. 19).
In our study, antennomere 3/antennomere 4 averaged 1.25 (standard deviation = 0.07; range: 1.05–1.43) for A. villosus, and for A. parallelus, it averaged 1.05 (standard deviation = 0.08; range: 0.73–1.26). Respective averages for Canadian specimens were 1.28 (range: 1.19–1.35) and 1.02 (range: 0.99–1.09; Bousquet et al. Reference Bousquet, Laplante, Hammond and Langor2017), but sample sizes and standard deviations were not reported. No other measurements that included an indication of variability could be located for these species. Nearly all of the A. parallelus measured in this study (52 of 60) were reared from larvae and identified by the host plant, including living oak (Quercus spp. Linnaeus) (Fagaceae), hickory (Carya spp. Nuttall) (Juglandaceae), or black walnut (Juglans nigra Linnaeus) (Juglandaceae) (Gosling Reference Gosling1978, Reference Gosling1981), the form of the pruning cut (Gosling Reference Gosling1978), and inspection of adult material. Specimens of A. villosus and A. parallelus contained in the Cornell University insect collections – and likely most other collections – were collected as adults. Distinguishing the two species relied on strict criteria, such as “elytra more than three times as long as broad” in A. parallelus (Skiles Reference Skiles1985), and poorly defined criteria, such as “third antennal segment distinctly longer than fourth” in A. villosus (Lingafelter Reference Lingafelter2007). Specimens determined with these criteria may be correctly identified, but measurements from these specimens are not likely to represent the range of measurements that occur within each of these species: specimens of questionable identity based on inconclusive criteria are not likely to be included in collections as determined specimens. Collection specimens, therefore, may not represent the range of natural measurement variability.
If the assumption that correctly determined specimens were included in discriminant analyses here is accepted, the widely used criteria for distinguishing A. villosus from A. parallelus in the eastern United States of America – that antennomere 3 is distinctly longer than antennomere 4 (Lingafelter Reference Lingafelter2007) – is not viable for two reasons: (1) it is not clear what is meant by “distinctly longer”, and (2) discriminant functions based on antennomere 3/antennomere 4, which did not rely on “distinctly longer”, did not distinguish the species well. About 30% of A. villosus and 53% of A. parallelus were accurately determined based on antennomere 3/antennomere 4. Cut-off values for antennomere 3/antennomere 4 provided here (see Results) distinguished a subset of the two species with 99% confidence, but this approach was not useful for all specimens. If antennomere 3 and antennomere 4 are considered as two variables in discriminant functions, however, accurate determinations were achieved for 90% or more of specimens (see Table 2). This level of accuracy may be useful in some field situations, but we recommend at least a 95% level of accuracy, as defined here, before methodology used to separate taxa is adopted.
When more variables were used in discriminant functions, greater levels of accuracy in distinguishing A. villosus from A. parallelus were achieved here. Four variables based on five measurements resulted in greater than 97% accuracy in species assignments, and 10 variables based on 15 measurements resulted in the correct assignment of all specimens with greater than 99% accuracy. Although collecting many measurements from a specimen may be time consuming, the overall process is not challenging, the methods are repeatable and yield consistent results, and the accuracy of results is quantified. There is no comparable quantification produced from species descriptions, taxonomic keys, or identification guides. A reasonable expectation of these taxonomic products is that the methods used to define or discern species are robust and accurate and that evidence of such is reported; evidence, including an assessment of accuracy, is nearly universally lacking. Morphological criteria for distinguishing species should also be compared with molecular data, which are becoming more widely available. Although the example presented here for distinguishing A. villosus and A. parallelus – species that closely resemble each other – may not be conclusive, it is an example of where such an integrated approach is most needed.
Given past challenges of distinguishing A. villosus and A. parallelus, it was not possible to verify that the determined specimens used in this study were authoritative. Although there is general concern that the use of DNA to determine species membership among closely related species or among species that closely resemble each other may be fraught because of possible confusion among reference materials in DNA databases (Meikeljohn et al. Reference Meikeljohn, Damaso and Robertson2019), no nucleotide sequence submitted for identification here returned ambiguous matches. Misidentification using the discriminant functions presented here is also a possibility due to the potential for confusion between “determined” specimens, but – as with DNA databases – these functions returned identifications consistent with existing determinations. If necessary, correcting species assignments in DNA databases, as well as adjusting discriminant functions to accommodate any revised specimen determinations, will result in improved accuracy and usability of these identification tools.
We found that mid-Atlantic specimens of A. villosus and A. parallelus, as well as a few specimens included from other parts of their range (see Supplementary material), were readily and accurately distinguished based on both morphology and DNA. Nonetheless, if type specimens cannot be distinguished (Lingafelter Reference Lingafelter2020), it remains a possibility that A. villosus and A. parallelus are conspecific. If so, A. villosus would be the valid name for the oak twig pruner formerly known as A. parallelus (Lingafelter Reference Lingafelter2020). If it is verified that type specimens are identical and that the evidence presented here indicating that A. villosus and A. parallelus are separate species is accepted, then a new or modified species description for the previous A. villosus (sensu Lingafelter Reference Lingafelter2020) is in order.
Life history traits of A. villosus and A. parallelus remain poorly described and largely follow the descriptions of Gosling (Reference Gosling1978, Reference Gosling1981). Gosling (Reference Gosling1981) indicated that A. parallelus attacked small, living oaks and other hardwoods, whereas A. villosus oviposited on dead host plants and was more “cosmopolitan” in its choice of hosts. Lingafelter (Reference Lingafelter2020) was critical of separating these two species based on biological differences that might not extend across the range of these taxa, stating, “Gosling’s contention that biological differences imply species differences is strongly challenged in the ecological and population genetics literature” (p. 18). Gosling (Reference Gosling1981), however, also recognised temporal differences in adult activity periods, with A. villosus active from mid through late June in Michigan and A. parallelus active earlier, from late May to early June. Gosling (Reference Gosling1981) stated that “it is not known if differences in host selection serve to isolate adults while mating, but their difference in emergence period undoubtedly provides effective temporal isolation between these sympatric and presumably closely related species” (p. 180).
Based on life history descriptions of host tree use and pruning behaviours, previous studies suggested A. villosus, A. parallelus, and currently unrecognised species may form a species complex (MacRae Reference MacRae1993; Bousquet et al. Reference Bousquet, Laplante, Hammond and Langor2017). Because samples of each species collected in this study could be distinguished with high accuracy based on morphology and DNA barcoding, the suggestion of a species complex, at least for the mid-Atlantic region of the United States of America portion of the range of these species, is not supported here. A greater understanding of the ecology of each species, including life history and range delineations, remains needed.
Supplementary material
To view supplementary material for this article, please visit https://doi.org/10.4039/tce.2021.34.
Acknowledgements
Two anonymous reviewers and the subject editor, Andrew Smith, provided thorough, valuable criticisms of this work. Annika Brown, Melina Brown, and Marion Zuefle helped collect pruned twigs. Jason Dombroskie provided access to the Cornell University insect collections. Jesse Brundage provided DNA for positive controls. Author Robert Salerno was supported by a Field Period Scholarship from Keuka College.