1. Introduction
Nearly two-thirds of all economic activity in the G-20 – and over three-quarters in France, the USA, and the UK – is made up of services. So it is striking that while goods exports account for nearly 20% of the G-20's combined GDP, the corresponding figure for services is less than 5%.Footnote 1 Although services trade was growing rapidly prior to the full onset of the Global Financial Crisis crisis – by 19% in 2007, according to the WTO – it still represents a surprisingly modest share of the international economy (WTO, 2009).
The question, of course, is: why? It is tempting to argue that a large part of the services sector is non-tradable. This is becoming less true over time, however. The traditional example of a haircut is instructive. In today's economy, a haircut is tradable in a number of ways. When a Paris stylist flies to Los Angeles to work on an American movie set, there is trade in services under GATS Mode IV. When an American salon chain opens a store in Europe or Japan, sales by its foreign affiliate are considered to be trade in services under GATS Mode III. So although some services are traded in only small quantities relative to domestic production, it is not because they are strictly speaking non-tradable. Rather, it is only under special circumstances that they can be profitably traded.
More generally, this analysis suggests that a large part of the explanation for why services trade is so much smaller in value than goods trade must lie in trade costs, i.e. the full range of costs a firm confronts when it decides to sell its services overseas. In goods markets, these costs include tariffs, non-tariff measures, transport charges, costs imposed by ‘behind-the-border’ regulatory measures, and costs related to geographical, cultural, and institutional differences. In services sectors, trade costs are largely related to regulatory measures that either create entry barriers or increase the cost burdens facing firms, in addition to geographical, cultural, and institutional differences.
Some sources of trade costs are relatively easy to quantify. Ad valorem tariffs are an example. However, many trade costs in both goods and services stem from regulatory measures, and thus are much more difficult to quantify. Previous attempts at quantification of the barriers to trade in services have either inferred trade costs in an ad hoc way from observed trade flows, or have constructed inventories of regulatory measures and summarized them in index form (see Dee, Reference Dee2003 for a review). Although both approaches have made it possible to obtain a basic idea of the nature and extent of trade costs in services, the academic and policy communities are still far from an understanding of international services markets comparable to that of goods markets.
This paper provides some of the first systematic evidence on the level of trade costs in services markets, focusing on the level of international trade costs (between countries) relative to domestic trade costs (within countries).Footnote 2 We find that they are very high compared with goods, perhaps twice or three times as high in ad valorem terms. This difference goes part of the way towards explaining why goods trade still dominates services trade so strongly in the global economy.
We also find that trade costs in goods and services change very differently over time. During the last decade, overall trade costs in goods markets have fallen by nearly 15% on a worldwide basis. But in services, they have remained essentially stable. In some sectors, such as construction, they have even increased markedly. Among major trading economies, the only exception to this rule is China: partly as a result of signing a WTO Accession Agreement with real ‘bite’ in services, trade costs in services between China and the rest of the world have fallen noticeably. Unilateral liberalization and the efforts of the private sector have also contributed to this outcome. This finding suggests an important role for external commitment mechanisms in supporting trade facilitation in services. The contrast with the currently lackluster progress of the WTO's services negotiations – which could clearly provide a major impetus for reform – is striking.
This paper builds on and extends previous work by applying a theory-consistent, and comprehensive measure of trade costs. Our measure is ‘top down’ in the sense that it infers trade costs from observed patterns of trade and production. This approach contrasts with the ‘bottom up’ approach of most previous work on trade costs in services, which has started by coding qualitative data on regulatory measures and then estimating their economic impact based on summary measures of restrictiveness.
In concrete terms, our methodology has three important advantages. First, our ‘top down’ approach means that our measures capture the full range of cost factors affecting international trade in services. Even unobservable trade costs are accounted for. Previous work, by contrast, mostly captures the costs related to certain types of regulatory measures, but cannot be said to have produced comprehensive estimates of trade costs in services.
Second, our methodology is theory-based, and relies on an identity relationship rather than econometric estimation. Previous work that infers trade costs from gravity model estimates tends to confound true trade costs with noise in the data, which results in estimates that are difficult to interpret. Of course, the cost of relying heavily on theory is that if it is incorrect, then the decomposition might also be erroneous. However, Novy (Reference Novy2013) shows that the approach we use here can be applied successfully to a variety of theoretical models of trade; it obviously captures a deep regularity in the relationship between trade costs, domestic usage, and trade flows. He also shows that it is highly robust to the possibility of measurement error. As a result, we are confident that our measures represent the best data currently available on the level of trade costs in international services markets.
Third, our approach has very limited data requirements. Using easily obtainable data from national accounts and trade databases, we can calculate trade costs for a wide variety of countries over a relatively long time period – a first in the services trade literature. The main limitation of our data is that they focus on GATS Modes I–II, namely pure cross-border services trade, and transactions involving movement of the consumer (as reflected in balance of payments data). Comparable information on GATS Modes III–IV is not yet available across a wide enough variety of countries, sectors, and years to make a similar analysis feasible.Footnote 3 Nonetheless, the availability of our trade cost measures opens up a variety of paths for research on trade in services, which to date has been heavily constrained by the relative lack of availability of panel data.
The next section discusses our methodology for producing the dataset. Section 3 provides some descriptive results on trade costs in services using our new data. Section 4 concludes, and discusses some applications of our new data.
2. Data treatment and methodology
Starting from the standard, theory-consistent gravity model of Anderson and van Wincoop (Reference Anderson and van Wincoop2004), Novy (Reference Novy2013) develops a comprehensive measure of bilateral trade costs.Footnote 4 Equation (1) presents that measure in ad valorem equivalent terms. It is the geometric average of bilateral trade costs for exports from country i to country j and from country j to country i , expressed relative to domestic trade costs in each country ( ${\textstyle{{t_{ij}} \over {t_{ii}}}} $ and
 ${\textstyle{{t_{\,ji}} \over {t_{\,jj}}}} $ respectively). To calculate it, all that is required is data on domestic usage relative to exports in both countries (
 ${\textstyle{{x_{ii}} \over {x_{ij}}}} $ and
 ${\textstyle{{x_{\,jj}} \over {x_{\,ji}}}} $ respectively). The parameter σ is the elasticity of substitution among varieties in a sector, assuming the Anderson and Van Wincoop-based derivation of Novy's measure of trade costs. The parameter γ is a measure of firm-level heterogeneity if the model is instead derived from Chaney (Reference Chaney2008).
 $$\tau _{ijkt} = \mathop {\left( {\displaystyle{{t_{ijkt}. t_{\,jikt}} \over {t_{iikt}. t_{\,jjkt}}}} \right)}\nolimits^{{\textstyle{1 \over 2}}} - 1 = \mathop {\left( {\displaystyle{{x_{iikt}. x_{\,jjkt}} \over {x_{ijkt}. x_{\,jikt}}}} \right)}\nolimits^{{\textstyle{1 \over {2\left( {\sigma - 1} \right)}}}} - 1 = \mathop {\left( {\displaystyle{{x_{iikt}. x_{\,jjkt}} \over {x_{ijkt}. x_{\,jikt}}}} \right)}\nolimits^{{\textstyle{1 \over {2\gamma}}}} - 1$$
Intuitively, Novy's measure captures the fact that if a country's trade costs vis-à-vis the rest of the world fall, then a part of its production that was previously consumed domestically will instead be shipped overseas. Trade costs are thus closely related to the extent to which a country trades with itself rather than other countries, and data on this kind of relative openness can be used to make inferences about the level of trade costs and their variation over time.
This approach has three main advantages over the readily available alternatives. First, it represents a comprehensive measure of the full range of trade costs, namely the costs of providing goods or services across borders relative to the costs of providing them within countries. In goods markets, it captures international shipping – as in work using CIF/FOB ratios – but also a much wider variety of cost factors (see Anderson and van Wincoop, Reference Anderson and van Wincoop2004 for a full review). In services, it takes account of factors such as: geographical, cultural, and linguistic distance; regulatory barriers to trade; regulatory heterogeneity; access to finance for accessing new markets; differences in business and investment climates; and other behind-the-border measures that have asymmetric impacts on domestic and foreign suppliers. Even the effects of regulatory measures that are discriminatory in fact but not in law are included in this measure of trade costs.
The second advantage of Novy's measure is that its data requirements are minimal. As a result, it is feasible to obtain measures of trade costs in services sectors, where data availability is much more limited than for goods. We are thus able to obtain data on usage, exports, and trade costs across a wide variety of countries, sectors, and time periods.
Third, Novy's measure relies on a theory-based rearrangement of data, rather than econometric estimation. It thus does not suffer from the possibility of omitted variables bias, which potentially affects traditional gravity models of services markets.Footnote 5 Another potential problem with gravity model-based estimates of trade costs such as Walsh (Reference Walsh2006) is that they tend to confound trade restrictions and noise in the data, both of which are associated with trade flows that diverge from expected values based on model estimates.
This methodology for computing time-varying trade costs therefore requires data on both domestic output and bilateral trade at the sector level. We use a 29 sector classification based on ISIC Rev.3, which is the industry classification used in national accounts data such as input-output tables. Below, we provide a brief overview of the way data were collected and handled in order to calculate τ ijkt across countries, sectors, and years. In the end, we construct Novy (Reference Novy2013) measures of trade costs in services covering up to 61 countries and 12 services sectors. As a point of comparison, we also compile data on 17 goods sectors. Data at this level of detail are only available for a subset of countries, however, and so we also use an aggregate version of the data. This approach allows us to expand the analysis to other countries for which disaggregated output data are unreliable and/or relatively unavailable. In the next section, where we present results, we are careful to use a balanced sample, in the sense of country–partner–sector combinations that are observed consistently over the full time period for which the analysis is presented. This limitation is important in order to avoid entry and exit of countries or sectors from the sample, with corresponding changes to measured trade costs that reflect that dynamic rather than the underlying situation.
In all calculations, the elasticity of substitution σ is set equal to 8, which is the same rule of thumb used by Novy (Reference Novy2013). It is very close to the typical country's average elasticity of substitution reported by Broda et al. (Reference Broda, Greenfield and Weinstein2006) of 6.8. Setting σ = 8 is equivalent to setting γ = 7, which is also reasonable in light of previous work on firm level productivity distributions.Footnote 6 Although ad valorem equivalents are quite sensitive to the value chosen for σ or γ, using indices relative to a base year reduces that problem to economically insignificant levels. For example, using σ = 10 results in substantially different estimated worldwide ad valorem equivalents for services: 106% in 1995 and 107% in 2007, compared with 153% and 155% respectively with σ = 8. However, the change in those numbers over time is nearly identical: 1.3% versus 1.4%. The following subsection presents results using both methods.
Domestic output
Because we are primarily interested in total domestic demand for a given sector, one cannot rely on sectoral GDP data as these do not comprise intermediate consumption. We thus use gross sectoral output. Our primary data sources are EU KLEMS and the OECD's STAN database, which are for the most part compatible as long as one does not get into productivity analysis (O‘Mahony and Timmer, Reference O'Mahony and Timmer2009). In addition, STAN also provides data on total exports at the sector level which may prove useful when computing ‘intranational trade’, that is x ijkt. Both sources rely on the ISIC Rev.3 classification so that no further corrections are needed with respect to sector correspondence.
However, because country coverage remains limited to OECD and EU countries, we also rely on the UN's National Accounts Official Country Data, which provide data for several emerging and developing economies such as Croatia, Namibia, Colombia, and Nicaragua. Yet, only a few data points are in effect compatible with our primary sources as reporting and methodology differ widely across countries. We therefore end up with quite aggregated data for sectors as broad as ‘transport, storage and communications’.
This prompted us to use input-output (IO) tables for major Asian economies such as China, India, Indonesia, or Taiwan. Data come from the OECD's set of IO tables which detail sector-level gross output using an ISIC Rev.3 compatible classification. Since IO tables are only typically released every five years, we had to interpolate missing values for these four countries. While this inevitably entails some smoothing, it allows us to bring the analysis to a more disaggregated level for countries as important as China.
Gross output data are most of the time expressed in millions of local currency and at basic prices. We convert them into US$ using bilateral nominal exchange rates from the OECD and the IMF's International Financial Statistics database (market rates, period average). In addition, these data are for most countries in basic prices that do not include taxes on products, subsidies on production, suppliers' retail and wholesale margins, and separately invoiced transport and insurance charges (when relevant in the case of services). In order to make the data comparable with trade statistics that include all these different taxes, subsidies, margins, and charges in the value of exports, we convert basic prices into purchasers' prices by applying a conversion factor. Purchasers' prices are calculated for each country/industry as the ratio of intermediate consumption valued at purchasers prices over intermediate consumption valued at basic prices, both of which can be found in IO tables. Intermediate consumption is being used instead of gross industry output because IO tables only contain output valued at basic prices. The underlying assumption thus made is that – for a given country/industry – the ratio for intermediate consumption prices applies equally to industry output. Although this conversion factor can only be used in cases where an IO table is available, we found that the conversion itself does not change results in a significant manner.
Trade flows
For goods, we rely on the OECD's ITCS database which provides data on bilateral trade flows directly in the ISIC Rev.3 format. As flows are expressed in current US$, no further adjustment proved necessary. Things are more complicated for services where our data sources are threefold. First is the OECD's TISP database (International Trade in Services by Partner Country). Second is Eurostat's balance of payments statistics. And third is the UN's Service Trade database. Aside from data availability concerns, the issue of aggregation arises. Because data for Mode I and Mode II trade in services essentially come from balance of payments statistics, they are released using the EBOPS classification. We thus had to use a conversion key from EBOPS to ISIC Rev.3 that allows comparison to be made with other data. Unfortunately, such a conversion inevitably entails losses of information. This is particularly the case for industries such as ‘Computer activities’ and ‘Other business activities’ (see Miroudot et al., Reference Miroudot, Lanz and Ragoussis2009).
3. Trade costs in services, 1995–2007
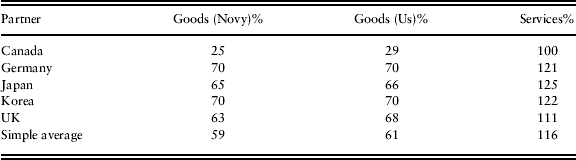
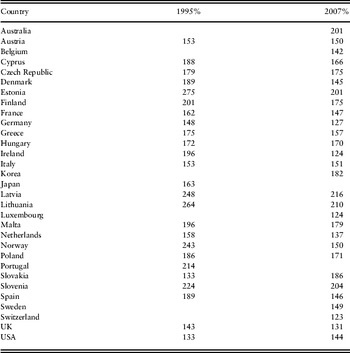
Full results for 1995 and 2007 are reported in the Appendix. In terms of interpretation, first, Table 1 column 1 compares our results with those reported in Novy (Reference Novy2013) for USA trade costs in goods vis-à-vis its major trading partners. In line with the methodology set out above, we and Novy are both measuring international trade costs (between countries) relative to domestic trade costs (within countries). Our results are generally very close to his, although slightly higher in some cases. This finding provides reassurance that our new data, which cover a much broader range of countries and sectors than previous estimates, are reliable with regard to existing work. It is worth stressing that the relatively high numbers reported in Table 1 reflect the full range of cost factors that affect international transactions, not just protection (i.e. tariffs in the case of goods markets).Footnote 7 Based on a comprehensive review of the literature, Anderson and van Wincoop (Reference Anderson and van Wincoop2004) estimate that international trade costs of the type we are measuring amount to around 74% in ad valorem equivalent terms for goods markets. Our number is thus slightly lower than theirs, even though both figures may seem high compared to those used to discussing rates of protection in advanced countries, which are generally in single digits. It is important to highlight, however, that not all trade costs can be reduced by policymakers in the way that tariffs and non-tariff barriers can. There will always be some level of trade costs due to, for example, geographical distance.
Comparison of trade costs in goods and services, USA vis-à-vis major partners, 2000 (percent ad valorem equivalent)
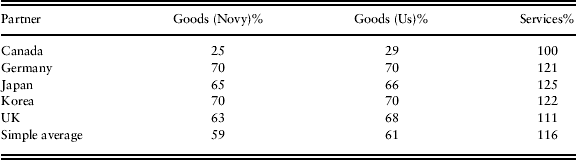
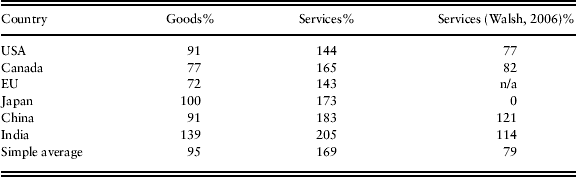
The standout result from Table 1 is that the level of trade costs is much higher in services sectors than in goods – about double, on average, for the US and its major trading partners. The same result emerges from Table 2, which compares trade costs of major trading economies vis-à-vis the rest of the world. The absolute levels of trade costs in services are very high: over 100% in all cases, and over 200% for India. These figures should be interpreted with caution, since they rely on an assumption as to the value of the elasticity of substitution, and on an assumption that it is the same in goods and services sectors. But even if the numbers are subject to uncertainty, the relative pattern of trade costs is clear: they are much higher in services sectors than in goods sectors. Again, we stress that not all components of the trade costs figures we have calculated are amenable to reduction by policymakers in the way that tariff-like barriers are. There will always be some additional costs of doing business abroad relative to selling services domestically due to geographical distance, cultural and linguistic barriers, and the characteristics of the services being produced.
Comparison of trade costs in goods and services, major trading economies vis-à-vis the rest of the world, latest year (percent ad valorem equivalent)

At first glance, the results in Table 1 might appear surprising: even between two markets that are close geographically and culturally, and that are perceived to be relatively open – the USA and Canada – there are trade costs in services of around 100%, compared with only 30% in goods. It is important to remember, however, that this number is not a measure of protection, rathert encompasses all types of trade costs.
The same reasoning applies to the estimates in Table 2. It is to be expected that the measures we present will be substantially higher than, for example, the ad valorem equivalents reported by Walsh (Reference Walsh2006) for services markets. Taking that author's results as a measure of protection, it is by no means unrealistic that additional trade costs – i.e. those not related to direct trade protection – should add an additional 70% or so to the overall level of trade costs for the USA vis-à-vis the rest of the world. The comparison with goods markets is again instructive. The World Bank's Overall Trade Restrictiveness Index suggests a protection rate in the USA of a little over 6% for goods, but total trade costs are more on the order of 60%. So in ad valorem terms, total trade costs in services are perhaps double the rate of protection, whereas in goods the multiple is more like ten times.
As noted above, our calculation of the level of trade costs in ad valorem equivalent terms is sensitive to our assumed value for σ, the intra-sectoral elasticity of substitution, or γ, an indicator of firm-level heterogeneity. By expressing results in terms of a base year–i.e., as index numbers–the sensitivity problem practically disappears. Index number results are very close for values of γ in the range five to nine, around our central value of seven (as in Novy, Reference Novy2013).
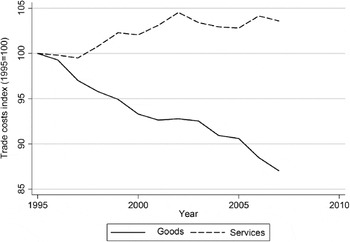
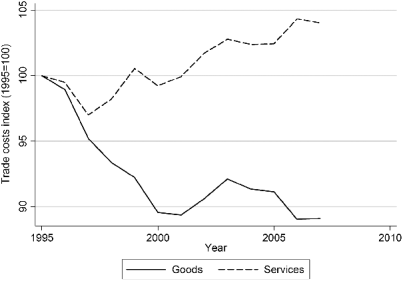
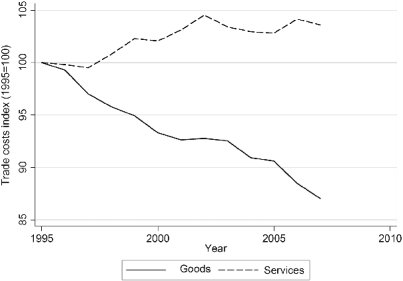
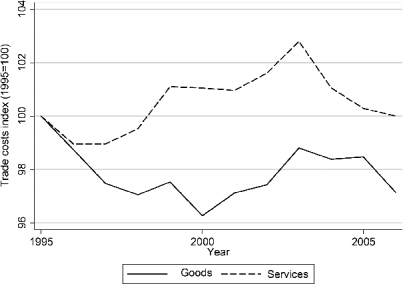
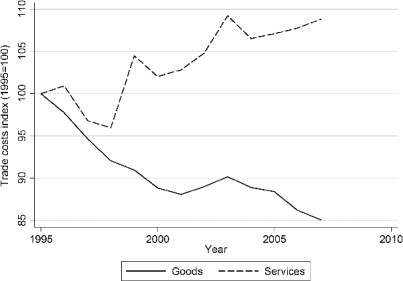
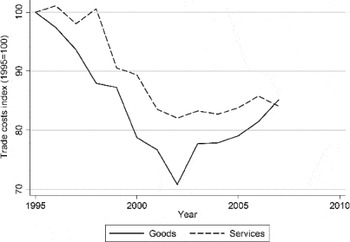
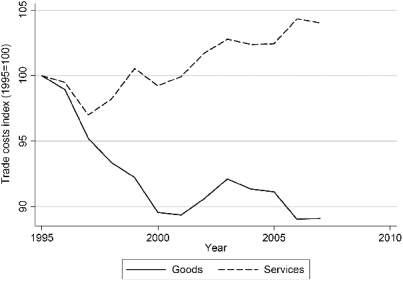
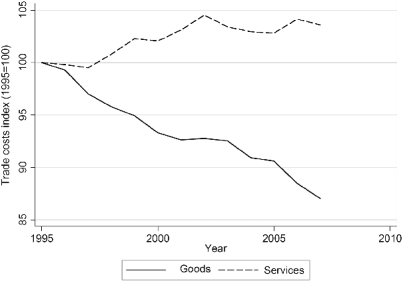
The index number approach is useful for examining performance over time (Figure 1 through Figure 5). We see that on a world aggregate basis (Figure 1), trade costs in goods have declined by more than 15% over the last ten years. The same is by no means true for services: trade costs have barely moved over the last decade, and if anything, may have slightly increased. The same pattern emerges for most of the major trading economies in the next set of figures. It is interesting to note that the US services index declines by a few points over the period 1995–1998, but the EU index does not – even though this period should coincide with realization of the full impact of the 1992 program on the internal market in services. Of course, the EU internal market in services does not mean that trade costs are centrally set in Brussels. Member States still have extensive powers to impose domestic regulations covering a wide variety of circumstances. We should therefore not necessarily expect to see a strong reduction in international relative to domestic trade costs over our sample period, because both measures have been changing in particular Member States over time. Moreover, the nature of our trade costs measure limits the strength of the interpretation we can put on these kinds of changes. Because it is the ratio of international to domestic trade costs, the failure to record a fall in the ratio could equally well be due to proportional declines in both international and domestic trade costs over time. Nonetheless our interpretation in terms of a lack of movement in trade costs is consistent with the fact that major markets have not engaged in substantial new liberalization of services in recent years, in particular due to the stalled Doha Round negotiations in this area.
World aggregate trade costs indices for goods and services, 1995–2007 (1995 = 100)

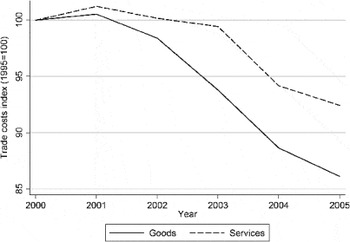
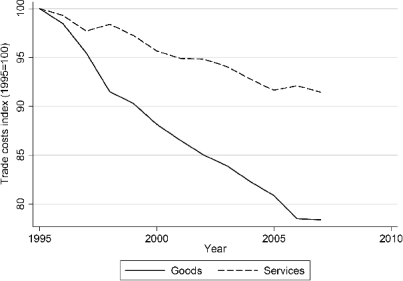
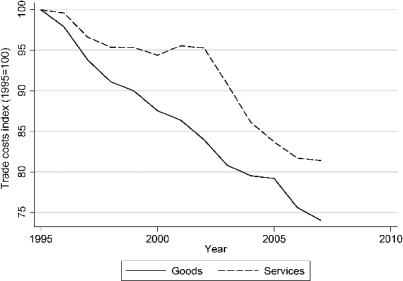
The obvious exception to the pattern described above and in Figure 1 through Figure 4 is China (Figure 5): trade costs have declined substantially in services markets as well as in goods. It is important to highlight two caveats to this finding. First, Table 2 shows that China still has high levels of trade costs relative to other major economies. So there is still considerable room for further reductions. Nonetheless, the proportional reductions since 2000 are impressive.
US trade cost indices for goods and services, 1995–2007 (1995 = 100)
EU trade cost indices for goods and services, 1995–2007 (1995 = 100)
The second caveat is that the trade costs that we are measuring represent an average of trade costs facing foreign producers exporting to China, and trade costs facing Chinese firms exporting to other countries. Thus, we cannot conclude that the very large trade cost reductions observed for China are solely due to policy reforms undertaken at home. They are also linked to trade cost reductions by China's trading partners following accession to the WTO, which provided China with permanent MFN status.
Japan trade cost indices for goods and services, 1995–2007 (1995 = 100)
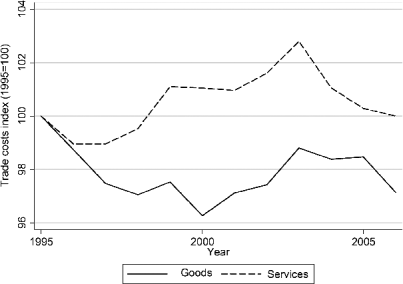
China trade cost indices for goods and services, 1995–2007 (1995 = 100)

Nonetheless, our findings are in line with recent work suggesting that the terms of China's WTO Accession Agreement had real ‘bite’ in services, in the sense that they required significant liberalization of applied policies, at least to the extent that they relate to foreign market access (Mattoo, Reference Mattoo, Deepak Bhattasali and Martin2004). It is important to note, however, that since our measure is the ratio of international to domestic trade costs, what we are picking up in this change is primarily a reduction in discrimination vis-à-vis foreign service providers, rather than domestic regulatory reform that is arguably important in the context of services sector liberalization more generally. In any case, the Chinese example is in stark contrast to most countries’ GATS schedules submitted at the end of the Uruguay Round: they established binding policy ceilings, but contained little in the way of genuine liberalization. Whatever liberalization has occurred, since the Uruguay Round, has been undertaken unilaterally or preferentially, and it is therefore not surprising that for other countries, changes in trade costs on a multilateral basis have been limited.
Another case that is deserving of attention is that of the EU. Since trade policies are set in Brussels, one might expect a certain level of uniformity of trade costs with respect to the rest of the world. However, this is not the case. First, different countries display highly divergent levels of trade costs in goods and services markets alike. Germany, for instance, has tariff equivalents of 65% and 127% for goods and services respectively for 2007. The same figures for another large Eurozone economy, France, are 91% and 168%, while for a small economy, Ireland, they are 114% and 165%. For a ‘new’ EU member, Poland, the tariff equivalents are 75% and 144%. This pattern suggests that there are a range of factors that influence trade costs, but which remain heterogeneous at the level of individual member states. It is beyond the scope of this paper to delve into the reasons for that heterogeneity in detail, but it seems likely that future work could uncover evidence of regulatory measures and other behind-the-border factors that exert a significant influence on trade costs, but which are not fully encompassed in the EU's common trade policy. It is also important to recall that we are measuring international relative to domestic trade costs, and EU rules allow the latter to vary substantially across countries, perhaps accounting for some of the differences we observe in the ratios.
In addition, we find that changes in services trade costs over time are also very different across EU countries (Figure 6–Figure 9). There are substantial reductions in trade costs between 1995 and 2007 in Germany, Ireland, and Poland, but a noticeable increase over the same period in France. This is in marked contrast with goods markets, where all four economies register substantial declines in trade costs. Although more in-depth analysis is needed before drawing any firm conclusions, this heterogeneity in time paths suggests that member states may have taken substantially different tracks in implementing the single market for services, and that significant imperfections remain (witness the aborted Bolkestein Directive).
Germany trade cost indices for goods and services, 1995–2007 (1995 = 100)
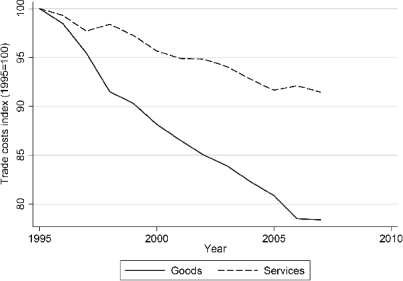
France trade cost indices for goods and services, 1995–2007 (1995 = 100)
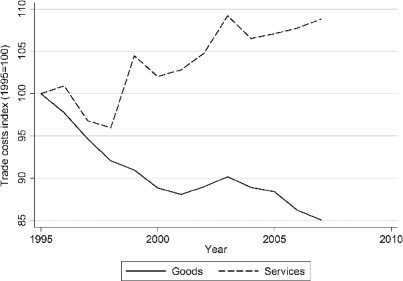
Ireland trade cost indices for goods and services, 1995–2007 (1995 = 100)

Poland trade cost indices for goods and services, 1995–2007 (1995 = 100)
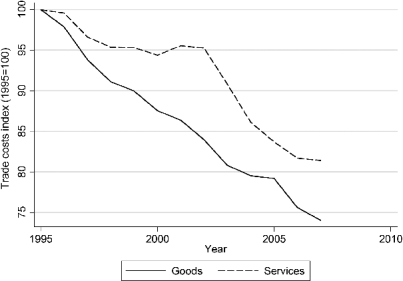
Finally, the case of Poland is interesting for what it can potentially say about the process of EU accession. In services markets, we see that trade costs only started to fall rapidly from about 2002 onwards. The changes for 2002–03 and 2003–04 were particularly large, on the order of 5% each year. The rate of decline in goods trade costs, however, is much more consistent over the full sample. This example tends to suggest that the degree of ‘bite’ in the single market for goods is substantially greater than that of the single market for services: the process of acceding to the EU is associated with a consistent decline in trade costs of over 25% for goods, but a stop-and-start fall of less than 20% for services.
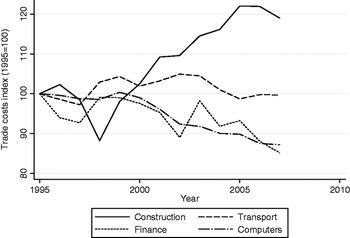
The index number approach is also useful for examining the evolution of sectoral trade costs over time. As an example, Figure 10 presents a comparison between construction, transport, financial, and computer services. Trade costs in construction services have increased markedly over the last decade, by nearly 20%. Construction is also the most insulated sector, with ad valorem equivalent trade costs of around 200%. Of course, performance is likely to vary markedly across countries; the figure presents aggregate data for the world as a whole, and therefore includes relatively restricted as well as fairly open markets.
Trade costs indices for construction services, transport services, financial services, and computer services, 1995–2007 (1995 = 100)

None of the other three sectors exhibits a substantial increase in trade costs over time. Trade costs in transport services have remained approximately constant over the last decade. By contrast, trade costs in financial and computer services have fallen by more than 10%. This finding is perfectly consistent with the rise of outsourcing in those sectors over roughly the same time period: as trade costs fall, probably due to improved information and communications technologies (ICTs), it becomes feasible for firms to have more of these kinds of tasks performed overseas. Sectors such as transport and construction, on the other hand, are largely immune to such developments because of the need for physical proximity between producer and consumer.
4. Conclusion
This paper uses a new, theory-based methodology due to Novy (Reference Novy2013) to present some of the first systematic evidence on the level of trade costs in services sectors, measured as international trade costs (between countries) relative to domestic trade costs (within countries). It also discusses changes in those costs over time. We find strong evidence that trade costs in services are much higher than in goods: perhaps a multiple of two or even three times. The data also suggest that trade costs in goods have fallen substantially over the last decade, but that they have remained essentially stable in services markets. China's experience is different, however, and is suggestive of an important role for external commitment mechanisms such as the WTO in reducing trade costs in services.
There are many potential empirical applications of our data. We have examined two in companion papers. In Miroudot et al. (Reference Miroudot, Sauvage and Shepherd2012), we present the first econometric evidence that services sectors facing lower trade costs tend to be more productive, and have higher productivity growth. As is the case for goods markets, this result is consistent with models in which lower trade costs lead to the shrinkage or exit of less productive firms and the transfer of resources to larger, more productive ones. The second application is Miroudot and Shepherd (Reference Miroudot and Shepherd2012), in which we examine the impact of regional trade agreements (RTAs) on trade costs in services. We show that services RTAs reduce trade costs, but only to a small degree. We also find that the ‘margin of preference’ of services RTAs is, on average, diminishing over time, and that the degree of discrimination introduced by services RTAs is relatively low. This paper therefore provides some of the first empirical evidence that services RTAs tend to act as building blocks rather than stumbling blocks with respect to the multilateral trading system, as they reduce trade costs for members and non-members alike. One likely reason is that services RTAs are linked to general regulatory reform programs that have only limited discriminatory effects. The presence of liberal rules of origin in services RTAs might also be part of the explanation.
Future work can extend ours in a number of directions. First, to the extent possible, it would be beneficial to include additional countries in the database. However, limits on the availability of national accounts and trade data at a sufficient level of disaggregation make further progress difficult at this time.
Second, it will be important to decompose overall trade costs into those that are amenable to policy action, and those that are ‘natural’ or at least non-compressible. The latter category includes cultural and linguistic differences, for example. We expect, however, that regulation plays a large part in the persistence of high trade costs in services, either directly or indirectly. Regulatory barriers obviously hinder services trade. By contrast, regulation that reinforces the main conduits by which services are traded across borders – such as ICTs – tends to reduce trade costs. We have seen evidence of this type of effect in the computer and financial services sectors, for example. Better understanding the direct and indirect effects of regulation will be crucial to facilitating trade in services in the future.
Third, it would be possible to use a similar approach to derive measures of trade costs from alternative theoretical frameworks. One that is particularly attractive in the services context is Ardelean (Reference Ardelean2011). The essence of that model is that domestically made varieties are more substitutable than foreign varieties. In the context of services, this feature would capture the fact that services often need to be tailored to meet local tastes, which in turn generates a ‘natural’ preference for domestic over foreign-mode varieties. The extension of Ardelean (Reference Ardelean2011) to a gravity model context would make it possible to derive a measure of trade costs, provided that the model generates a gravity-like expression with fixed effects by importer and exporter. The interpretation of trade costs, and their relationship to observed patterns of trade and production, in the context of that model is outside the scope of the current paper in which the objective was to apply an established methodology to new data, in order to generate fresh insights on the level and changes in trade costs in services markets over recent years.
Appendix
Trade costs in services vis-à-vis the rest of the world, 1995 and 2007 (percent ad valorem equivalent)