I. INTRODUCTION
Nowadays a practical efficiency target is 100 lm W−1 of a phosphor-converted light-emitting diode (LED) illumination, which is comparable to high-end white fluorescent lamps. Improving the quantum efficiency, stability, linearity, and temperature performance of phosphors are the most important issues to meet that target. Especially the improvement of the internal quantum efficiency of the presently applied materials can itself hardly contribute to that goal, since LED phosphors, such as YAG:Ce, (Ca,Sr)S:Eu, and (Ca,Sr)2Si5N8:Eu, are already operating at the physical limit as far as the internal quantum efficiency is concerned. Namely, a drawback is the weak absorption of Eu3+ in the blue and even in the near-ultraviolet (UV).
The main strategy to solve that problem has focused on materials that have broad and intense charge-transfer (CT) absorption bands in the near-UV and are therefore capable of efficiently absorbing the emission from InGaN chips(370–420 nm). Such materials include oxysulfides, vanadates, molybdates, and tungstates, where the oxygen to Eu3+ CT band is very intense and broad and the position is at rather low energy, as for e.g., in Y2O2S:Eu or Gd2O2S:Eu.Reference Shionoya and Yen1
A recent idea is to convert near-UV via the 4f–4f transitions of Eu3+ located at 394 nm (7F0–5L6), which is rather intense in tungstates and molybdates because they own large band gap (so as not to absorb the emitted radiation) and are stiff (easily excited lattice vibrations can lead to nonradiative relaxation, which increases the efficiency). Following the excitation process, Eu3+ relaxes nonradiatively to the 5D0 state, which is the emitting energy level. For instance, the composition Gd2Mo3O9 shows twice higher light output than Y2O2S:Eu for 395 nm excitation.Reference Zhao, Wang, Chen, Meng, Di, Ren and Yang2
Those results feed the hope that a Eu3+ phosphor, which is sufficiently strongly luminescent under 394 nm and/or 465 nm excitation, can be found in the future.
In our previous research work,Reference Cao, Tian, Chen, Xiao and Wu3–Reference Cao, Li, Tian, Wu, Chen and Xiao10 (Ca,Sr)(Mo)O4:Eu3+ and (Ca,Sr)(Mo,W)O4:Eu3+ were prepared and its luminescent properties were improved to some degree by charge compensation and codoping under 394 nm excitation. But its emission abilities cannot meet the requirement of LED illumination. In this article, [K0.8Y0.63Eu3+0.08Zn 0.02][Mo0.2W0.8O4] was prepared, and its quantum efficiency and partial J-O parameters were calculated under 395 nm excitation. It is found that its emission ability is improved through Zn–Eu energy transfer.
II. EXPERIMENTAL SECTION
A. Synthesis
A series of red-emitting phosphors were synthesized by solid-state reaction. The starting materials were K2CO3 (A.R. grade), Eu2O3 (99.99%purity), MoO3 (A.R. grade), H2WO4 (A.R. grade), Y2O3 (A.R. grade), and ZnCO3 (A.R. grade). According to stoichiometric ratio, the reactants were weighed and ground, and the precursor was obtained. The precursor was prefired at 600 °C for 3 h and then fired at 900 °C for 4 h in the air. The red-emitting phosphor (pink-white substance) was gained.
B. Characteristics
The structures of the products were recorded by X-ray powder diffraction (XRD) employing CuKα radiation at 40 kV and 250 mA. A step size of 0.02° (2θ) was used with a scan speed of 4 °/min. Excitation and emission spectra were measured by using a Hitachi F-4600 spectrometer (Hitachi Co. Ltd., Tokyo, Japan) equipped with a 150 W-xenon lamp under a working voltage of 500 V. The excitation and emission slits were set at 2.5 nm and scanning speed was 1200nm/min. All the measurements were performed at room temperature.
III. RESULTS AND DISCUSSION
A. Structural characterization of [K0.8Y0.63Eu3+0.08Zn 0.02][Mo0.2W0.8O4]
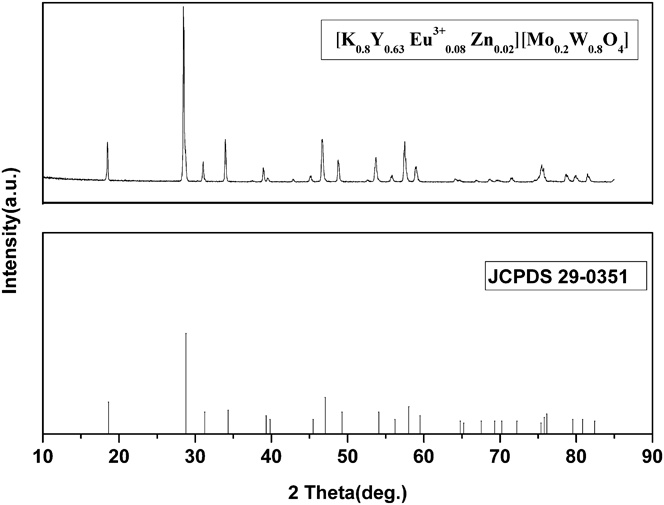
To characterize the phase purity and crystallinity of the sample, the XRD pattern of [K0.8Y0.63Eu3+0.08Zn 0.02][Mo0.2W0.8O4] is shown in Fig. 1. With K+, Y3+, Eu3+, and Zn2+ ions introduced in the host, the crystal structure of [K0.8Y0.63Eu3+0.08Zn 0.02][Mo0.2W0.8O4] is consistent with JCPDS card No. 29-0351, corresponding to the intrinsic diffraction patterns of CaMoO4. The sample owns single phase, which have a tetragonal crystal structure with space group of I41/a(88).
X-ray powder diffraction pattern of [K0.8Y0.63Eu3+0.08Zn0.02][Mo0.2W0.8O4].

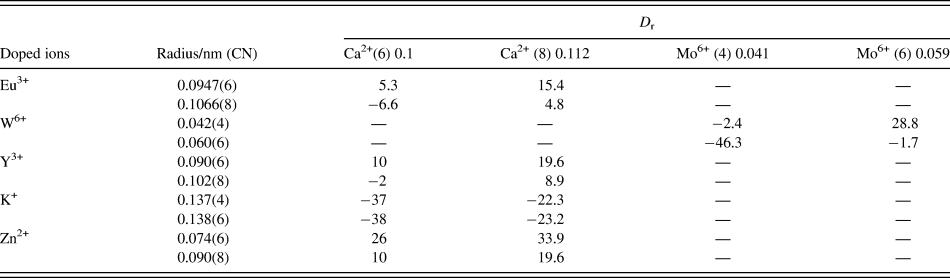
In general, it is thought that ions replacing each other should abide by the laws that its ion radium, coordination number, and electronegativity are near to each others.Reference Pires and Davolos11 With Eu3+, Y3+, K+, Zn2+, and W6+ ions coming into the host, Eu3+, Y3+, K+, and Zn2+ ions substitute partial Ca2+ ion sites and W6+ ions replace some Mo6+ ion positions. But, it is not clear for the doped ions coordination circumstances in the host lattice. To explore the coordination circumstances of introduced ions in the host, the calculations of the radius percentage difference between the introduced ions (Y3+/1.22, Eu3+/1.2, K+/0.82, Zn2+/1.65, W6+/2.36) and the substituted ions (Ca2+/1.00, Mo6+/2.16) in the host are summarized in Table I, based on the equation, D r = 100*[R m(CN) − R i(CN)]/R m(CN), where D r is the radius percentage difference, CN the coordination number, R m(CN) the radius of the host cation and R i(CN) the radius of introduced ion. The values of D r between Eu3+/Y3+/K+/Zn2+ and Ca2+ on six- and eight-coordinated sites are 5.3 and 4.8%/−2.0% and 8.9%/−37% and −22.3%/10% and 19.6%, respectively, while D r between Mo6+ and W6+ on four- and six-coordinated sites are −2.4% and −1.7%. So, it is thought that the CN of Eu3+/Y3+/K+/Zn2+/W6+ is 8/6/4/8/6.
Ionic radii difference percentage (D r) between matrix cations and doped ions.

CN, Coordination number, the data for the effective ionic radii are from Ref. Reference Shannon12.
B. Spectral analysis of [K0.8Y0.63Eu3+0.08Zn 0.02][Mo0.2W0.8O4] and energy transfer mechanism
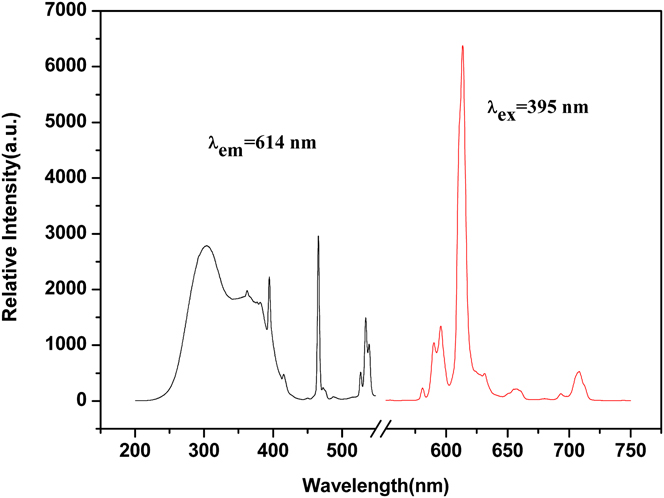
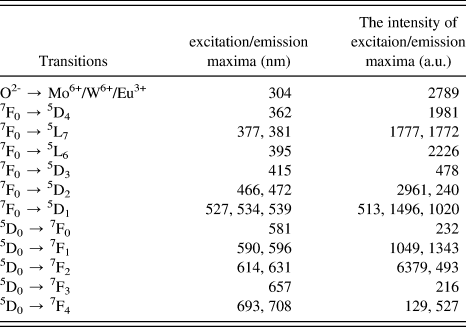
There are excitation spectrum of [K0.8Y0.63Eu3+0.08Zn0.02][Mo0.2W0.8O4] under 614 nm monitoring and its emission spectrum under 395 nm excitation in Fig. 2. In the left excitation spectrum, there are one broad band from 200 to 450 nm (304 nm from the CT transitions of MoO6, WO6, and EuO8,Reference Sheu, Chang, Kuo, Su, Wu, Lai, Tsai, Chi and Wu13 362 nm from 7F0 → 5D4 transition, 377 nm and 381 nm from 7F0 → 5L7 transition, 395 nm from 7F0 → 5L6 transition) and two sharp peaks at 466 nm (splitting, 472 nm) and 534 nm (splitting, 527 nm/539 nm), respectively, corresponding to 7F0 → 5D2 transition and 7F0 → 5D1 transition. According to Ref. Reference Huh, Shim, Kim and Rag Do14, based on the excitation spectra, the assignments are given that the CT band of the MoO6 groups covers the arrange of 225–375 nm and that of the WO6 groups locates around 250–330 nm. Referring to the data reported in other Eu3+-doped phosphors,Reference Wang, Liang, Gong and Su15 the CT band of EuO8 should be located around 250–320 nm. Under 614 nm monitoring, it is the most interesting that a broad band comes in being from 200 to 450 nm by uniting five peaks into one whole part because of CT band from host and 4f–4f transitions band of Eu3+ overlapping in [K0.8Y0.63Eu3+0.08Zn 0.02][Mo0.2W0.8O4]. In the right emission spectrum of [K0.8Y0.63Eu3+0.08Zn0.02][Mo0.2W0.8O4] under 395 nm excitation, there are eight peaks attributed to 5D0 → 7F0 (581. nm, 232 a.u.), 5D0 → 7F1 (two peaks are situated at 590 and 596 nm, respectively, and their intensity are 1049 and 1343 a.u., respectively), 5D0 → 7F2 (614 nm/6379, 631 nm/493 a.u.), 5D0 → 7F3 (657nm, 216 a.u.), and 5D0 → 7F4 (693 nm/129 a.u., 708 nm/527 a.u.) in Table II. In general, 5D0 → 7F2,4,6 transitions are electric dipole transitions. In theory, electric dipole transitions are generally forbidden since the parity does not allow the transition between opposite parities, for example, 5d and 4f. But in the experiments, the forbidden is partly relieved because Eu3+ occupies a non-central-symmetric site when Eu3+ was doped in the host. So some narrow emission peaks are presented corresponding to 5D0 → 7F2,4 transitions in the experiments.
Excitation spectrum of [K0.8Y0.63Eu3+0.08Zn0.02][Mo0.2W0.8O4] under 614 nm monitoring and its emission spectrum under 395 nm excitation.

Transition positions and intensity of photoluminescence of [K0.8Y0.63Eu3+0.08Zn0.02][Mo0.2W0.8O4] at ambient temperature.Footnote a

a Under 395 nm excitation or under 614 nm monitoring.
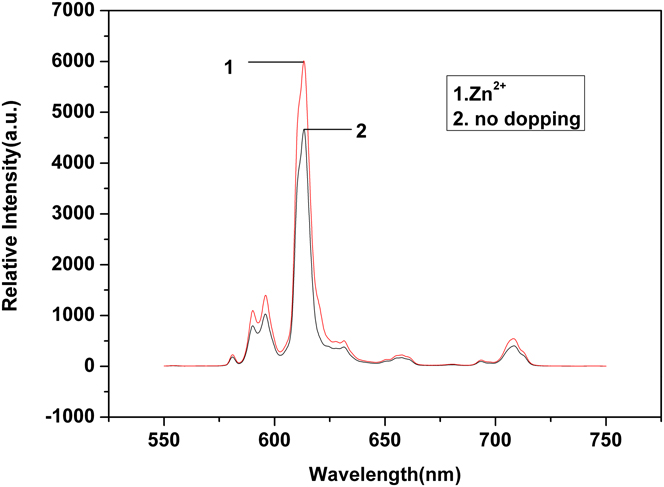
Figure 3 depicts emission spectra of [K0.8Y0.63Eu3+0.08Zn0.02][Mo0.2W0.8O4] and [K0.8Y0.65Eu3+0.08][Mo0.2W0.8O4] under 395 nm excitation. In the general, transition metal ions or others rare ions act on sensitizing luminous centers (Eu3+ ions) by codoping with rare ions in the host.Reference Lee, Luo, Cheng, Diau and Chen16–Reference Solarz and Ryba-Romanowski19 With Zn2+ doped in the K–Y–Mo–W host, the luminescent intensity of [K0.8Y0.63Eu3+0.08Zn0.02][Mo0.2W0.8O4] increases 138% (Zn2+) compared to the one of [K0.8Y0.65Eu3+0.08][Mo0.2W0.8O4]. It is investigated that Zn2+ codoping with Eu3+ in the materials can improve the emission properties of luminescent system because Zn2+ ions play the role of sensitizers in the host lattice, which can improve its emission efficiency.
Emission spectra of [K0.8Y0.63Eu3+0.08Zn0.02][Mo0.2W0.8O4] and [K0.8Y0.65Eu3+0.08][Mo0.2W0.8O4] under 395 nm excitation.

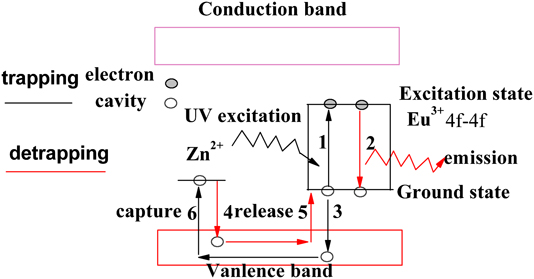
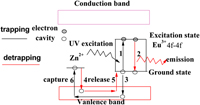
According to no emission peaks of Zn2+ ions observed in the emission spectra while Zn2+ doped in the host improving the emission property of [K0.8Y0.63Eu3+0.08Zn0.02][Mo0.2W0.8O4], one energy transfer mechanism is mentioned in Fig. 4. For energy transfer, the optimal concentration of sensitizers (Zn2+) is much lower than one of activators (Eu3+)Reference Zhang, Lu and Bo20 and the most likely energy transfer path of Zn2+ → Eu3+ is energy transport of current carrier. Two mol% Zn2+ ions doped luminescent materials may bring about energy level (or named level trap). The 4f–4f transition of Eu3+ generates a lot of cavities under the UV excitation (process 1). A part of cavities at once combine with the electrons-excited to emit light (process 2), and other part of cavities are released from valence band and captured by Zn2+ trap level (process 3 and 4) by means of valence band. The cavities are released under thermal perturbation and absorbed by Eu3+ through valence band (process 5 and 6). Thus, this path improves the luminescence efficiency of Eu3+, and Zn2+ ions act as the sensitizers.Reference Shinn and Sibley21–Reference Sabbagh Alvani, Moztarzadeh and Sarabi23
Energy transfer path diagram of Zn2+ → Eu3+ in [K0.8Y0.63Eu3+0.08Zn0.02][Mo0.2W0.8O4].

C. Charge compensation
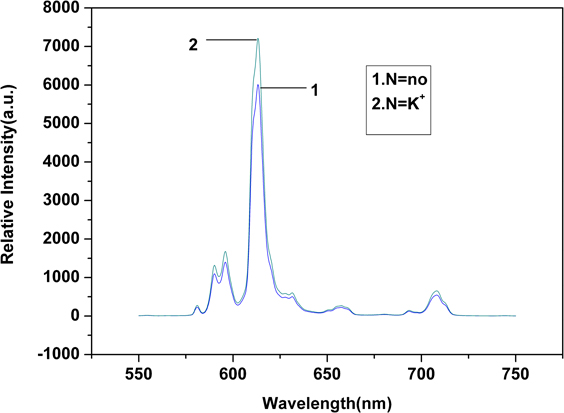
With Zn2+ ions introduced into the K–Y–Mo–W host lattice, Zn2+ ions substitute Y3+ ions situation. Zn2+ ions divalent cations and Y3+ ions trivalent cations Zn2+ ions substituting Y3+ ions produces charge defect so [K0.8Y0.63Eu3+0.08Zn0.02][Mo0.2W0.8O4] needs charge compensation. One Zn2+ ion occupies one Y3+ ion site, and one anion vacancy is introduced. In this work, with 2 mol% K+ used as charge compensators, the emission intensity of [K0.8Y0.63Eu3+0.08Zn0.02K0.02][Mo0.2W0.8O4] can be improved obviously, up to 120% compared to the one of [K0.8Y0.63Eu3+0.08Zn0.02][Mo0.2W0.8O4] in Fig. 5. It is interesting that K+ ions are used as host compositions and charge compensators and its charge compensation model is one vacancy + Y3+ = Zn2+ + K+. In a word, Zn2+ ions destroying charge balance are attributed to Zn2+ ion substituting Y3+ ion site in unequal valence.
Emission spectra of [K0.8Y0.63 Eu3+0.08Zn0.02N0.02][Mo0.2W0.8O4] (N = K+ or no) under 395 nm excitation.

D. Calculating Ωλ and quantum efficiency of Eu3+ 5D0 energy level by J-O theory
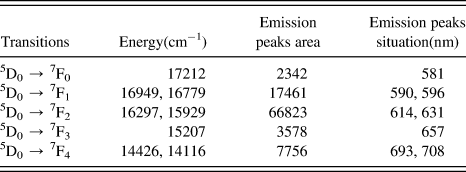
As far as the Eu3+ 5D0 → 7FJ (J = 0–6) transition is concerned, 5D0 → 7F1 is magnetic dipole transition, 5D0 → 7F2,4,6 electric dipole transitions, and 5D0 → 7F3,5 contain both electric dipole and magnetic dipole transition components. The emission of 5D0 → 7F5,6 transition cannot be observed in the experiments. Table III shows the average energies (cm−1) of Eu3+ 5D0 → 7FJ (J = 0–4) transitions.
The average energies (cm−1) and emission peaks situation/area of Eu3+ 5D0 → 7FJ (J = 0–4) of [K0.8Y0.63Eu3+0.08Zn0.02][Mo0.2W0.8O4].

To characterize transition rate between different energy levels of Eu3+ ions, a group of transition intensity parameters Ωλ (λ = 2, 4) called J-O parameters are introduced into Judd-Ofelt theory. Ωλ can be influenced by environment around Eu3+ ions. Especially, Ω2 has a close relationship to the environment around Eu3+ ions. For the K–Y–Mo–W host, Ω2 reflects structure symmetry, order property, and covalent character of K–Y–Mo–W interaction. In a word, the host system that has larger Ω2 is in a more polarizable chemical environment and has stronger covalent character of K–Y–Mo–W interaction. Thus, transition intensity parameters can help us to know the lattice-sites occupied by Eu3+ ions in K–Y–Mo–W host and the microenvironment around Eu3+ ions.
Quantum efficiency of Eu3+ 5D0 energy level can also be calculated by experimental data. The fluorescence lifetime τ of 5D0, radiative transition rate A R, and nonradiative transition rate A N can be expressed as follows.

where A R is the sum of each 5D0 → 7FJ (J = 0–4) transition rate, viz.  . The A 0-J values are obtained by using the relation:
 , where S 0–J is the area under the curve related to the 5D0–7FJ transition obtained from the spectral data, υ0–J is the energy barycenter of the 0–J transition. Here A 0–J is the experimental coefficients of spontaneous emissions, namely A 0–1 is the Einstein’s coefficient of spontaneous emission between the 5D0 and 7F1 energy levels, which can be determined as about 50 s−1 and as a reference to calculate the value of other A 0–J.Reference Lin, Tang and Zhang24–Reference Werts, Jukes and Verhoeven26 So the quantum efficiency of Eu3+ 5D0 energy level can be expressed by

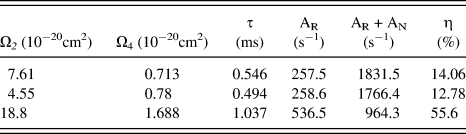
Fluorescence decay curves (measuring luminescence of 5D0 → 7F2) of 5D0 energy level are measured under 395 nm excitation. The fluorescence decay curves are fitted by exponential decay to obtain the values of τ. Then the value of η would be obtained by Eq. (2). Table III depicts the average energies (cm−1) and emission peaks situation/area of Eu3+ 5D0 → 7FJ (J = 0–4) of KYEZMW, and Table IV shows the values of τ, A R, A R+A N, and η of the sample.


Partial J-O parameters, fluorescence lifetime, transition rates and quantum efficiency of [K0.8Y0.63Eu3+0.08Zn0.02][Mo0.2W0.8O4], CaMoO4:Eu3+ (Ref. Reference Lei and Yan27) and commercial Y2O3:Eu3+ Ref. Reference Liao, Xu and Qiu28) under 395 nm excitation.

Thus, the ratio between electric dipole transition rate and magnetic dipole transition rate can be expressed as follows.

Transition rate of each energy level is in direct proportion to integral intensity of emission spectrum, namely 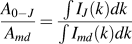 . Here e, kJ, J′ = 0, Ωλ
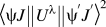 , kmd, n, h, and Smd are elementary charge, wave number of electric dipole transition luminescence, for the 5D0 → 7FJ, transition intensity parameter, squared reduced matrix element of transition from
 to
 , wave number of 5D0 → 7F1 luminescence, refractive index of host 1.6,Reference Binnemans, Van Herck and Gờrller-Walrand29 Planck constant, and the line strength of 5D0 → 7F1 transition 7.83 × 10−42 esu(c) cm2,Reference Boyer, Vetrone, Capobianco, Speghini and Bettinelli30 respectively. The squared reduced matrix elements of 5D0 → 7FJ (J = 2, 4) transitions are 0.0032 for J = 2 and 0.0023 for J = 4.Reference Lei and Yan27, Reference Kodaira, Claudia, Brito and Felinto31, Reference Reisfeld, Greenberg, Brown, Drexhage and Jørgensen32 All parameters in this section used Gauss system of units. Then ΩJ can be calculated utilizing emission spectrum according to Eq. (3). Table IV shows the values of Ω2 and Ω4 (Ω2 = 7.61 × 10⁻²⁰ cm2 and Ω4 = 0.713 × 10⁻²⁰ cm2).
It is noteworthy that the Ω2 and Ω4 intensity parameters for the KYEZMW phosphor are higher than that for CaMoO4:Eu3+ phosphorsReference Lei and Yan27 in Table IV, indicating the higher hypersensitive behavior of the 5D0 → 7F2 transition of Eu3+ ions in K–Y–Mo–W host matrix. Consequently, by comparing the Ω2 intensity parameters between Mo and Mo–W systems, it can be concluded that the Mo–W system is in a more polarizable chemical environment. Therefore, this might suggest that the site symmetry occupied by the Eu3+ ions in molybdates-tungstates does not have the character of a centrosymmetric chemical environment. Moreover, the higher emission quantum efficiency is obtained from the [K0.8Y0.63Eu3+0.08Zn0.02][Mo0.2W0.8O4] phosphors (η = 14.06%) than in CaMoO4:Eu3+ phosphors (η = 12.78%), which is due to appreciably decrease in nonradiative decay rates from the 5D0 level. But its quantum efficiency is much lower than commercial Y2O3:Eu3+’s (η = 55.6%) so there is a long way to go for application in the future.
IV. CONCLUSIONS
With 2 mol% Zn2+ ions doping and 2 mol% K+ ions charge compensation, [K0.82Y0.63Eu3+0.08Zn0.02][Mo0.2W0.8O4] photoluminescent materials with good luminescent properties were synthesized by solid-state method and its possible energy transfer mechanism were mentioned. From the perspective of its crystal structure and emission mechanism, quantum efficiency is improved due to WO6 introduced into the host and is still low for relaxes between energy levels occur so plenty of energy is lost in the transfer process. According to the characteristics of reduced matrix for 5D0 → 7FJ transitions, J-O transition parameters Ω2 and Ω4 can be calculated, Ω2 = 7.61 × 10⁻²⁰ cm2 and Ω4 = 0.713 × 10⁻²⁰ cm2, from Eu3+ ions emission spectrum under 395 nm excitation and energy transfer efficiency is improved, η = 14.06% (compared to CaMoO4, η = 12.78%). So Eu3+ ions can be used as an efficient spectroprobe in studying the microstructure of materials.
ACKNOWLEDGMENTS
The authors are grateful for Anhui Provincial Natural Science Foundation of Education Agency of China (Grant.No.KJ2011Z032 and Grant.No.KJ2009A69), Anhui Provincial Natural Science Foundation (Grant.No.090414150) of China, and Anhui Provincial International Cooperation of Science and Technology Agency of China (Grant No.09080703019).