Implications
Post-gastric placement of the hindgut in equids limits the amount and type of nutrients that reach these compartments. It is possible that the microbial population that inhabits these compartments is adapted to an environment where substrate degradation could be maximized in detriment of microbial protein synthesis. To provide additional information on the estimation of nitrogen requirements of the microbial population and on the efficiency of microbial protein synthesis of the equine hindgut population, this study focussed on in vitro utilization of protein (casein) and non-protein (urea) nitrogen by equine caecal contents. Results herein presented indicate that the caecal microbial population use urea nitrogen, but less efficiently than casein in terms of microbial growth.
Introduction
The efficiency of post-gastric fermentative activity in equids depends on substrate availability and it is influenced by feed intake, diet composition and pre-caecal digestibility of the feed. In general, this means that most soluble dietary nitrogen (protein and non-protein) and non-structural carbohydrates may not reach the hindgut, or do so in low amounts (Martin-Rosset and Tisserand, Reference Martin-Rosset and Tisserand2004). In contrast, cell wall carbohydrates and bound forms of nitrogen (N) will reach the hindgut as hydrolysis of these constituents in the pre-caecal environment is quite low (Martin-Rosset and Tisserand, Reference Martin-Rosset and Tisserand2004).
The extent to which hindgut bacteria utilize protein and non-protein N is not well understood. Caecal bacteria show proteolytic activity, and although caecal isolates have been shown to use ammonia and urea as N sources for microbial growth, many caecal bacteria can use N sources other than ammonia or urea for growth (Maczulak et al., Reference Maczulak, Dawson and Baker1985). Nitrogen balance studies have shown that urea is utilized in the equine gastrointestinal tract (Slade et al., Reference Slade, Robinson and Casey1970; Houpt and Houpt, Reference Houpt and Houpt1971; Prior et al., Reference Prior, Hintz, Lowe and Visek1974). Prior et al. (Reference Prior, Hintz, Lowe and Visek1974) reported that in ponies 60% to 65% of urea was released in the intestine, and 50% of it would be recycled. Urease activity in caecal fluid has also been previously reported. However, it was only 17% to 25% of that reported in bovine rumen fluid (Hintz and Schryver, Reference Hintz and Schryver1972). Nevertheless, latter studies (Cheng and Wallace, Reference Cheng and Wallace1979) have demonstrated that a large amount of the urease activity can be associated with bacteria adherent to the rumen epithelium; this can also be the case in equids, and therefore urease activity values can be higher.
The gas production technique was developed to determine fermentation characteristics of organic matter (OM; Steingass, Reference Steingass1983). Originally developed for ruminants (Menke et al., Reference Menke, Raab, Salewski, Steingass, Fritz and Schneider1979), the cumulative gas production technique has been adapted to allow its utilization in horses (Lowman et al., Reference Lowman, Theodorou, Longland and Cuddeford1996; Jansen et al., Reference Jansen, Cone, Geelen, Sloet van Oldruitenborgh-Oosterbaan, Van Gelder, Oude Elferink and Beynen2007). Recently, Cone et al. (Reference Cone, Jongbloed, Van Gelder and De Lange2005 and Reference Cone, Rodrigues, Guedes and Blok2009) adapted this technique to describe the protein fermentation characteristics of different feedstuffs. To achieve this, incubations were carried out with an excess of rapidly fermenting carbohydrates (glucose, starch and xylose). Incubations performed in an N-free environment makes N the limiting factor for microbial growth. Thus, microbial growth will depend on the availability of N from the samples that are incubated (Cone et al., Reference Cone, Jongbloed, Van Gelder and De Lange2005). Gas production is a reflection of substrate fermentation into short-chain fatty acids. The other nutritionally important fermentation product is microbial biomass. Although both these products are linked by ATP production, it is well known that different amounts of microbial biomass can be produced per unit of ATP (Y ATP; Hespell and Bryant, Reference Hespell and Bryant1979; Harrison and McAllan, Reference Harrison and McAllan1980; Demeyer, Reference Demeyer1991). This can impose an inverse relationship upon the production of short-chain fatty acids and microbial biomass yield (Preston and Leng, Reference Preston and Leng1987). It has been shown that this relationship also applies to in vitro gas production and microbial biomass yield when both variables are related to a unit of the substrate fermented (Blümmel et al., Reference Blümmel, Steingass and Becker1997).
As protein N is expected to reach the equine caecum in low amounts, we hypothesized that the caecal microbial population is well adapted to use urea as N source. The aim of this study was to access the fermentative response of caecal microbial population to an environment where N was the limiting nutrient. For this purpose, the effects of protein (casein) and non-protein (urea) N on the equine caecal fluid fermentation parameters and microbial growth efficiency were accessed using the gas production technique.
Material and methods
Gas production incubations
In this study, three horses (350 ± 10 kg BW) fitted with a permanent caecal cannula were used as caecal fluid donors. Animals were fed with a diet that consisted of 1.5 kg of commercial concentrate feed offered in two meals (0900 and 1600 h) and ad libitum meadow hay. The diet level was based on the criteria previously defined by the Institut National de la Recherche Agronomique (INRA) for a resting horse housed in a box (INRA, 1990). The animals had free access to water and to mineral–vitamin blocks, and were allowed to walk for 20 min every day. Caecal fluid was withdrawn 2 h after the morning meal into pre-warmed insulated flasks, previously filled with CO2. Caecal fluid was then strained through eight layers of cheesecloth and kept at 39°C under a constant flux of CO2. Incubations were performed using methods previously described by Cone et al. (Reference Cone, Van Gelder, Visscher and Oudshoom1996) with minor modifications. The buffer–mineral solution was N-free and contained 10.03 g/l NaHCO3, 1.43 g/l Na2HPO4, 1.55 g/l KH2PO4, 0.15 g/l MgSO4·7H2O, 0.52 g/l Na2S, 0.017 g/l CaCl2·2H2O, 0.015 g/l MnCl2·4H2O, 0.002 g/l CoCl3·6H2O, 0.012 g/l FeCl3·6H2O and 0.125 mg/l resazurin. To avoid a high input of N, caecal fluid was diluted 1 : 10 (v/v) with the buffer–mineral solution. To ensure that N was the limiting factor for fermentation, 10 g/l of rapidly fermentable carbohydrates (glucose, 3.33 g/l; xylose, 3.33 g/l and soluble starch, 3.33 g/l) were added to the buffered caecal fluid and incubated at 39°C (Cone et al., Reference Cone, Rodrigues, Guedes and Blok2009).
To determine when N would become limiting for microbial growth, an incubation assay was performed for 24 h using buffered caecal fluid with an excess of carbohydrates. Gas production along with NH3-N concentrations were measured. The results showed that a 2-h incubation period was necessary to ensure that N was the limiting nutrient in the medium. Consequently, this procedure was followed for all incubation trials.
Incubations were performed in 250 ml fermentation bottles (Schott, Mainz, Germany) using 60 ml of the buffered caecal fluid containing 3.7, 6.3, 12.5 or 25 mg of N in the form of casein or urea, designed as C3−C6−C12 and C25 or U3−U6−U12 and U25, respectively, in the results. Laboratory processing of samples was done under continuous flushing with CO2. All samples were incubated in duplicate with three repetitions in time. Gas production was recorded for 24 h, using a fully automated system (Cone et al., Reference Cone, Van Gelder, Visscher and Oudshoom1996).
Chemical analysis
Determination of pH, volatile fatty acids (VFA), NH3-N and quantification of purine bases were performed after the 24 h fermentation. pH values of the inoculum and fermentation medium were measured with a digital pH meter (Wissenschaftlich-Technische Werkstätten, pH 530, Weilheim, Germany).
Fermentation media from the gas production were sequentially centrifuged at 500 × g for 5 min at 4°C, and the supernatants were centrifuged at 20 000 × g for 20 min, at the same temperature. The final supernatants were frozen for subsequent VFA and NH3-N analysis. The residues (bacterial pellets) were frozen and then lyophilized for subsequent purine quantification.
NH3-N was analysed according to Conway (Reference Conway1950). The VFA concentrations in the fermentation medium after the incubations were analysed using GLC (Shimadzu GC-141 B, Kyoto, Japan) equipped with a flame-ionization detector and a capillary column (SUPELCO Nukol, 30 m × 0.25 mm i.d.; 0.25 μm film) using pivalic acid (0.4 M) as the internal standard (Czerkawski, Reference Czerkawski1976). The area for each VFA (i.e. acetate, propionate, butyrate, isovalerate and valerate) was compared with the internal standard.
Adenine and guanine were identified and quantified in bacterial pellets using a previously reported method (Reynal and Broderick, Reference Reynal and Broderick2009) with some modifications. The HPLC used was a Gilson system (805 manometric module, 811C dynamic mixer, 305 and 306 pumps and 234 auto-injector) in combination with a Jones 7971 column heater (set at 28°C) and a Finnigan ‘Surveyor’ photodiode-array detector (set to collect data specifically at 254 nm and over the range 200 to 600 nm). The column used was an ACE C18 reverse-phase column (250 × 4.6 mm, 5 μm). The solvents used were A (0.3 M potassium dihydrogen phosphate adjusted to pH 4 and filtered using a Millipore system with a 0.45 μm filter and then vacuum/ultrasound degassed) and solvent B (80% v/v solvent A with 20% v/v 100% HPLC-grade acetonitrile, which was filtered using a Millipore system with a 0.45 μm filter and then vacuum/ultrasound degassed). Injection volume of the samples was 10 μl. The flow rate was 1 ml/min and the linear gradients were as follows: T = 0 min (100% A), T = 7 min (100% A), T = 20 min (50% A, 50% B), T = 25 min (100% B), T = 30 min (100% B), T = 35 min (100% A) and T = 45 min (100% A). Calibration curves with pure adenine and guanine were constructed by 10 μl injection of 25, 50, 100, 250 and 500 μM standards.
Calculations
Data on VFA, NH3-N, purine bases and gas production were used to estimate microbial protein synthesis, VFA production and ATP production. Microbial biomass was estimated using purine bases (adenine + guanine) as markers (Zinn and Owens, Reference Zinn and Owens1986). Data from VFA production and application of the stoichiometric theoretical equations (Demeyer, Reference Demeyer1991; Van Soest, Reference Van Soest1994; Groot et al., Reference Groot, Williams, Oostdam, Boer and Tamminga1998) allowed the estimation of ATP production. For ATP production estimates, 1 mmol acetate (C2) = 2 mmol ATP, 1 mmol propionate (C3) = 3 mmol ATP (assuming that all propionate is generated by the succinate pathway), or 1 mmol propionate (C3) = 1 mmol ATP (assuming that all propionate is generated by the acrylate pathway), 1 mmol butyrate (C4) = 3 mmol ATP and 1 mmol methane = 1 mmol ATP (Van Soest, Reference Van Soest1994; Groot et al., Reference Groot, Williams, Oostdam, Boer and Tamminga1998). The molar proportions of CO2 and CH4 in the gas produced should be derived, as only acetate and butyrate account for direct gas production. From stoichiometric equations it can be calculated that CO2 = (C2/2) + (C3/4) + (3C4/2) and CH4 = C2 + 2C4−CO2 (Van Soest, Reference Van Soest1994; Groot et al., Reference Groot, Williams, Oostdam, Boer and Tamminga1998).
Microbial protein synthesis efficiency is related to ATP production (Y ATP), defined as the weight (mg) of microbial cells that are produced by mmol of ATP available: Y ATP = mg MS (microbial biomass)/mmol ATP (Preston and Leng, Reference Preston and Leng1987). Microbial protein synthesis related to the amount of gas produced was estimated: E gas = mg microbial biomass/ml of gas produced at 24 h.
Statistical analysis
The database was analysed as a 2 × 4 factorial arrangement on an incomplete block design with PROC MIXED of SAS (SAS Institute, 1999). The main factors were the type of N substrate (casein v. urea) and N levels (3.7, 6.3, 12.5 or 25 mg of N) and their interaction was included in the model as categorical fixed effects. The five incubation runs (blocks) were included in the model as a random effect. Polynomial contrasts for unequal spacing N levels were computed in Proc IML of SAS and used in the Proc MIXED model. When significant interactions were found, polynomial contrasts for N levels were determined independently on each data subset (casein and urea).
Results
Fermentation parameters
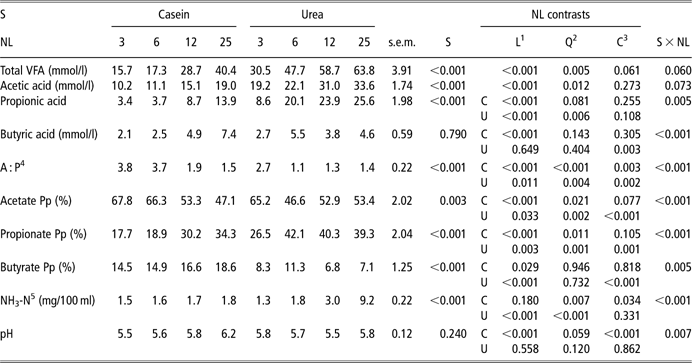
Table 1 presents values for fermentation parameters measured after a 24-h incubation period. Results show that the total VFA concentrations were higher (P < 0.001) when urea was the N source (on average 50.2 mmol/l with urea v. 25.5 mmol/l for casein). For both N sources, a quadratic (P < 0.01) increase of VFA concentrations with the level of substrate supplied was observed, mainly because of the similar values of total VFA production in the lower levels of N and because of the increase of VFA values in the higher N levels. Although the interaction between substrate and N level did not reach statistical significance (P < 0.1), it seems that VFA production for urea shows a steady increase trend, whereas for casein this is not the case.
Fermentation parameters measured after a 24-h fermentation period
S = substrate; NL = N level; VFA = volatile fatty acid.
Values with different superscripts in the same line are significantly different (P < 0.05).
1L – linear.
2Q – quadratic.
3C – cubic.
4A : P – acetate : propionate ratio.
5NH3-N – ammonia nitrogen.
Higher (P < 0.001) acetate and propionate concentrations were measured when urea was the N source. For both casein and urea, an increase in acetate concentrations was measured with the increase of N levels. Although propionate concentrations tended to increase with N level, this increase was different for casein and urea. Casein showed a linear (P < 0.001) increase, whereas urea showed a quadratic steady increase (P < 0.01). For butyrate, a linear increase (P < 0.001) was observed when casein was used, whereas a cubic (P < 0.01) response was observed for urea.
Higher (P < 0.001) A : P ratio was observed when casein was the N source. The A : P ratio was higher for the lowest N level (i.e. 3 mg N) for both casein and urea. Although results showed a trend for a decrease in this ratio with the increase of N level, this decrease was observed from U3 to U6 levels in urea, whereas for casein it was only observed from C6 to C12 levels. As a result, an interaction between N source and N level was observed (P < 0.001) and a cubic (P < 0.01 for casein and for urea) effect was observed. The same pattern of variation was also measured in the molar proportions of acetate. Molar proportions of propionate showed a quadratic (P < 0.05) increase for casein mainly because of similar values for the lower levels and an increase in the next two higher levels of N (i.e. C12 and C25), whereas in urea there was an increase and then a decrease in propionate concentration denoting a cubic (P < 0.01) effect. Butyrate proportions increased linearly (P < 0.05) for casein levels and had a cubic (P < 0.001) effect for urea.
Results showed similar NH3-N concentrations for all casein levels and for the lower (i.e. U3 and U6) urea levels. However, NH3-N concentrations increased when the urea level was raised to 12 and to 25 mg of N, resulting in an interaction (P < 0.001) between N source and N level. There was no influence of N source on the pH of the fermentation media. However, pH values increased for the highest casein level, whereas no differences for urea levels were observed, leading to an interaction (P < 0.01) between N source and N level.
Gas production
Table 2 shows the gas production values obtained during the in vitro fermentation with increasing levels of casein and urea. The volume of gas produced after 6 h of incubation was similar for both N sources and N levels. However, at 12 h of incubation, urea showed higher (P < 0.01) gas production, but no influence of N level was observed. Gas production at 24 h was higher (P < 0.05) for urea, and showed a quadratic increase with N level for both casein (P < 0.05) and urea (P < 0.01); nevertheless, urea showed a steady increase, whereas this was not the case for casein.
Cumulative gas production (ml) at 6, 12 and 24 hours of fermentation

S = substrate; NL = N level.
1L – linear.
2Q – quadratic.
3C – cubic.
Efficiency of microbial growth
Estimates of microbial biomass, ATP(S), ATP(A) and efficiency of microbial growth related to ATP availability (Y ATP(S) and Y ATP(A)) and to gas production (E gas) are presented in Table 3. By relating microbial biomass (mg) with the estimated ATP produced (mmol), estimates of efficiency of microbial growth (Y ATP) were calculated for both succinate (Y ATP(S)) and acrylate (Y ATP(A)) metabolic pathway.
Microbial biomass (mg), estimated ATP yield (mmol), Y ATP and efficiency of microbial growth related to gas production (E gas) after a 24-h fermentation period

S = substrate; NL = N level.
1L – linear.
2Q – quadratic.
3C – cubic.
4ATPS – ATP yield estimated assuming propionate is generated by succinate pathway.
5ATPA – ATP yield estimated assuming propionate is generated by acrilate pathway.
6Y ATP(S) – microbial growth efficiency (mg/mmol) computed using ATPS.
7Y ATP(A) – microbial growth efficiency (mg/mmol) computed using ATPA.
8E gas – microbial growth efficiency related to gas production (mg/ml).
In general, a decrease in the Y ATP was observed when increasing the N levels in both the N sources. However, a distinct evolution of Y ATP values was observed when N supply increased from 3 to 6 mg of N for urea and casein. The highest Y ATP for urea was observed at the lowest N level (U3-23.4), whereas for casein the higher efficiency was observed for C6 (36.5). As a consequence, an interaction (P < 0.01) for Y ATP(S) and P < 0.001 for Y ATP(A) between N source and N level and a cubic effect were observed. The same tendency was observed for E gas; however, for casein, the highest value was observed at C12 (1.34).
Discussion
Molar percentages of VFA are generally within values reported for the large intestine of horses. A propionate-directed fermentation would be expected as the presence of rapidly fermentable carbohydrates in the medium would enhance the growth of the non-fibrolytic bacterial population. Results, herein presented, should take into account the decrease of pH to values lower than it would be expected in these type of cultures. Limitations in the buffer capacity because of the excess of rapidly fermentable carbohydrates in the medium should be analysed in future studies.
When casein is the sole N source, amylolytic bacteria with proteolytic activity can likely prevail. There is evidence that caecal bacteria have proteolytic activity (Maczulak et al., Reference Maczulak, Dawson and Baker1985) and that the growth of the proteolytic microbial population can be stimulated by soya supplementation (Julliand and Tisserand, Reference Julliand and Tisserand1992). In this study, the increasing levels of casein as the sole source of N could have promoted a higher development of this microbial population, explaining the relatively constant NH3-N concentrations. Casein fermentation was generally characterized by lower total VFA, NH3-N, total gas production and by a higher Y ATP and A : P. These results support the previous idea of an adaptation of the microbial population to an environment with low nutrient limitation to microbial growth. In ruminants, one of the major factors that influence microbial cell synthesis is the availability and/or concentration in rumen fluid of precursors (glucose, amino acids, nucleic acids, peptides, ammonia and minerals Preston and Leng, Reference Preston and Leng1987). The higher Y ATP values for casein (24.3 on average) can be a reflection of the lower VFA production and ATP estimates, indicating that a higher percentage of fermentable OM is converted into microbial cells. Higher microbial growth efficiency has been associated with protein N by several authors working with rumen bacteria. Maeng et al. (Reference Maeng, Van Nevel, Baldwin and Morris1976), using rumen wash cell suspensions in vitro, referred to a marked increase in microbial growth when casein was added to the incubation medium. The same authors also reported that when urea was the sole source of N, growth was likely depressed because of a lack of required amino acids. Argyle and Baldwin (Reference Argyle and Baldwin1989) reported that in vitro batch cultures of mixed rumen bacteria grew 60% to 400% more efficiently when amino acids or peptides were present. Nevertheless, we should point out that ATP production can be influenced by several factors, namely low pH and amount of microbial protein synthesis, and in vitro batch cultures may be more prone to these effects.
Growth efficiency (Y ATP) estimated with either metabolic pathways (acrylate or succinate) reached a peak at C6 with a large decrease for higher casein levels. One possible explanation for this is the fact that, although casein is a soluble N source and therefore immediately available in the environment, microorganisms have to break it down into amino acids and ammonia in order to incorporate it. Slowing down peptide breakdown would decrease the conversion of protein N to amino acids, and hence ammonia. Broderick and Wallace (Reference Broderick and Wallace1988) observed that peptides accumulate in the rumen of sheep fed casein as a protein supplement, but the same did not occur when a more slowly degradable protein (egg albumin) was used, concluding that rapidly hydrolysable proteins could lead to peptide accumulation.
Microbial growth efficiency was lower with urea and, the higher Y ATP was observed in the lower N level (U3), decreasing thereafter as the N level increased. In addition, at this level of urea, NH3-N concentrations were also low (1.3 mg/100 ml). Kang-Meznarich and Broderick (Reference Kang-Meznarich and Broderick1981), by testing the effects of increasing urea supplementation on rumen bacterial formation, refer to 8.5 mg/100 ml as the optimal concentration for promoting microbial protein synthesis. These authors refer that the patterns of bacterial CP synthesis tended to peak at 13.8 mg/100 ml. In addition, Belasco (Reference Belasco1954) reported a decrease in the efficiency of utilization at higher levels of urea. According to this author, it is probable that the hydrolysis of urea to ammonia and carbon dioxide exceeded the rate of ammonia utilization by the microorganisms, as also suggested by Cone et al. (Reference Cone, Jongbloed, Van Gelder and De Lange2005). In this study, this decrease was marked at the higher level of N (U25) as NH3-N concentration increased, whereas it was relatively constant at the lower levels of urea N, probably indicating that the ammonia utilization rate was decreasing; this can also be observed by the quadratic effect observed for urea. This higher ammonia concentration may also have accounted for the gas production values of the higher level of urea compared with that of casein. According to the VFA data, a higher total gas production would be expected in the urea incubation trials. Nevertheless, one must take into account that the fast degradation of urea, leading to the accumulation of NH3-N in the incubation medium, may have prevented the release of CO2, in the incubation vessels, explaining a temporary lower gas production (Cone et al. Reference Cone, Jongbloed, Van Gelder and De Lange2005). Hintz and Schryver (Reference Hintz and Schryver1972) suggested that the horse can utilize some urea, but the important question is how efficiently and at what levels this process may occur. Results of this study show that there is still fermentation at high urea levels, although a decrease in Y ATP was observed.
Conclusions
Compared with the rumen ecosystem, very little is known about hindgut activity in the horse. Information concerning the metabolism of this microbial population and its requirements is lacking. This study presents information regarding in vitro fermentative responses of caecal microbial population to N sources: casein and urea. By ensuring that energy was never limiting, microbial activity and N fermentation could be characterized. Results herein presented indicate that the caecal microbial population responds differently to casein and to urea. Casein is used with higher efficiency, and promotes a higher microbial growth and fermentative activity, as it would be expected and reported for rumen microbial population. Results obtained with urea showed lower growth efficiency; however, total amounts of VFA and gas production were higher when urea was the N source. Possible adaptation mechanisms of the microbial population to an environment where protein N is limiting, thus promoting VFA production in detriment of microbial protein synthesis, may explain these results.
Nevertheless, methodological issues should be addressed. The fact that pH dropped lower than expected in our batch vessels can be an indicator that the buffer capacity was exceeded, and could have influenced ATP estimations. This should be addressed in future studies. In addition, future studies should include microbial characterization in order to access eventual shifts in different types of bacteria.
Acknowledgements
A. S. Santos was funded by the Portuguese Foundation for Science and Technology Doctoral Grant SFRH/BD/31294/2006.