Introduction
Schizophrenia (Sz) is a severe psychiatric disorder that involves ineffective or inefficient communication between brain regions from neuroimaging evidence (Dong, Wang, Chang, Luo, & Yao, Reference Dong, Wang, Chang, Luo and Yao2018). Although the pathological mechanism of SZ is unclear, the results of accumulated evidence have suggested widespread local abnormalities in several brain regions, including the insula (Moran et al., Reference Moran, Tagamets, Sampath, O'Donnell, Stein, Kochunov and Hong2013), hippocampus (Ho et al., Reference Ho, Iglesias, Sum, Kuswanto, Sitoh, De Souza and Holt2017), thalamus (Pergola, Selvaggi, Trizio, Bertolino, & Blasi, Reference Pergola, Selvaggi, Trizio, Bertolino and Blasi2015; Wang et al., Reference Wang, Jiang, Tang, Xia, Curtin, Li and Wang2020), striatum (Duan et al., Reference Duan, Chen, He, Jiang, Jiang, Xie and Yao2015; McCutcheon, Abi-Dargham, & Howes, Reference McCutcheon, Abi-Dargham and Howes2019), frontal lobes (Chen et al., Reference Chen, Liu, He, Chang, Jiang, Li and Yao2017a), temporal regions (Jiang et al., Reference Jiang, Luo, Li, Duan, He, Chen and Yao2018) and cerebellum (Dong et al., Reference Dong, Luo, Guell, Wang, He, Duan and Yao2020). Previous studies have also reported that some neural circuits or pathways, such as the prefrontal-thalamic-cerebellar pathway (Gong et al., Reference Gong, Luo, Li, Jiang, Khundrakpam, Duan and Yao2019; Guo et al., Reference Guo, Liu, Liu, Yu, Zhang, Zhang and Zhao2015; Jiang et al., Reference Jiang, Duan, Chen, Zhang, Gong, Dong and Yao2019a) and the triple network circuit of the salience, default mode and central executive networks (Dong et al., Reference Dong, Wang, Chang, Luo and Yao2018; Menon, Reference Menon2011), play important roles in the pathophysiology of SZ. These findings suggest that this disease is associated with global topological disruptions of large-scale brain networks in patients with SZ.
In general, large-scale brain networks can be summarized into structural networks (anatomical connectivity) and functional networks (temporal synchronization) (Bullmore & Sporns, Reference Bullmore and Sporns2009). Using diffusion tensor imaging (DTI), anatomical connections (i.e. fibre tracts) between distinct brain regions can be estimated to build a structural network, which uncovers the structural architecture in brain white matter (WM). However, it fails to provide temporal dynamic information, which may carry functional significance in WM. Based on the blood oxygen level-dependent (BOLD)-functional magnetic resonance imaging (fMRI), the functional network is usually calculated by temporal correlations between BOLD-fMRI signals among distributed brain regions, which is thought to reflect neural activity or relevant functions that occur in grey matter (GM). Investigations on the WM structural network or GM functional network have ignored the presence of potential functional information in WM, although they provide precise details concerning brain network architecture.
In recent years, increasingly more works have indicated that brain functional activation in WM can be detected by using BOLD-fMRI. For instance, specific regions of the corpus callosum were shown to be functionally activated in multiple tasks, such as interhemispheric transfer tasks (Courtemanche, Sparrey, Song, MacKay, & D'Arcy, Reference Courtemanche, Sparrey, Song, MacKay and D'Arcy2018; Gawryluk, Mazerolle, Beyea, & D'Arcy, Reference Gawryluk, Mazerolle, Beyea and D'Arcy2014a). Low-frequency BOLD fluctuations in specific WM tracts can be modulated by different behaviour tasks (Huang et al., Reference Huang, Bailey, Wang, Cutting, Gore and Ding2018; Marussich, Lu, Wen, & Liu, Reference Marussich, Lu, Wen and Liu2017; Wu et al., Reference Wu, Yang, Bailey, Zhou, Cutting, Gore and Ding2017). In particular, recent work demonstrated that compared with cortical GM, WM tracts exhibited reduced magnitudes, delayed onsets and prolonged initial dips in haemodynamic response function (Li, Newton, Anderson, Ding, & Gore, Reference Li, Newton, Anderson, Ding and Gore2019b). More than task-state fMRI, resting-state BOLD-fMRI signals within WM showed an intrinsic functional organization rather than random noise, similar to GM functional networks (Jiang et al., Reference Jiang, Luo, Li, Li, Yang, Li and Yao2019b; Peer, Nitzan, Bick, Levin, & Arzyt, Reference Peer, Nitzan, Bick, Levin and Arzyt2017). Moreover, specific WM tracts, identified from BOLD-fMRI signals, showed a similar pattern with the fibre bundles from DTI tracking in the human brain (Marussich et al., Reference Marussich, Lu, Wen and Liu2017; Peer et al., Reference Peer, Nitzan, Bick, Levin and Arzyt2017). Furthermore, histological evidence reconfirmed the similarities between functional connectivity and anatomical connectivity in non-human primate brains (Wu et al., Reference Wu, Wang, Li, Schilling, Gao, Anderson and Gore2019). In addition to healthy brains, WM functional connectivity has been reported to be altered in abnormal brains, including in individuals with mild cognitive impairment, epilepsy, schizophrenia, Alzheimer's disease and Parkinson's disease (Chen et al., Reference Chen, Zhang, Zhang, Shen, Lee and Shen2017b; Ji et al., Reference Ji, Ren, Li, Sun, Liu, Gao and Wang2019; Jiang et al., Reference Jiang, Song, Li, Zhang, Chen, Jiang and Luo2019c; Makedonov, Chen, Masellis, MacIntosh, & Alzheimer's Disease Neuroimaging, Reference Makedonov, Chen, Masellis and MacIntosh2016). This evidence from multi-state (tasks and resting-state) and multi-modal MRI (BOLD-fMRI and DTI) findings in multiple brain types (healthy, abnormal and non-human brains) converges to support WM functional information revealed by BOLD-fMRI.
While previous studies investigated functional interactions among specific WM tracts, we wanted to further examine the features of the functional connectome of large-scale networks in WM, which could reflect some differences in brain network architectures or mechanisms. Graph theoretical analysis is an effective approach to characterize topological features of brain networks (Bullmore & Sporns, Reference Bullmore and Sporns2009). Findings revealed after applying graph theory to GM functional networks have suggested that GM functional networks are organized to allow optimized efficiency, such as that observed in small-worldness (Bullmore & Sporns, Reference Bullmore and Sporns2009). Combined with graph-theoretical analyses, a large-scale WM functional network has promised a new way to characterize the topological properties of functional networks in WM and has improved our understanding of WM dysfunctions that underlie the clinical symptoms of SZ. In addition, while previous studies used resting-state fMRI and graph theory approaches to investigate the topological organization of the functional connectome in patients with SZ (Yu et al., Reference Yu, Dai, Tang, Wang, Zhang, Sha and Zhang2017), they ignored WM functional information that was potentially available. Here, to extend our understanding of schizophrenia from the topological organization of brain WM network architectures, we investigated the resting-state large-scale WM functional network in a large cohort of patients with SZ (n = 97) and healthy subjects (n = 126). Graph theoretical analysis was utilized to quantify the topological organization in the WM functional network. By comparing the differences in topological properties between patients and controls, we explored the disorganisation of the WM functional connectome within schizophrenia pathophysiology.
Methods
Subjects and MRI acquisition
In total, 97 patients with SZ (29 females; age: 41.0 ± 11.5 years) and 126 healthy subjects (HC) (42 females; age: 38.0 ± 14.9 years) who matched in age, gender and education were recruited from the Clinical Hospital of Chengdu Brain Science Institute (CHCBSI) of China. All of the SZ patients were diagnosed according to the Diagnostic and Statistical Manual of Mental Disorder, Fourth Edition (DSM-IV). Of the 97 SZ patients, two were first-episode patients and 95 were chronic patients. All patients received antipsychotics medication [Chlorpromazine (CPZ) equivalents = 324.5 ± 157.1 mg/day]. Clinical symptoms were evaluated by the Positive and Negative Syndrome Scale (PANSS). Participants with a history of major medical or neurological abnormalities, substance abuse, or other contraindications to MRI were excluded from the current study. To further eliminate the potential familial effects, we also excluded the healthy subjects whose first- and second-degree relatives have a history with mental disorders. Written informed consent was signed from each participant before the MRI scanning. The Ethics Committee of CHCBSI approved this current study.
High-resolution T1-weighted images, resting-state fMRI and diffusion-weighted images were acquired in a 3.0 Tesla GE MRI scanner (DISCOVERY MR 750, USA) at the Centre for Information in Medicine of University of Electronic Science and Technology of China. Details of scanning parameters were obtained from our previous studies (Jiang et al., Reference Jiang, Luo, Li, Li, Yang, Li and Yao2019b).
Diffusion data processing
Diffusion images were analysed using the tract-based spatial statistics (TBSS) method in the FSL software (https://www.fmrib.ox.ac.uk/fsl). First, eddy current distortions and head motion correction, as well as brain extraction, were performed. For each subject, the fractional anisotropy (FA) map was estimated by fitting the diffusion tensor model. All subjects' FA maps were nonlinearly transformed into the MNI template. Subsequently, the averaged FA map across all subjects was thinned to create a FA skeleton image, which represented the major WM tracts common to the group. Finally, individual FA image was projected into the FA skeleton.
Functional image pre-processing
Functional images processing was performed using the SPM12 (http://www.fil.ion.ucl.ac.uk/spm/software/spm12), DPABI (http://www.restfmri.net) and FSL software. Image preprocessing was similar to our previous studies (Jiang et al., Reference Jiang, Luo, Li, Li, Yang, Li and Yao2019b). The first five volumes were removed. Slice timing correction and realignment was performed. Subjects with maximum motion >2 mm or 2° were excluded. The mean frame displacement (FD) was also calculated for each subject. Subsequently, a linear trend was removed for the signal drift correction. Nuisance signals, including the 24-parameter head motion, the mean CSF signal and scrubbing time points (FD >0.5 mm), were further regressed out by a multiple linear model. Then, the band-pass filtering (0.01–0.10 Hz) was performed to reduce potential physiological signals. Spatial smoothing (FWHM = 4 mm) was performed separately within the white matter or grey matter masks, which were obtained from the individual T1 images segmentation. Finally, functional images were normalized onto the MNI space and resampled into 3 mm3. It's important to be clear that the WM network construction was performed on the unsmoothed pre-normalized functional data. In addition, data quality control pipeline is also described in the online Supplementary Material.
Large-scale functional network in GM and WM
According to the Harvard-Oxford atlas (Desikan et al., Reference Desikan, Segonne, Fischl, Quinn, Dickerson, Blacker and Killiany2006), the cortical grey matter was divided into 96 regions of interest (ROIs). The averaged time series of each ROI was extracted from the normalized functional images for each subject. Then, Pearson's correlation coefficient was calculated between any two paired ROIs and further transformed to Fisher's z score. This resulted in a 96 × 96 correlation matrix for the GM of each participant.
For the WM, the JHU WM atlas was used to yield 48 tracts (21 tracts in each hemisphere and six commissure tracts). For each subject, the pre-normalization unsmoothed functional images were filtered (0.01–0.15 Hz) (Jiang et al., Reference Jiang, Luo, Li, Li, Yang, Li and Yao2019b; Peer et al., Reference Peer, Nitzan, Bick, Levin and Arzyt2017), then registered to the corresponding diffusion b0 image and then nonlinearly projected onto the FA skeleton using the transformation function from the TBSS analysis. This resulted in a series of skeletonized functional images. The averaged time series of each WM tract was extracted from the skeletonized functional images. A 48 × 48 correlation matrix for the WM was also produced using Pearson's correlation between each paired WM tract for each subject.
Network properties
We used GRETNA (http://www.nitrc.org/projects/gretna/) to analyse the network properties using graph theory.
First, each correlation matrix was further transformed into an undirected binarized matrix using a sparsity threshold. The sparsity of a network was computed as the ratio of the existing number of edges divided by the maximum possible number of edges for a given network. According to previous research (Yu et al., Reference Yu, Dai, Tang, Wang, Zhang, Sha and Zhang2017), we used a wide range of sparsity thresholds to binarize the correlation matrix. The range of the sparsity threshold was defined as follows: (1) the averaged degree (the degree of a node is the number of connections linked to the node) over all nodes of each binarized network was larger than 2 × log(N), where N is the number of nodes; and (2) the small-worldness of the binarized networks was larger than 1.1 for 90% of the subjects. A range of sparsity thresholds (WM network: 0.19–0.52, GM functional network: 0.11–0.46) could be preselected. To achieve a unified standard, we finally chose an overlapping range (0.19–0.46, with a step of 0.01) between the WM and GM networks.
Second, to characterize the topological properties of WM and GM networks, six global network parameters, including the clustering coefficient (Cp), shortest path length (Lp), local efficiency (E loc), small-worldness metric (σ), hierarchy (β) and synchronization (S), were calculated for the WM and GM network at each sparsity threshold. According to previous studies (Barahona & Pecora, Reference Barahona and Pecora2002), network synchronization is quantified by the eigenratio of the Laplacian matrix (coupling matrix) of the network. The lower eigenratio represents a more easily synchronized network. In addition, three nodal metrics, including the nodal degree (K nodal), nodal efficiency (E nodal) and nodal betweenness (B nodal), were utilized for regional topological measures. The rationale for each graphic parameter is listed in the online Supplementary Materials. The uses and interpretations of these complex network properties have been described in previous research (Chen, Hu, Chen, & Feng, Reference Chen, Hu, Chen and Feng2019; Rubinov & Sporns, Reference Rubinov and Sporns2010).
Third, to validate the nonrandomness of topological properties, WM and GM networks were compared to random networks. In line with previous studies, the generation of random networks was accomplished using a Markov chain algorithm, which could yield the same number of nodes, edges and degree of distribution as the matched actual brain networks. Furthermore, the z-score of each network parameter was calculated by subtracting the average of each parameter across random networks and then dividing it by the standard deviation of random networks.
Finally, the area under the curve (AUC) for each network parameter was calculated to yield a summarized scalar for the topological characterization of brain networks independent of a single threshold selection.
Statistical analysis
To investigate the differences of network topological properties between the SZ and HC groups, nonparametric permutation tests were performed. In brief, for each network parameter, we calculated the real difference value between the two groups. Then, we randomly assigned the group labels across all subjects and recalculated the difference value between the two randomized groups. This randomization procedure was repeated 100 000 times and thus yielded a distribution of the null hypothesis. According to the location of the real difference value within the distribution of the null hypothesis, a p value was assigned to the real difference. Statistical significance was assessed by the 95th percentiles of each distribution of the null hypothesis, corresponding to a type I error probability of 0.05 for a two-tailed test.
To further examine the associations between the altered nodal metrics (K nodal, E nodal and B nodal) and FA values, the WM tracts with altered nodal metrics were extracted and then Spearman rank correlation analysis was used to evaluate the correlation between the nodal metrics and FA for altered WM tracts in each group. Non-parametric permutation tests were performed to test the group interaction that whether the difference in correlations between SZ and HC groups is significant (online Supplementary Materials).
For the abnormal network metrics in the SZ group, we further explored the relationships between these metrics and PANSS symptom scores as well as illness duration by using Spearman rank correlation analysis.
Results
Demographic and clinical characteristics
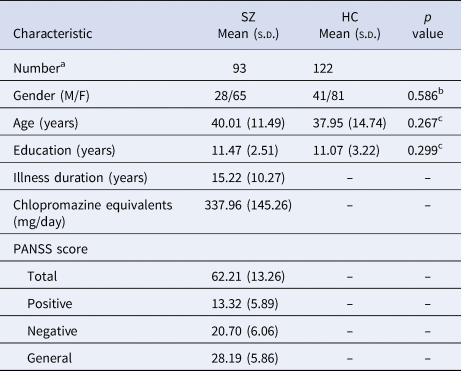
Four SZ patients and four HC were excluded because they failed to accomplish all of T1, resting-state fMRI and DTI data acquisitions, or their head-motion beyond 2 mm or 2°. The remaining 93 patients with SZ (28 females; age: 40.01 ± 11.49 years) and 122 HC (41 females; age: 37.95 ± 14.74 years) were matched in age (p = 0.267), gender (p = 0.586) and education (p = 0.299). Demographic and clinical characteristics of these subjects is provided in Table 1.
Demographic and clinical characteristics of subjects
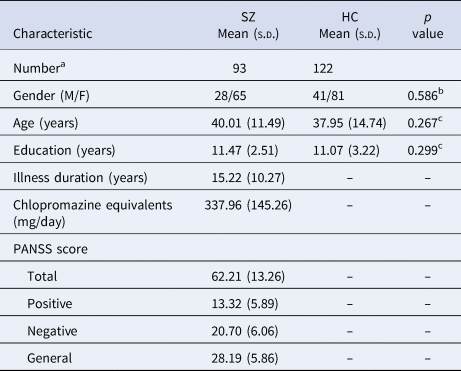
a Represents that four SZ patients and four HC were excluded from original database (97 SZ and 126 HC) because they failed to accomplish all of the T1, resting-state fMRI and DTI data acquisitions, or their head-motion beyond 2 mm or 2°.
b p value was obtained by the χ2 test..
c p value was obtained using the two-sample t test.
Global topological properties of functional brain networks in schizophrenia
For both the WM and GM networks, the small-worldness scalars in the two groups were larger than 1 at a sparsity threshold range of 0.19–0.46; i.e. the functional networks exhibited higher clustering coefficients, such as those associated with regular lattices, yet small shortest path lengths, such as those associated with random graphs. This indicated that both the WM and GM functional connectomes exhibited typical small-worldness topology.
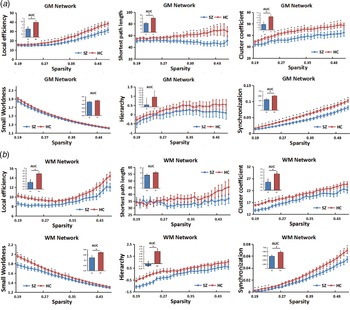
Between-group comparisons on the AUC of network properties showed that compared with the HC group, patients with SZ showed significantly lower values in E loc (p = 0.021), Lp (p = 0.019), Cp (p = 0.031) and synchronization (p = 0.003) for the GM functional network (Fig. 1a). No significant differences were observed in small-worldness (p = 0.248) and hierarchy (p = 0.424).
Group differences in the topological properties of functional (a) grey matter and (b) white matter networks between the schizophrenia patients and healthy controls. In the grey matter network, the area under curve of local efficiency (p = 0.021), shortest path length (p = 0.019), cluster coefficient (p = 0.031) and synchronization (p = 0.003) were significantly lower in the schizophrenia group compared to the healthy control group (according to the nonparametric permutation test). No significant differences were observed in small worldness (p = 0.248) and the hierarchy (p = 0.424) between the two groups. In the white matter network, the area under curve of local efficiency (p = 0.028), cluster coefficient (p = 0.047), small worldness (p = 0.025), hierarchy (p = 0.009) and synchronization (p = 0.042) were significantly lower in the schizophrenia (SZ) group compared to the healthy control (HC) group (according to the nonparametric permutation test). No significant differences were identified in the shortest path length (p = 0.286) between the two groups. Note: GM, grey matter; WM, white matter; SZ, schizophrenia; HC, healthy controls; AUC, area under curve.
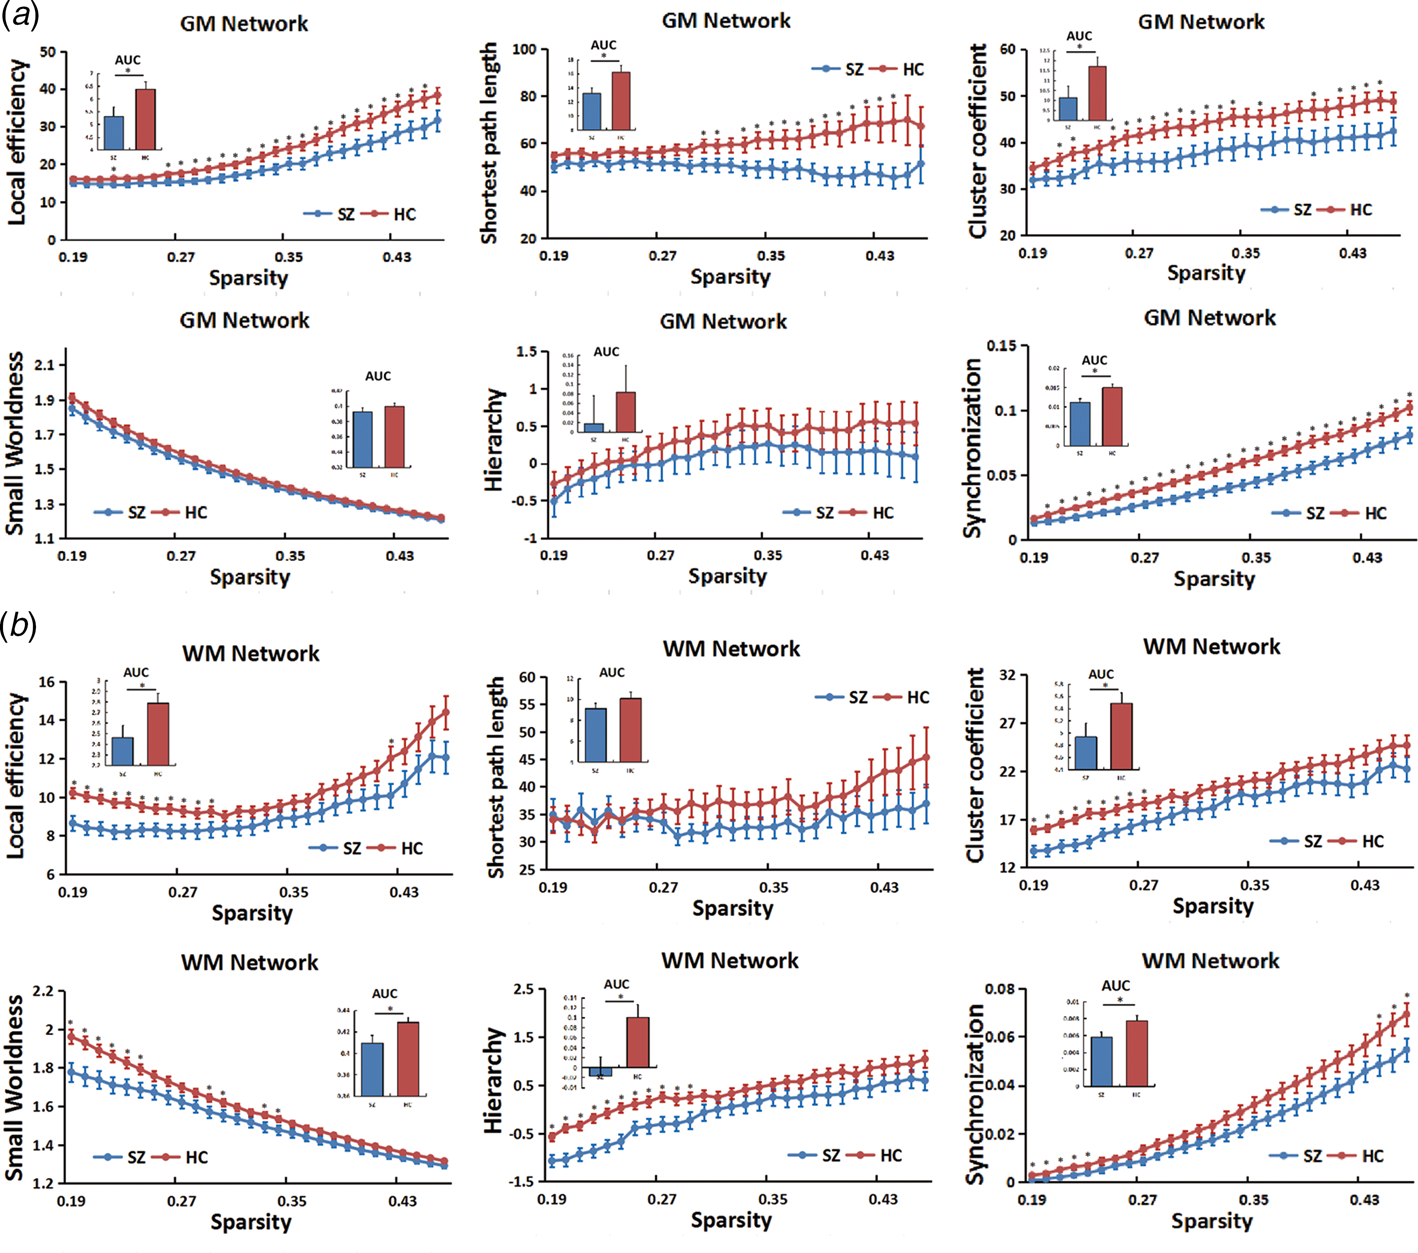
For the WM functional connectome, the SZ group exhibited significant reductions in Eloc (p = 0.028), Cp (p = 0.047), small-worldness (p = 0.025), hierarchy (p = 0.009) and synchronization (p = 0.042) compared with the HC group (Fig. 1b). There was no significant difference in Lp (p = 0.286).
These group differences were further validated through an additional stability analysis (online Supplementary Material).
Regional topological organization in schizophrenia
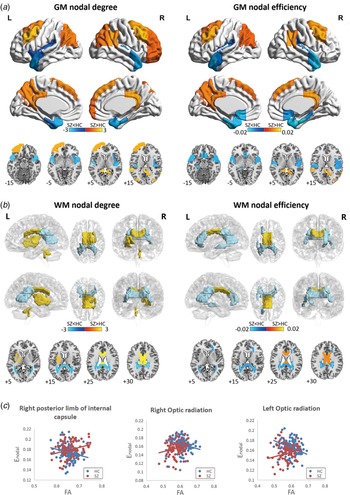
We further identified the cortical GM regions or WM tracts exhibiting significant group differences in nodal metrics (K nodal, E nodal and B nodal) in patients with SZ. K nodal and E nodal values showed a similar alteration pattern in the patient group (Fig. 2). No significant group difference was identified for the B nodal values.
Cortical grey matter regions (a) and white matter tracts (b) exhibiting abnormal nodal degree and nodal efficiency in patients with schizophrenia by using the nonparametric permutation test (p < 0.05, Bonferroni corrected). The colour bar indicates the between-group difference values; the yellow regions represent higher and blue regions represent lower nodal degree or nodal efficiency in the patient group compared with the control group. (c) Significant correlations between the Enodal and the FA values in the right posterior limb of internal capsule, left and right optic radiation in the HC group. Note: GM, grey matter; WM, white matter; SZ, schizophrenia; HC, healthy controls; L, left; R, right; FA, fractional anisotropy.
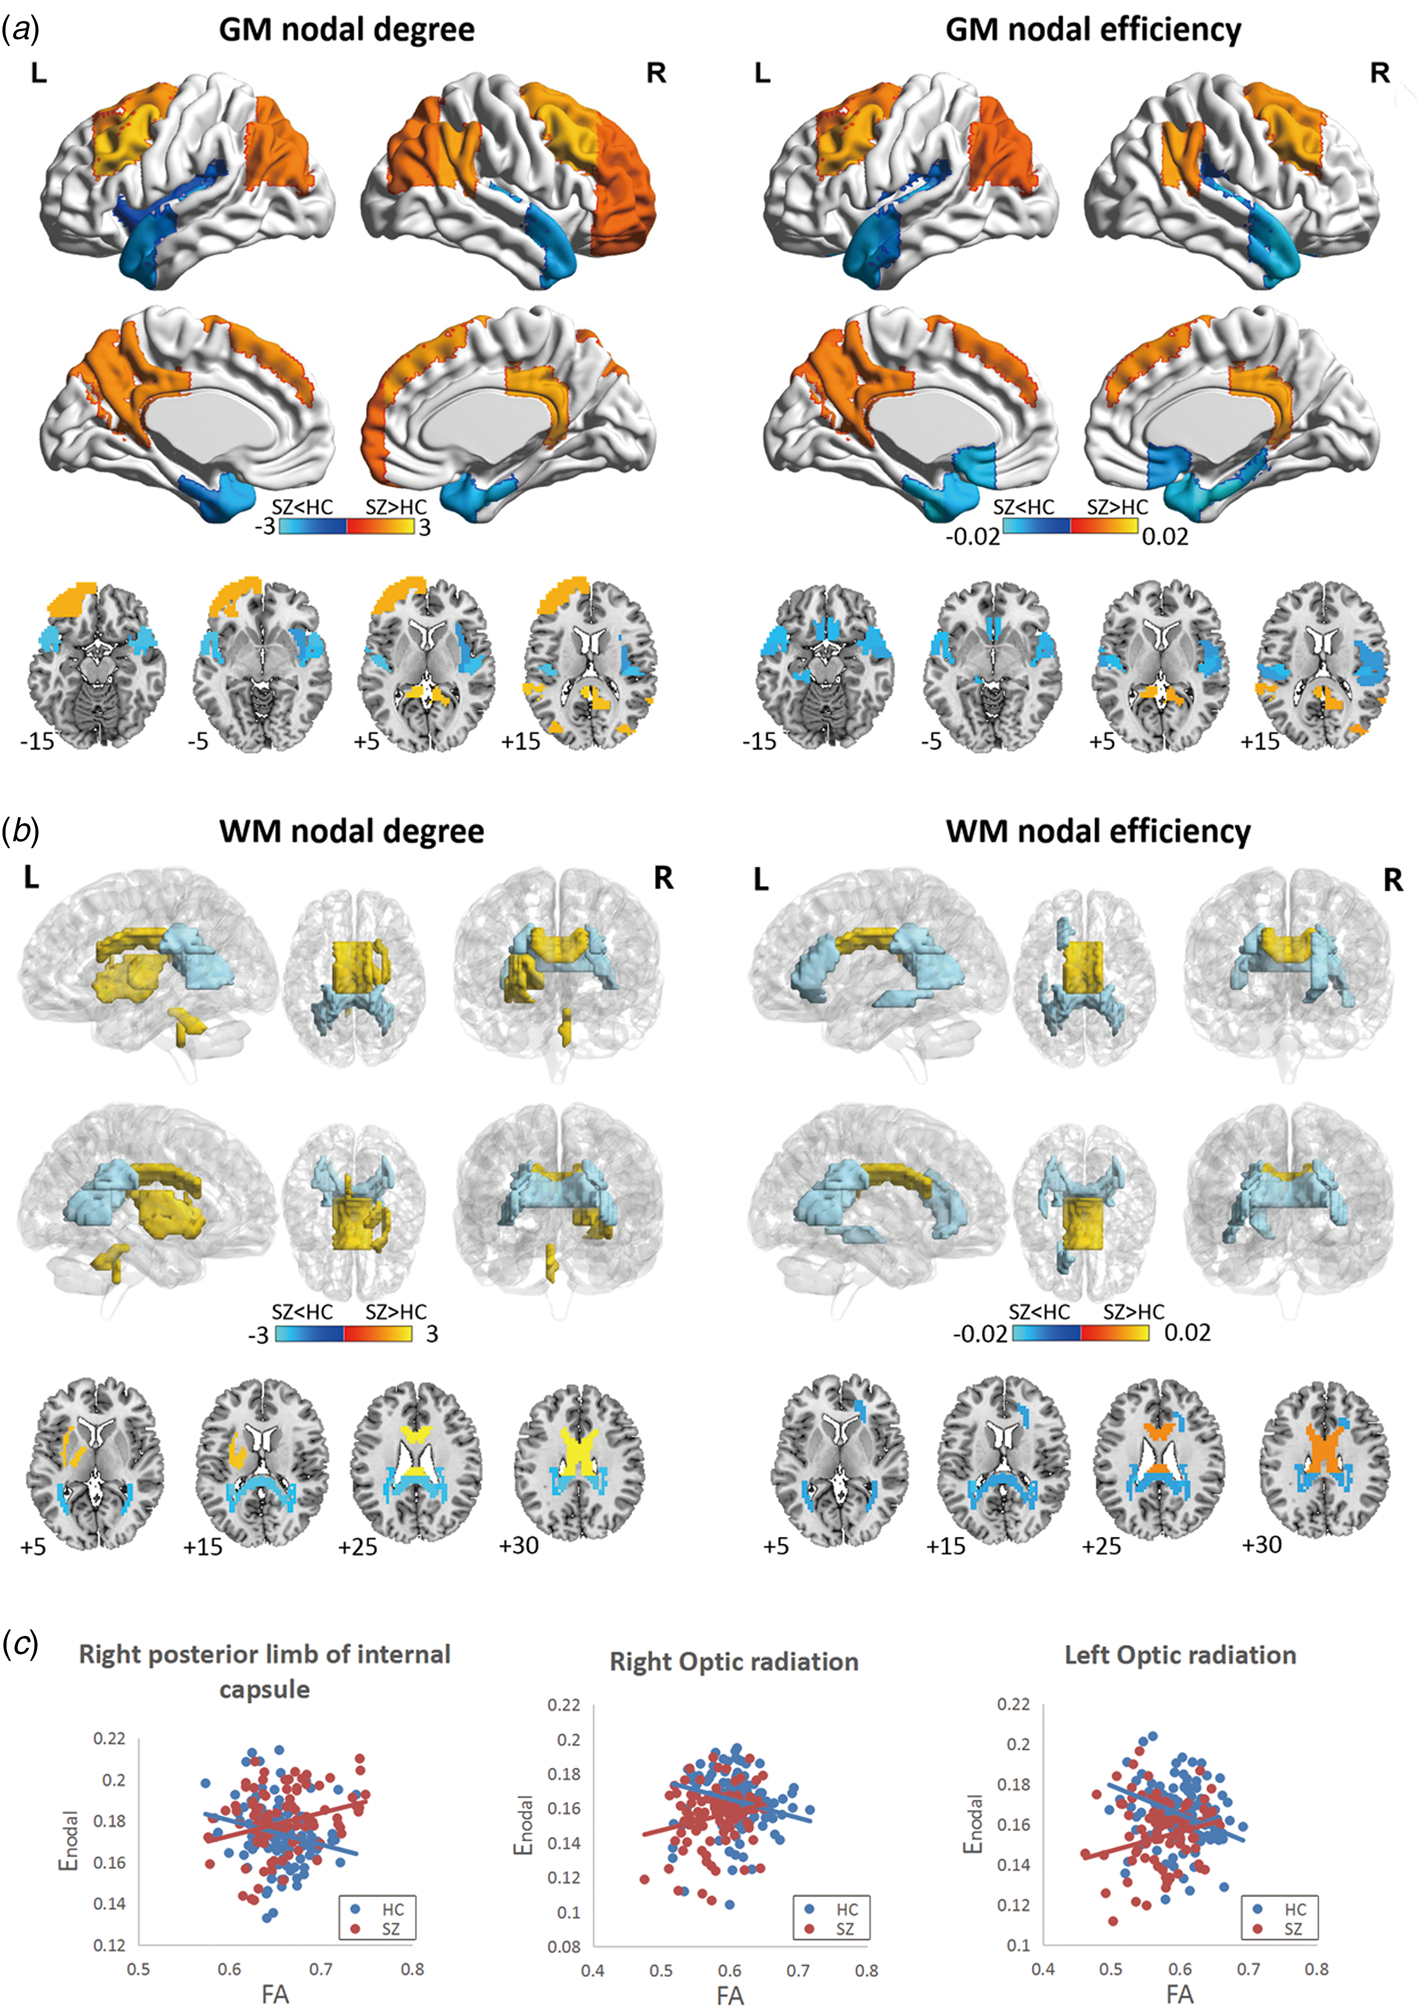
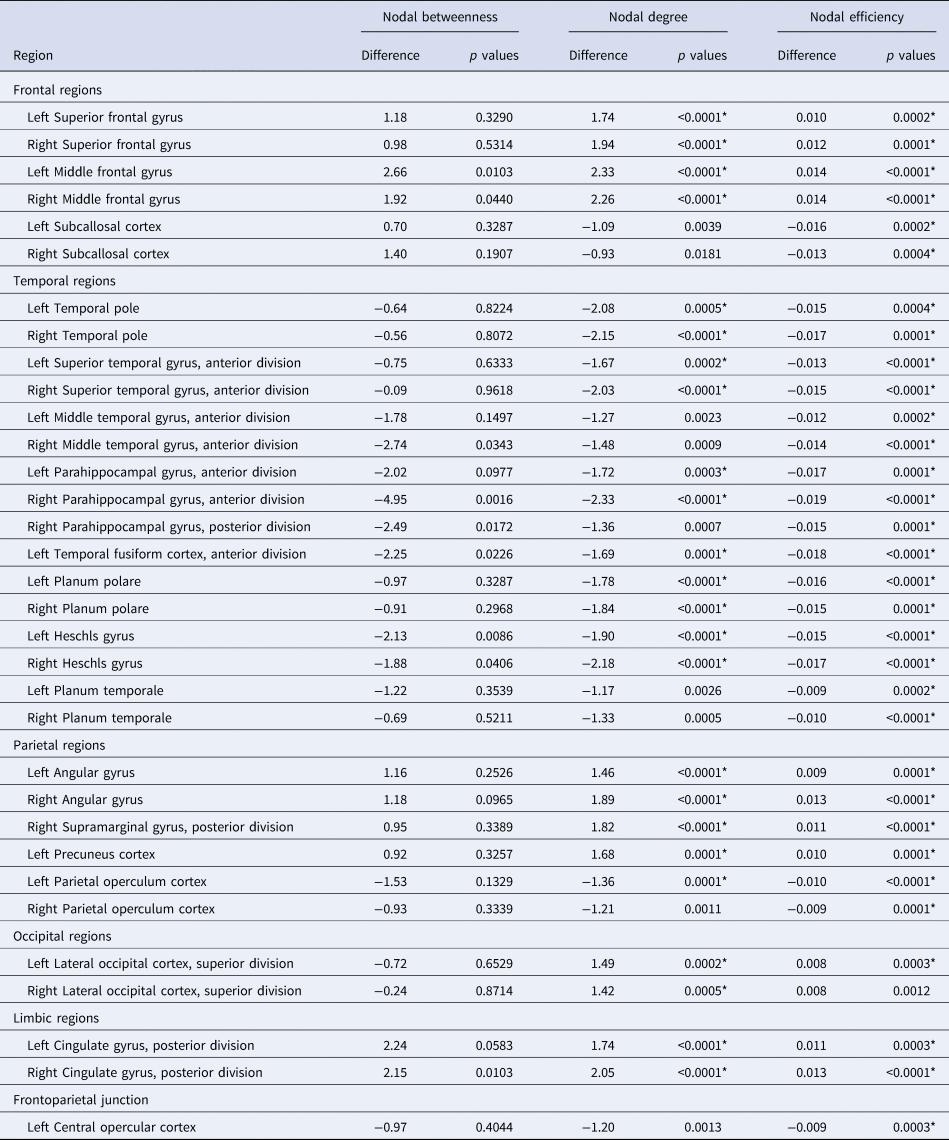
For cortical GM, regions showing significant group differences in K nodal or E nodal values were localized primarily in the frontal, parietal and temporal lobes (Fig. 2a and Table 2). Specifically, in comparison with the HC group, the SZ group showed increased K nodal or E nodal values in the bilateral frontal lobes (superior frontal gyrus and middle frontal gyrus), bilateral parietal lobes (angular gyrus, posterior supramarginal gyrus and precuneus cortex), bilateral occipital lobes (superior lateral occipital cortex) and limbic regions (posterior cingulate gyrus) (p < 0.05, Bonferroni corrected) (Fig. 2a and Table 2). Additionally, lower K nodal or E nodal values were found in most of the temporal lobes (temporal pole, superior temporal gyrus, middle temporal gyrus, parahippocampal gyrus, temporal fusiform cortex, planum polare, Heschl's gyrus and planum temporale), subcallosal cortex, parietal operculum cortex and left central opercular cortex (p < 0.05, Bonferroni corrected) (Fig. 2a and Table 2).
Cortical grey matter regions that exhibited altered nodal topological organization in patients with schizophrenia v. healthy control subjects
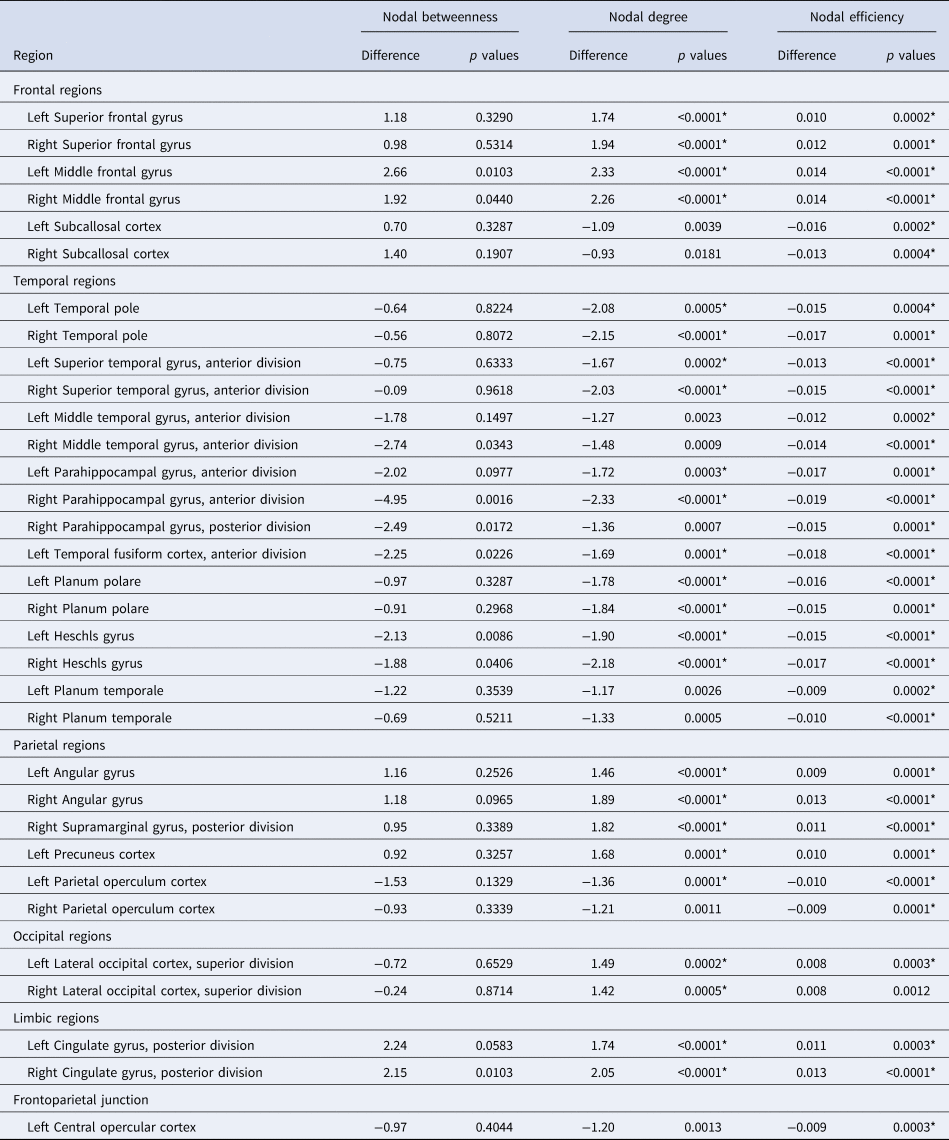
Note: * represents p < 0.05, Bonferroni correction.
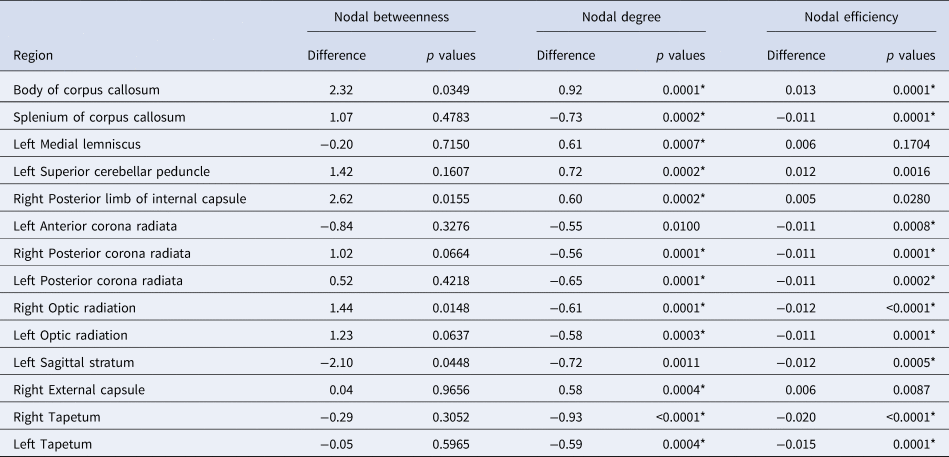
For the WM tracts, the patients with SZ exhibited increased nodal topology (K nodal or E nodal) in the following brain regions: the body of the corpus callosum, left medial lemniscus, left superior cerebellar peduncle, right posterior limb of internal capsule and right external capsule (p < 0.05, Bonferroni corrected) (Fig. 2b and Table 3). Regions showing reduced nodal topology were found in the splenium of the corpus callosum, left anterior corona radiata, bilateral posterior corona radiata, bilateral optic radiation, left sagittal stratum and bilateral tapetum (p < 0.05, Bonferroni corrected) (Fig. 2b and Table 3). These group differences were further validated through an additional stability analysis (online Supplementary Material).
White matter tracts that exhibited altered nodal topological organization in patients with schizophrenia v. healthy control subjects
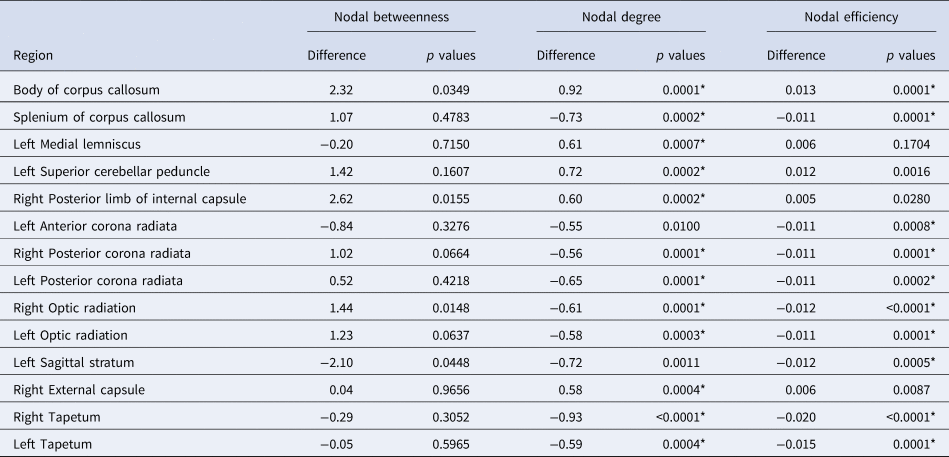
Note: * represents p < 0.05, Bonferroni correction.
We also found correlations between the E nodal and FA values in the right posterior limb of the internal capsule (r = −0.234, p = 0.010, FDR corrected), left (r = −0.180, p = 0.048, uncorrected) and right optic radiation (r = −0.199, p = 0.029, uncorrected) in the HC group (Fig. 2c). However, these correlations were not significant in the SZ group (all p > 0.05). Furthermore, these correlations between the E nodal and FA values in the right posterior limb of the internal capsule (p = 0.001, Bonferroni corrected) and right optic radiation (p = 0.008, Bonferroni corrected) showed significant differences between two groups using nonparametric permutation tests.
Relationships between network measures and clinical variables
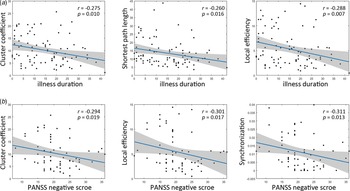
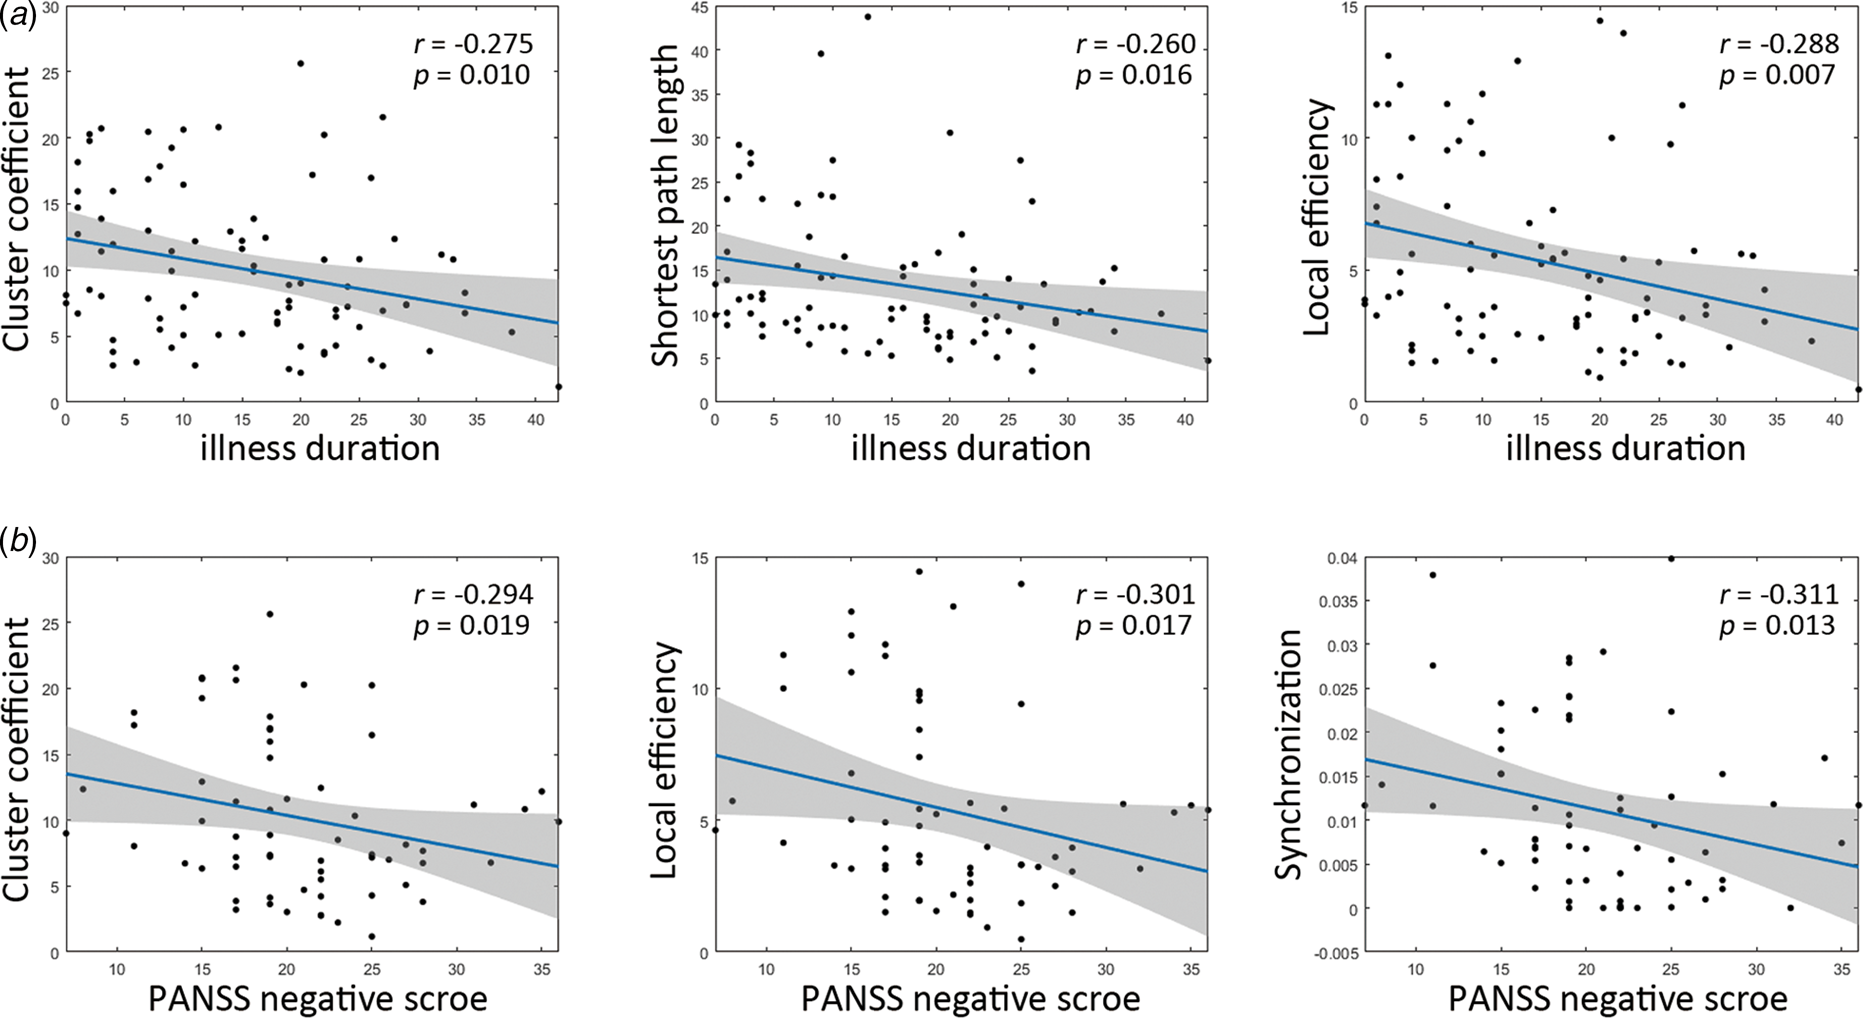
After multiple comparisons correction by the false discovery rate (p < 0.05, FDR corrected), the lower Cp (r = −0.275, p = 0.010), Lp (r = −0.260, p = 0.016) and Eloc (r = −0.288, p = 0.007) of the GM network showed significantly negative correlations with illness duration in the SZ group (Fig. 3a). In addition, the lower Cp (r = −0.294, p = 0.019), Eloc (r = −0.301, p = 0.017) and synchronization (r = −0.311, p = 0.013) of the GM network exhibited significant negative correlations with the PANSS negative scores (Fig. 3b). For WM, there was no significant correlation between network properties and clinical variables after FDR multiple comparisons correction.
The relationships between network metrics and clinical variables in patients with schizophrenia by using Spearman rank correlation analysis (p < 0.05, false discovery rate corrected). (a) The cluster coefficient, shortest path length and local efficiency were significantly negatively correlated with the illness duration. (b) The cluster coefficient, local efficiency and synchronization exhibited significant negative correlations with the PANSS negative scores.
Discussion
Using The graph theory approach, this study presented a novel network perspective for investigating how the resting-state WM and GM function altered for SZ patients in a comprehensive set at both global and nodal levels. At the global level, both the WM and GM networks exhibited reductions in the local efficiency, cluster coefficient and synchronization in the SZ group relative to the values observed for the controls. In addition, patients with SZ showed reduced small-worldness and hierarchy only for the WM network. Furthermore, the cluster coefficient, local efficiency and synchronization of the WM network were significantly negatively correlated with the PANSS negative score in patients with SZ. At the nodal level, the SZ group showed specific WM nodal disturbances in the corpus callosum, optic radiation, posterior corona radiata and tempo-occipital WM tracts. Regarding GM, the SZ group manifested increased nodal topology in frontoparietal regions and decreased nodal topology in temporal regions. These findings advance our understanding of disrupted WM function underlying the pathological mechanism of SZ from a functional topology perspective.
Abnormalities in functional segregation (E loc and Cp) and functional integration (Lp) are key features of brain network disorganization in SZ. E loc represents the efficiency of information exchange within a local subnetwork or among adjacent regions, while Cp measures the degree of nodes tending to cluster together (Rubinov & Sporns, Reference Rubinov and Sporns2010). This study observed that both GM and WM functional networks showed reduced E loc and Cp in SZ, which was compatible with prior studies reporting lower local information transfer in SZ (Fornito, Zalesky, Pantelis, & Bullmore, Reference Fornito, Zalesky, Pantelis and Bullmore2012). These findings further supported that decreased functional segregation might be a common feature of brain network disorganization in SZ, regardless of GM and WM. Reduced efficiency in local communication (i.e. functional segregation) of brain networks may arise from neurodevelopment impairments, which were demonstrated not only in cortical GM (including excessive synaptic elimination) (Sellgren et al., Reference Sellgren, Gracias, Watmuff, Biag, Thanos, Whittredge and Perlis2019), but also by abnormal WM neurobiology (including impaired WM integrity) (Kochunov & Hong, Reference Kochunov and Hong2014) in SZ. As one of the metrics in functional integration, Lp measures the shortest distance from one node to other nodes in a network (Rubinov & Sporns, Reference Rubinov and Sporns2010). The lower Lp reveals enhanced functional integration for information transfer in the brain network. Consistent with previous studies (Yu et al., Reference Yu, Dai, Tang, Wang, Zhang, Sha and Zhang2017), patients with SZ also exhibited increased functional integration in the large-scale GM functional network. It is thought that the enhanced functional integration in SZ indicates greater resilience to focal neural damage in GM (Lo et al., Reference Lo, Su, Huang, Hung, Chen, Lan and Bullmore2015; Lynall et al., Reference Lynall, Bassett, Kerwin, McKenna, Kitzbichler, Muller and Bullmore2010). In neuroimaging studies, focal damage could be referred to as ‘lesions’ of GM and WM, and included observations such as reduced GM volume, thinner cortical thickness or impaired myelination measured by diffusion MRI. Brain network topological resilience has been assumed to protect the integrity of the network from pathological attack in SZ (Lo et al., Reference Lo, Su, Huang, Hung, Chen, Lan and Bullmore2015). However, in the current study, greater functional integration in SZ was only observed in GM, not in the WM network, which indicated that WM did not present greater resilience to focal damage. We hypothesized that within WM, abnormal functional information from focal damage is more likely to spread to other WM areas along the fibre tracts. Furthermore, the present study found negative correlations between the E loc, Cp and PANSS negative scores, indicating that the brain topological network was associated with the severity of illness. This result implied that the brain topological network may predict SZ clinical symptoms. These brain network features were also correlated with illness duration, which provided evidence that progressive abnormalities of the brain topological network occurred in SZ.
Synchronization plays a crucial role in precise information processing of the brain (Fries, Reference Fries2009). Accumulated evidence from EEG, MEG and fMRI studies has suggested that SZ is related to impaired neural synchrony (Ford, Krystal, & Mathalon, Reference Ford, Krystal and Mathalon2007; Uhlhaas & Singer, Reference Uhlhaas and Singer2010). These synchrony disruptions have been also demonstrated to be associated with the core cognitive impairments and symptom severity, suggesting abnormal neurobiological processes in SZ (Uhlhaas, Haenschel, Nikolic, & Singer, Reference Uhlhaas, Haenschel, Nikolic and Singer2008). However, most studies evaluated brain synchronization using the temporal correlation in local oscillations or the functional connectivity of distributed brain regions, rather than whole-brain network features. The eigenratio of the graph Laplacian matrix is believed to be a frequently used indicator of synchronizability in complex networks (Barahona & Pecora, Reference Barahona and Pecora2002). Using this approach, the present study found that both WM and GM functional networks of SZ patients exhibited excessive synchronizability (i.e. decreased eigenratio). Moreover, the altered synchronization of the WM network was associated with more severe negative symptoms in SZ. These findings provide evidence of disrupted brain network synchronizability in SZ.
In addition, abnormalities of hierarchy and small-worldness of brain networks have been widely reported in substantial neuroimaging studies, although the alterations were not always consistent in SZ. For example, Bassett et al. (Reference Bassett, Bullmore, Verchinski, Mattay, Weinberger and Meyer-Lindenberg2008) reported less hierarchy in a sample of 203 people with SZ, while Lynall et al. (Reference Lynall, Bassett, Kerwin, McKenna, Kitzbichler, Muller and Bullmore2010) found enhanced hierarchy in patients with SZ compared to that in healthy volunteers. Additionally, several studies found that people with SZ showed reduced small-worldness (Liu et al., Reference Liu, Liang, Zhou, He, Hao, Song and Jiang2008); however, some studies observed that there were no significant differences in small-worldness between patients and controls (Yu et al., Reference Yu, Dai, Tang, Wang, Zhang, Sha and Zhang2017). In the current study, patients with SZ showed reduced hierarchy and small-worldness only in the WM functional network but not in the GM network. One possible explanation is that the possible physiological base of BOLD signals in the WM network is different from that in GM. In GM, postsynaptic potentials give rise to BOLD signals, whereas the precise source of BOLD signals in WM is complex. Previous studies put forward two possible interpretations for WM BOLD signals: spiking-related metabolic demands (Smith et al., Reference Smith, Blumenfeld, Behar, Rothman, Shulman and Hyder2002) and the activity of astrocytes and NO-producing neurons (Barbaresi, Fabri, & Mensa, Reference Barbaresi, Fabri and Mensa2014; Petzold & Murthy, Reference Petzold and Murthy2011). This may suggest that the WM network may carry specific functional information that is different from the GM. Compared to the GM functional network, the WM functional network showed lower small-worldness, suggesting weaker segregation and a preference for global integration (Li et al., Reference Li, Biswal, Wang, Duan, Cui, Chen and Liao2019a). WM tracts exhibited reduced magnitudes, delayed onsets and prolonged initial dips in haemodynamic response function compared with cortical GM (Li et al., Reference Li, Newton, Anderson, Ding and Gore2019b). Additionally, WM functional networks were found to be organized in three layers (superficial, middle and deep), suggesting a possible hierarchical organization in information transfer within WM (Peer et al., Reference Peer, Nitzan, Bick, Levin and Arzyt2017). Furthermore, recent studies have also found that the functional interactions among the three layers of WM networks were disrupted in SZ (Fan et al., Reference Fan, Li, Duan, Xiao, Guo, Han and Chen2020). Taken together, these findings were compatible with previous studies reporting less hierarchy and less small-worldness in patients with SZ, which might be expected to disrupt demands in higher-order cognitive processing.
At the nodal level, abnormalities in nodal attributes of GM, involving frontal, parietal, temporal, occipital and limbic regions, were found in the SZ group. These GM regions have been widely reported to show disrupted functional activations and structural deficits in SZ patients (Jiang et al., Reference Jiang, Luo, Li, Duan, He, Chen and Yao2018; Luo et al., Reference Luo, He, Duan, Huang, Hu, Wang and Luo2019). Moreover, abnormalities in these GM regions have also been reported to be associated with impairments of high-order cognitive function in SZ (Menon, Reference Menon2011). In addition to the altered GM regions, specific WM regions involving the corpus callosum, posterior corona radiata, optic radiation and tempo-occipital WM tracts exhibited aberrant nodal centralities in SZ patients. Disrupted WM integrity in these regions has been previously demonstrated in first-episode and chronic patients (Aydin, Ucok, & Guler, Reference Aydin, Ucok and Guler2008; Bora et al., Reference Bora, Fornito, Radua, Walterfang, Seal, Wood and Pantelis2011) and has been associated with disease duration, symptom severity and cognitive functions (Rosenberger et al., Reference Rosenberger, Nestor, Oh, Levitt, Kindleman, Bouix and Kubicki2012; Whitford et al., Reference Whitford, Kubicki, Schneiderman, O'Donnell, King, Alvarado and Shenton2010). As an interhemispheric WM tract, the corpus callosum plays an essential role in maintaining stable information transfer between hemispheres (Shen et al., Reference Shen, Misic, Cipollini, Bezgin, Buschkuehl, Hutchison and Berman2015). The abnormalities of the corpus callosum may disrupt interhemispheric functional communication in SZ (Agcaoglu et al., Reference Agcaoglu, Miller, Damaraju, Rashid, Bustillo, Cetin and Calhoun2018; Wang et al., Reference Wang, Zhang, Liu, Crow, Zhang, Palaniyappan and Li2019). Several WM functional studies have also shown altered low-frequency oscillation amplitudes and functional connectivity in the corpus callosum for SZ patients (Jiang et al., Reference Jiang, Luo, Li, Li, Yang, Li and Yao2019b; Yang et al., Reference Yang, Zhang, Yao, Liu, Shah, Zeng and Lui2019). Consistent with these findings, the current results implied that the corpus callosum may play a notable role in maintaining stable functional interactions in the WM network, which was disrupted in SZ patients. Furthermore, prior studies suggested that WM functional changes may also be associated with GM function in SZ patients (Jiang et al., Reference Jiang, Luo, Li, Li, Yang, Li and Yao2019b; Yang et al., Reference Yang, Zhang, Yao, Liu, Shah, Zeng and Lui2019). Interestingly, this study observed abnormal functional increases in parietal and occipital GM areas in SZ, and these GM regions were connected to the posterior corona radiata and splenium of the corpus callosum. However, the posterior corona radiata and splenium of the corpus callosum exhibited functional decreases in SZ patients, which suggested that WM functional alterations may play a possible compensatory role for the adjacent GM impairments in SZ. Although non-invasive transcranial magnetic stimulation (TMS) has shown potential as a treatment for SZ, its mechanism remains unclear. Most TMS equipment can effectively act on the superficial cortical region. It has been hypothesized that TMS effects could reach distant areas via WM fibre tracts; thus, investigating the WM functional network may improve the present understanding of the mechanism of TMS in SZ treatment. In general, these abnormalities in WM extended the understanding of the pathophysiology of SZ from the perspective of the WM functional network.
The relationship between structure and function in WM is still inconclusive. Several studies have reported a significant correlation between WM activation and the FA value (Ji, Liao, Chen, Zhang, & Wang, Reference Ji, Liao, Chen, Zhang and Wang2017; Ji et al., Reference Ji, Ren, Li, Sun, Liu, Gao and Wang2019), whereas Yang's study showed no relationship of this structure and function in WM (Yang et al., Reference Yang, Zhang, Yao, Liu, Shah, Zeng and Lui2019). Additionally, previous studies have suggested that the functional features detected by BOLD-fMRI can be partly explained by structural properties (Ji et al., Reference Ji, Liao, Chen, Zhang and Wang2017; Wu et al., Reference Wu, Wang, Li, Schilling, Gao, Anderson and Gore2019). We also found a negative correlation between the Enodal and FA values at the posterior limb of the internal capsule and optic radiation in HCs. FA reflects the axonal density and myelination degree (Beaulieu, Reference Beaulieu2002). In WM, axons act as the pathway for information transfer. The transfer speed is improved by the myelin sheath produced by oligodendrocytes. In addition to oligodendrocytes, microglia and astrocytes are also present in WM. They provide nutrients and oxygen to neurons. In addition, astrocytes, which mediate neurovascular coupling in GM, are also found in WM (Rash, Reference Rash2010). Taken together, these findings provide extended evidence on the association of structure and function in WM, suggesting a structural basis for BOLD-fMRI signals in WM.
Regarding the methodological aspect, although both GM and WM networks were constructed by using the correlations of resting-state fMRI BOLD signals, there were several differences in the data processing procedures for GM and WM. First, the ways to extract the time series data from WM and GM are different from each other. The traditional average calculated across voxels (equal weight) within an ROI was used for GM regions, whereas the TBSS weighted method (unequal weight) was used for WM regions. Second, in our previous study (Jiang et al., Reference Jiang, Luo, Li, Li, Yang, Li and Yao2019b), the middle and deep WM exhibited the maximal amplitude at the frequency of 0.07 Hz and the main frequency component located at the frequency band of 0.01–0.15 Hz. Thus, the filtering band is different when building WM and GM networks. The main findings in the current study were the differences between the SZ and HC groups. It should be further investigated how the differences in the frequency band could have influenced WM and GM networks. Finally, previous methods had substantial issues due to spatial smoothing, which exacerbated the possible contribution of GM (or other issues) to WM due to partial-volume effects. By projecting the functional BOLD signals onto the structural FA skeleton of WM, this approach may hopefully resolve the issue of spatial smoothing in WM function analysis.
Several limitations should be considered when interpreting our findings. First, most patients had chronic SZ and were taking antipsychotics. It is difficult to rule out the potential effect of the medication. Second, cognitive measures were not evaluated; thus, we can only speculate possible associations between disruptions in WM network function and cognitive deficits in SZ. Third, as impaired information processing, such as lower intelligence quotient (IQ), which is related to educational level and brain measures, is likely part of the illness, matching on the educational level between patients and healthy controls may lead to an underestimation of effects and loss of some of the relevant information. Thus, matching on parental level of education (Ray et al., Reference Ray, Lesh, Howell, Salo, Ragland, MacDonald and Carter2017) is more appropriate in the future work. In addition, the current study has a cross-sectional design and could not uncover the dynamic changes over time in SZ. In addition, the association between observed BOLD signals in WM and neuron-related activity remains unclear (Gawryluk, Mazerolle, & D'Arcy, Reference Gawryluk, Mazerolle and D'Arcy2014b). As WM tracts cross each other, it is extremely difficult to locate the precise source of the functional signals in WM. In node definition, we used a verified WM atlas to segment the WM tract rather than data-driven methods (such as cluster analysis and independent component analysis) or a random segmentation strategy because of its inherent practicality, comparability and anatomical information. Finally, the conclusions of this study are from only one cohort, which needs to be further verified by other samples in future work.
In summary, our findings provide evidence for abnormal global topological properties in SZ, involving reduced local efficiency, cluster coefficients, hierarchy, small-worldness and increased synchronization, from the perspective of the WM functional network in the brain. Interestingly, patients with SZ showed enhanced centralities in parietal and occipital GM areas; however, adjacent WM tracts (optic radiation, posterior corona radiata and splenium of corpus callosum), which connect those GM regions, exhibited reduced nodal centralities, suggesting that WM functional alterations may play a possible compensatory role for adjacent GM impairments in SZ.
Supplementary material
The supplementary material for this article can be found at https://doi.org/10.1017/S0033291720003141.
Data availability
The data supporting the findings of this study are available from the corresponding author upon reasonable request.
Acknowledgements
We are grateful to all the participants in this study. Our thanks also go to Dr Xi Chen (Civil Aviation Flight University of China) for her help to collect the dataset. This work was partly supported by the grant from the National Key R&D Program of China (No. 2018YFA0701400), grants from the National Natural Science Foundation of China (No. grant number: 61933003, 81771822, 81861128001, and 81771925), the CAMS Innovation Fund for Medical Sciences (CIFMS) (No. 2019-I2M-5-039) and the Project of Science and Technology Department of Sichuan Province (No. 2019YJ0179).
Author contributions
Cheng Luo and Dezhong Yao contributed equally to supervise and to design the study; Jingyu Zhou, Huang Huan, Meiling Wang and Mingjun Duan managed the experiments and data collection; Yuchao Jiang, Xin Chang and Yue Tan undertook the data analysis; Yuchao Jiang and Cheng Luo wrote and revised the manuscript. All authors reviewed the manuscript and approved the final manuscript.
Conflict of interest
There is no conflict of interest.