I. INTRODUCTION
It is well known that nitrogen oxides (NOx) are harmful air pollutants, which cause serious damage to the environment, such as photochemical smog, acid rain, ozone depletion, and greenhouse effects. The selective catalytic reduction of NOx with NH3 (NH3-SCR) is an effective approach to remove NOx contaminants, and highly effective catalyst is the key to carry out NH3-SCR reaction. Currently, V2O5/TiO2 catalysts are commercially available with operating temperature from 300 to 400 °C.Reference Ettireddy, Ettireddy and Smirniotis1 Although the vanadium based catalysts have relatively high SCR activity and ideal resistance to sulfur poisoning, they can be easily deactivated at high concentration of SO2 and ash in the flue gas, and some side reactions can be triggered at high temperatures to cause the decrease of N2 selectivity.Reference Tang, Hao, Yi and Li2,Reference Lin, Hao and Li3 Many efforts have been devoted to develop new types of SCR catalysts with low active temperature, such as activated carbon supported manganese-based monolithic catalyst (MnOx/AC) prepared by impregnation method,Reference Tang, Hao, Yi and Li2 mesoporous silica supported iron–manganese composite oxides (Mn–Fe/MPS) prepared by impregnation method,Reference Huang, Tong and Huang4 and nonsupported manganese–cerium composite oxides (MnOx–CeO2) prepared by supercritical antisolvent (SAS) process.Reference Jiang, Zhao, Jiang and Zhang5 It was reported that the Mn–Fe composite oxide catalyst showed good SCR activity, high N2 selectivity and ideal resistance to water and sulfur poisoning at low temperature. Lin et al.Reference Lin, Hao and Li3,Reference Huang, Tong and Huang4,Reference Lin, Xu and Chen6,Reference Wu, Jiang and Liu7 have found that the addition of Fe promoter could enhance the number and strength of Brönsted and Lewis acid sites on the surface of Mn-based catalysts, and promote the adsorption of NH3 to form some active intermediates, which improved the NH3-SCR performance at low temperature. Furthermore, the mechanism of NH3-SCR reaction has been investigated by Yang et al. who reported that both the Eley–Rideal (i.e., reaction of activated ammonia with gaseous NO) and the Langmuir–Hinshelwood (i.e., reaction of adsorbed ammonia species with adsorbed NOx species) mechanisms may happen during the reaction,Reference Yang, Wang, Li and Yan8 and the SCR activity of catalyst is related to the activity for NO oxidation to NO2, since the NO2 + NO mixture is very active in reacting with NH3 adsorbed species at low temperatures.Reference Long, Yang and Chang9
Compared with the conventional methods for preparing metal oxide nanoparticles, the SAS technique is a novel method which can obtain nanograde particles with narrow particle size distribution, and control particle morphology through regulated process conditions.Reference Jiang, Huang and Zhang10–Reference Huang, Jiang and Zhang14 Therefore, the products are uniformly dispersed with each other and show higher specific surface area, which can provide more active sites for the reaction. Overall, the novel SAS technique is prospective to develop highly active SCR catalysts which are of both fundamental and practical importance.
In this work, MnOx–FeOy catalyst is prepared using SAS method, and the effects of Mn/Fe mass ratio are investigated by comparing the crystal structure, surface compositions and redox performance. A reference experiment, conducted by the conventional coprecipitation techniques, is designed to compare with SAS techniques by analyzing the crystal structure, morphology, and NH3-SCR activity.
II. EXPERIMENTAL SECTION
A. Materials and catalyst preparation
Manganese acetylacetonate (Mn(acac)3, purity 97%) was purchased from TCI Co. (Tokyo, Japan). Iron acetylacetonate (Fe(acac)3, purity ≥ 99%) was provided by Arcos Organic Co. (Geel, Belgium). Methanol (A.R. grade) was purchased from Kermel Co. (Tianjin, China). Carbon dioxide (CO2, purity 99.9%) was supplied by Hexagon Co. (Tianjin, China). N2, He, Ar and the mixture gases of H2/Ar, NO/Ar, NH3/Ar and O2/Ar were supplied by Beijing AP BAIF Gases Industry Co. Ltd. (Beijing, China).
SAS process: A SAS experimental apparatus (Type SAS50, manufactured by Thar Process Co., Pittsburgh, Pennsylvania) was used to precipitate the precursor particles of MnOx–FeOy composite oxide catalysts, using supercritical carbon dioxide (sc-CO2) as the antisolvent and methanol as the solvent. The total concentration of precursor salts was fixed at 0.5 wt%, mass ratio of Mn(acac)3 and Fe(acac)3 (Mn/Fe) was 8:1, 4:1, 2:1, and 1:1, respectively. The operating parameters were as follows: pressure 100 MPa, temperature 45 °C, CO2 flow rate 45 g/min, flow rate of mixed salts solution 1 mL/min.
Coprecipitation process: Firstly, iron nitrate and manganese acetate (Mn/Fe = 1:1) were added to deionized water, and stirred at 500 r/min until the solute completely dissolved, the total concentration of metal ions was regulated at 0.2 mol/L. Then aqueous ammonia was added dropwise to the mixed salt solution until pH was about 10, stirred for another 60 min, the mixture was kept stationary and aged overnight. After that, it was filtered, then dried in vacuum drying oven at 100 °C for 10 h. Finally the precursor particles were obtained.
Calcination: The prepared catalyst precursors were calcined at 500 °C for 3 h in a muffle furnace (type BF51866C-1, manufactured by ThermoFisher Scientific/Lindberg, Waltham, Massachusetts).
B. Characterization
The catalyst morphologies were characterized by high-resolution transmission electron microscopy (HRTEM, FEI Tecnai G2 F20, FEI Company, Eindhoven, The Netherlands) operating at 200 kV with a point resolution of 0.24 nm. The nitrogen adsorption–desorption isotherms were measured by Micromeritics Tri-Star 3000 (Norcross, Georgia) using nitrogen at 77 K as the adsorbate, the specific surface area and pore size were calculated by Brunauer–Emmett–Teller (BET) and Barrett–Joyner–Halenda (BJH) formulae, respectively. The crystal phase was investigated by x-ray diffractometer (XRD, Rigaku D/Max 2500, Tokyo, Japan) equipped with Cu Kα radiation source, and the scanning range is 10–80°. Elemental compositions of the catalysts were determined by inductively coupled plasma optic emission spectrometry (ICP-OES, Varian VISTA-MPX, Palo Alto, California). The x-ray photoelectron spectra (XPS) were acquired by PerkinElmer PHI-1600 spectrometer (Waltham, Massachusetts) equipped with Mg Kα radiation source (h = 1253.8 eV), and the binding energies were calibrated by taking C1s peak binding energy (284.6 eV) as reference. The Fourier transform infrared spectroscopy (FT-IR) studies were conducted by Nicolet 6700 (ThermoFisher Scientific) within scanning wave number range between 400 and 4000 cm−1, and the catalyst samples were tableted with KBr. In situ diffuse reflectance infrared Fourier transform (In situ DRIFT) spectroscopy measurements were also carried out by Nicolet 6700 (equipped with an in situ diffuse pool) within wave number range between 650 and 4000 cm−1, and recorded by accumulating 100 scans with a resolution of 4 cm−1. The temperature-programmed desorption (TPD) experiments were performed on Autochem II 2920 (Micromeritics), the samples were pretreated at 150 °C by He gas flow for 2 h and then cooled down to 60 °C, chemiadsorption of NH3 was subsequently performed at 60 °C for 2 h, then heated to 500 °C in He flow at a rate of 10 °C/min.
C. Catalytic activity evaluation
The SCR activity test process could be divided into three steps: gas distribution, catalytic reaction, and product analysis. In the first step, 1000 ppm NO, 1000 ppm NH3, 2% O2 (volume fraction) and Ar as equilibrium gas were mixed in a cylinder, and flowed into reactor with a total flow rate of 100 mL/min and space velocity of 50,000 h−1. In the second step, 0.2 g catalyst was weighed and uniformly mixed with 0.4 g quartz sand. The reaction was conducted in a fixed-bed microreactor (a stainless steel tube with a length of 300 mm and an inner diameter of 8 mm) at atmospheric pressure with a temperature range of 100–260 °C. In the third step, catalytic reaction products were analyzed online by the Kane KM9106 Quintox flue gas analyzer (Kane International Ltd., Hertfordshire, United Kingdom) and Agilent 6820 gas chromatograph (Santa Clara, California) with chromatography column temperature set at 30 °C. N2 was separated by molecular sieve 5 Å columns, and N2O was separated by Plot-Q columns with He gas as a carrier at a flow rate of 15 mL/min.
III. RESULTS AND DISCUSSION
A. Effects of iron doping on structure and properties of catalysts
1. XRD characterization
XRD analyses were performed to understand the changes of crystal structure and determine the components of MnOx–FeOy catalyst. Figure 1 shows the XRD patterns of MnOx–FeOy composite oxide catalysts prepared with different Mn/Fe ratios. The pure iron oxide showed typical hexagonal crystal phase of α-Fe2O3 (JCPDS no. 33-0664), which has distinct characteristic diffraction peaks at the 2θ positions of 33.1, 35.6, 40.8, 49.5, 54.0, 57.6, 62.4, and 64.0°, and the strongest diffraction peak of Fe2O3 crystal plane (104) indicated high crystallinity of α-Fe2O3 phase.Reference Al-Sayari15 The cubic bixbyite structure (JCPDS card no. 24-0508) was main phase in the manganese oxide without iron doping, which showed clear characteristic diffraction peaks at the 2θ positions of 23.1, 32.9, 38.2, 45.2, 49.3, 55.2, and 65.8°. The characteristic diffraction peaks of MnO2 crystal plane (110), marked with asterisk, also existed in the composite catalysts.
XRD patterns of Fe2O3, Mn2O3, and MnOx–FeOy composite oxide catalysts prepared with different Mn/Fe mass ratios (1:1, 2:1, 4:1, and 8:1).

With the increase in amount of iron doping, the crystal phase structure of MnOx–FeOy composite oxide catalysts changed gradually. When the Mn/Fe mass ratios were 8:1 and 4:1, the characteristic diffraction peaks of Mn3O4 (JCPDS card no. 24-0734) were observed. But with the additional increase of iron content, the Mn3O4 characteristic diffraction peaks gradually disappeared, and the Mn2O3 crystal with cubic crystal structure was formed. When iron content was further increased, the characteristic diffraction peaks of MnO2 (110) crystal plane enhanced gradually, which indicated that the content of Mn4+ species in the catalysts increased with iron doping amount, and the result was consistent with the XPS characteristic results (shown in Table II). In XRD patterns of all catalysts, the characteristic diffraction peaks of α-Fe2O3 were not found. Furthermore, the lattice parameters were calculated based on the Mn2O3 crystal plane (222). As the Mn/Fe mass ratio decreased from 8:1 to 2:1, the lattice parameter would decreased from c = 9.470 Å to c = 9.367 Å since Fe3+ ions (radius is 0.64 Å) was smaller than Mn2+ and Mn3+ (radius are 0.80 and 0.66 Å, respectively).Reference Yang, Wang, Li and Yan8 Therefore, when the Mn2+ and Mn3+ ions in MnOx lattice were replaced by small amounts of Fe3+ ions, the lattice would contract due to size effect, which led to the decrease of lattice parameters. With further increase of iron content, the proportion of Mn4+ ions was also increased (see XRD results in this section and the XPS results given below). Consequently, when the Mn4+ ions were substituted by Fe3+ ions, because the Mn4+ ion (0.60 Å) was smaller than Fe3+ ion (0.64 Å),Reference Yang, Wang, Li and Yan8 the lattice parameter would increase (c = 9.388 Å), but still less than that of the pure Mn2O3 phase (c = 9.405 Å). Therefore, it is suggested that the iron atoms were embedded into Mn2O3 crystal lattice and solid solution were formed for as-prepared MnOx–FeOy catalysts.Reference Ismail16,Reference Wang, Wen and Shen17
2. Catalyst structure analysis
The particle morphology was observed by HRTEM and the structure parameters were calculated by BET formulae. Figure 2 shows the HRTEM photographs of MnOx–FeOy composite oxide particles prepared with different Mn/Fe ratios. MnOx–FeOy composite oxides with hollow structure were formed after iron doping, and the formation of hollow structure was not correlated with the iron doping amount. BET calculation results showed that the average particle sizes of all MnOx–FeOy particles were about 50 nm, the average pore diameter was 7 nm. Although the iron doping amount could not influence the particle size significantly, the average pore diameter was decreased and specific surface area was increased consequently since the iron doping generated structural rearrangements.Reference Cui, Cai, Shi and Fu18 As can be seen in Table I, with the increase of iron content, the average pore size decreased significantly. When Mn/Fe mass ratio was 1:1, MnOx–FeOy composite oxides showed the largest specific surface area and the smallest pore size.
HRTEM images of MnOx–FeOy composite oxide catalysts prepared with different Mn/Fe mass ratios: (a) Mn:Fe = 1:1; (b) Mn:Fe = 2:1; (c) Mn:Fe = 4:1; (d) Mn:Fe = 8:1.
Structure parameters of MnOx–FeOy composite oxides particles.
3. FT-IR characterization
To study the interaction between manganese and iron species, the MnOx–FeOy composite oxide catalysts prepared with different Mn/Fe ratios were investigated by FT-IR characterization. The FT-IR spectra are shown in Fig. 3.
FT-IR spectra of Fe2O3, Mn2O3, and MnOx–FeOy composite oxide catalysts prepared with different Mn/Fe mass ratios (1:1, 2:1, 4:1, and 8:1).
The characteristic absorption peaked at around 500 cm−1 were attributed to the skeletal vibration of Mn2O3 and Fe2O3. The stretching vibration peaks of Fe–O bond in pure Fe2O3 appeared at 550 and 470 cm−1. The relationships between the particle size of catalyst powder and the Fe–O vibrational bands have been studied by Hayashi et al., who found that when the skeletal vibration peaks of Fe2O3 were positioned at 550 and 470 cm−1, the average particle size of nanoparticles was about 50 nm.Reference Huo, Chen and Huang19,Reference Hayashi and Kanamori20 The Mn–O skeletal vibration peaks were located at around 575 and 520 cm−1, and the peaks gradually red-shifted with the increase of iron doping amount, which could be explained by the strong interaction between manganese and iron ions, as well as modulation effects on particle size during the mutual doping between manganese and iron ions. Similarly, after the mutual doping between manganese and iron ions, the vibrational absorption of Fe–O bonds at 1070 cm−1 moved to lower wave number (blue-shifting), also indicated that a strong interaction existed between the manganese and iron species. The peaks located at 1640 cm−1 could be attributed to the bending vibration of water molecules adsorbed on the surface of MnOx–FeOy. The characteristic peaks positioned near 2360 cm−1 should be ascribable to the vibrational absorption of CO2 adsorbed on catalyst surface, which were probably produced during the calcination of catalyst precursor (acetylacetonates of manganese and iron), and readsorbed on the surface of catalyst. It should be noted that the characteristic absorption peaks of adsorbed CO2 were relatively strong, so the catalyst must be pretreated, to make the surface clean for exposing covered active centers before the characterization and the activity evaluation. The absorption band at around 3440 cm−1 could be ascribable to the symmetric and asymmetric vibration of water molecules adsorbed on the catalyst surface. Huang et al. reported that H2O has no adverse impact on the activity when the SCR reaction temperature is above 413 K.Reference Huang, Tong and Huang4
4. XPS characterization
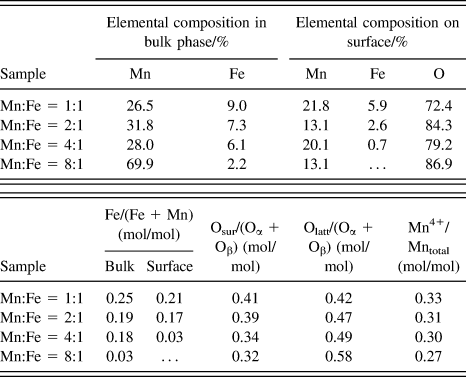
To study the effects of iron doping on the valence states of manganese and oxygen species composition on the catalyst surface, MnOx–FeOy oxides prepared with Mn/Fe ratios of 1:1, 2:1, 4:1, and 8:1 were tested by XPS. The obtained Mn2p XPS spectra are shown in Fig. 4 and the elemental composition are listed in Table II.
Mn2p XPS spectra of MnOx–FeOy composite oxide catalysts prepared with different Mn/Fe mass ratios: (a) Mn:Fe = 1:1; (b) Mn:Fe = 2:1; (c) Mn:Fe = 4:1; and (d) Mn:Fe = 8:1.
Surface and bulk elemental composition of MnOx–FeOy composite oxide catalysts.a
a Oα, amount of lattice oxygen; Oβ, amount of oxygen species in bulk phase; …, not detected.
Previous studies showed that the proportions of surface oxygen species could measure the amount of active species on the catalyst surface.Reference Wang, Kang and Li21,Reference Wang, Ge and Zhan22 Table II lists the relative contents of each surface species calculated by integrating the corresponding peak areas, and the elemental composition in bulk phase determined by the ICP technique. With the increase of iron content, the lattice oxygen content was decreased, while the surface chemisorbed oxygen content was increased, may be because “Mn ← O” electron-transfer process enables the formation of reactive electrophilic oxygen species,Reference Wang, Kang and Li21,Reference Liu, Li and Zhu23 which was beneficial to improve the SCR activity of MnOx–FeOy composite oxides.
As shown in Fig. 4, the Mn2p XPS spectra presented two asymmetric characteristic peaks. The peak positioned at higher binding energy (BE) value was ascribable to Mn2p1/2, the other was attributed to Mn2p3/2, and they had an energy spacing of about 11.5 eV. The signal Mn2p3/2 spectra could be divided into three individual peaks centered at 640.6, 641.6, and 643.2 eV, which should be attributed to the Mn2+, Mn3+, and Mn4+ species, respectively.Reference Tang, Jiang, Liu and Sun24,Reference Huang, Khu and Yeh25 The ratios of Mn4+ species to the total manganese content are listed in Table II. When the Fe content in bulk phase increased, the amount of Mn4+ increased as well due to the strong oxidation ability of Fe3+ species, which promoted oxidation of Mn2+ and Mn3+ ions to Mn4+ ions. But Mn4+ content did not increase significantly because of the “Mn ← O” electron-transfer process.
5. In situ DRIFT characterization
Figure 5 shows the state information of species adsorbed on the surface of MnOx–FeOy after the saturated adsorption of NH3 (as probe molecule) at different temperatures. NH3 molecules adsorbed on the catalyst surface were converted to new species. Among the spectra, the absorption peaks centered at around 1101 and 1583 cm−1 represented the symmetric (δs) and asymmetric (δas) deformation vibrations of NH3 coordination adsorbed on Lewis acid sites, respectivelyReference Liu, He, Ding and Zhang26; the absorption peak located at about 1360 cm−1 could be mainly ascribable to the asymmetric bending vibration of covalently adsorbed NH3 speciesReference Zhao, Xie and Liu27; the absorption peaks centered at around 1617 and 1452 cm−1 represented the symmetric (δs) and asymmetric (δas) deformation vibration of NH4+ formed by NH3 molecules chemisorbed on the Brönsted acid sites of catalyst surface, respectivelyReference Long and Yang28,Reference Topsøe29 ; the absorption peaks centered at around 2970 and 2860 cm−1 were attributed to the N–H stretching vibration in NH4+ speciesReference Liu, He, Ding and Zhang26,Reference Ramis, Yi, Busca and Turco30 ; the absorption peaks located at the vicinity of 3291 and 3220 cm−1 were assigned to the N–H stretching vibration in NH3 species covalently adsorbed on the catalyst surfaceReference Liu, He, Ding and Zhang26; and the absorption peak at around 1530 cm−1 could be attributed to the bending vibration of the adsorbed amino species (NH2),Reference Amores, Escribano, Ramis and Busca31 which might be generated by the oxidative dehydrogenation of covalently adsorbed NH3 molecule. Yang et al. reported that both the coordinated NH3 and ionic NH4+ can take part in the SCR reaction.Reference Yang, Wang, Li and Yan8 It can be seen from Fig. 5 that with the increase of temperature, the intensity of absorption peaks centered at 2860 and 2970 cm−1 gradually decreased, which indicated that the NH3 species gradually desorbed from the Brönsted acid sites of the catalyst surface. Desorption of NH3 was basically completed when the temperature reached 200 °C. So it could be concluded that the NH3 molecules were adsorbed on Brönsted acid sites mainly at low temperature. With the further increase of temperature, the vibration absorption peaks attributed to NH3 adsorbed on Lewis acid sites gradually weakened, but did not disappear within the whole temperature range of the test. Through above analyses, it could be deduced that during the deNOx process at low temperature (100–260 °C) NH3 might be adsorbed on both Lewis acid sites and Brönsted acid sites; that is to say, both Lewis acid and Brönsted acid sites are active centers for the reaction, and the adsorbed ammonia species are reactive in the NH3-SCR of NOx.
In situ DRIFT spectra of MnOx–FeOy composite oxide catalysts prepared with different Mn/Fe mass ratios: (a) Mn:Fe = 1:1; (b) Mn:Fe = 2:1; (c) Mn:Fe = 4:1; (d) Mn:Fe = 8:1; (e) Mn2O3 and (f) Fe2O3.
6. DeNOx activity tests
Figure 6 presents the low-temperature activity of NOx reduction with NH3 catalyzed by MnOx–FeOy composite oxides. The NOx conversion rate was positively correlated to the amount of iron element, that is to say the catalyst SCR activity is as follows: Mn/Fe (1:1) > Mn/Fe (2:1) > Mn/Fe (4:1) > Mn/Fe (8:1) > Mn2O3 > Fe2O3. When the reaction temperature was 220 °C, the conversion of NOx catalyzed by MnOx–FeOy prepared with Mn/Fe (1:1) reached 97%, and NOx conversions was maintained above 92% from 180 to 260 °C, indicating that the catalyst has a rather wide active temperature window. Catalyst prepared with Mn/Fe (1:1) showed that the highest SCR activity could be ascribed to the following aspects: (i) the BET analysis indicated that the composite oxide prepared with Mn/Fe (1:1) showed larger pore volume and specific surface area, which could provide more active sites for the NH3-SCR in deNOx reaction; (ii) according to the published report, usually NO conversion on per unit of the specific surface area increased with Mn valence state increase, and the activity order of manganese oxides is: MnO2 > Mn5O8 > Mn2O3 > Mn3O4.Reference Tang, Jiang, Liu and Sun24 The XPS characterization results showed that the catalyst prepared with Mn/Fe (1:1) exhibited more Mn4+ species and active oxygen species on surface compared to other catalysts, both of which could promote the SCR reaction effectively; (iii) in situ FT-IR spectroscopy analysis showed that, there existed more Brönsted and Lewis acid sites on the catalyst prepared with Mn/Fe (1:1), which could strengthen the adsorption of reducing reagents (NH3 molecules) on the surface.
Low-temperature SCR activity of Fe2O3, Mn2O3 and MnOx–FeOy composite oxide catalysts prepared with different Mn/Fe mass ratios (1:1, 2:1, 4:1, and 8:1).
B. Comparison of MnOx–FeOy catalysts prepared by SAS and coprecipitation methods
To examine the influence of SAS method on catalyst performances, the catalysts prepared by coprecipitation (CP) method were used as reference, and they were named as Mn–Fe–O-SAS and Mn–Fe–O-CP, respectively.
1. XRD characterization
Figure 7 shows the XRD patterns of MnOx–FeOy catalysts prepared by different methods. Mn–Fe–O-SAS catalyst mainly showed the characteristic diffraction peaks of Mn2O3 with cubic bixbyite structure (JCPDS card no. 24-0508), those of MnO2 (110) crystal plane (2θ = 28.9°) could also be found, but the iron oxide diffraction peaks did not appear. While, in addition to Mn2O3 diffraction peaks, α-Fe2O3 diffraction peaks (JCPDS card no. 33-0664) also emerged in the XRD pattern of Mn–Fe–O-CP catalyst, which showed that Fe species were well dispersed in the MnOx–FeOy composite catalysts prepared by SAS method. Therefore, SAS approach could promote the interaction between manganese and iron, and result in the increase of Mn valence state. According to the features of SAS technology, the solvent reached to a high supersaturation degree instantly during preparation of the precursor particles, thus the precursor salts (acetylacetonates of manganese and iron) were uniformly dispersed in small catalyst particles, which greatly promoted the interaction between manganese and iron. Iron element would be easily embedded in manganese oxide lattice during calcination. Therefore, the SAS method is more conducive to promote the formation of MnOx–FeOy solid solution.
XRD patterns of MnOx–FeOy composites of (a) Mn–Fe–O-SAS and (b) Mn–Fe–O-CP.
2. Pore structure analysis
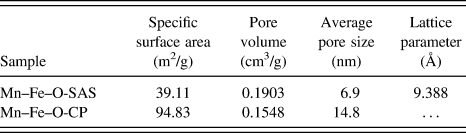
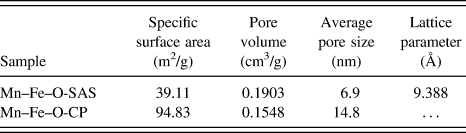
The structure parameters are shown in Table III. BET calculation results showed that the specific surface area of catalyst Mn–Fe–O-CP is 2.4 times of Mn–Fe–O-SAS, but Mn–Fe–O-SAS has larger pore volume than Mn–Fe–O-CP. Moreover, the pore size distribution of catalyst Mn–Fe–O-CP was not particularly concentrated with an average pore size of 14.8 nm; while Mn–Fe–O-SAS presented uniform pore size distribution with an average pore size of 7.0 nm. It can be inferred that the pore structure of catalyst Mn–Fe–O-SAS showed excellent thermal stability, and SAS method was helpful to the formation of hollow structure and lattice defects.
Structure parameters of MnOx–FeOy composite oxide catalysts.
3. NH3-TPD characterization
To investigate the effect of different preparation methods on the acid sites of catalyst surface, NH3-TPD measurements were conducted, and the results are shown in Fig. 8. The peak below 100 °C could be attributed to the desorption of physically adsorbed NH3. The peak at 120–140 °C corresponding to the desorption of NH4+ weakly bounded to surface hydroxyls, and the peak at 200–230 °C were caused by the desorbed NH4+ strongly bounded to Brönsted acid sites and coordinated NH3 bounded to Lewis acid sites.Reference Liu, He, Ding and Zhang26,Reference Ma, Li, Shi and Arandiyan32,Reference Eigenmann, Maciejewski and Baiker33 The integration area of each desorption peak was calculated with integral range between 30 and 400 °C. Although the specific surface area of Mn–Fe–O-SAS sample is much smaller than Mn–Fe–O-CP, its NH3-TPD profile integration area is 2.1 times of Mn–Fe–O-CP sample. Therefore, Mn–Fe–O-SAS contained more acid sites on the units of specific surface area may be because of the fact that SAS method is conducive to the mutual dispersion between manganese and iron (see XRD analysis), and enhanced the interaction between manganese and iron. Comparing Mn–Fe–O-SAS with Mn–Fe–O-CP, the former presented strong NH3 desorption peak at high temperature, since iron are embedded into the lattice of manganese oxide, and formed a more distorted lattice defect structure, which could strengthen the adsorption of NH3.
NH3-TPD profiles of MnOx–FeOy composites of (a) Mn–Fe–O-SAS and (b) Mn–Fe–O-CP.
4. In situ DRIFT characterization
Figure 9 shows the in situ DRIFT spectra of catalyst Mn–Fe–O-SAS and Mn–Fe–O-CP. The intensity of characteristic peak of NH3 adsorbed on Mn–Fe–O-CP surface rapidly decreased with the rise of temperature, and when the temperature reached to 300 °C, NH3 molecules on the catalyst surface were desorbed completely. For the Mn–Fe–O-SAS catalyst, though surface absorption peak gradually weakened with temperature increase. As the temperature reached 300 °C, the strong absorption peak of surface NH3 molecules was still retained, which indicated that there existed more well-dispersed strong acid sites on the surface of catalyst Mn–Fe–O-SAS. Therefore, Mn–Fe–O-SAS presented high NH3 adsorption capacity within the reaction temperature range (100–260 °C).
In situ DRIFT spectra of MnOx–FeOy composites of (a) Mn–Fe–O-SAS and (b) Mn–Fe–O-CP.
5. SCR activity tests
The low-temperature activity test results of Mn–Fe–O-SAS and Mn–Fe–O-CP are shown in Fig. 10. The initial activation temperature of Mn–Fe–O-CP catalyst is rather low, however, when the temperature reached 150 °C, they showed similar activity, NO conversion rate became almost the same (about 70%), with further increase of temperature, the catalytic activity of Mn–Fe–O-SAS increased more quickly and was gradually larger than that of Mn–Fe–O-CP. When the reaction temperature was about 220 °C, NO conversion rate of Mn–Fe–O-SAS reached to the highest reactivity 97%. Moreover, the NO conversion rate remained above 92% between 180 and 260 °C, which is a wider active temperature window. According to the NH3-TPD and in situ DRIFT characterization results, the surface of Mn–Fe–O-SAS existed to be more strong acid sites, and acid sites number is the direct factor for DeNOx reaction. Which presented high adsorption capacity for NH3, and provided more active species for the NH3-SCR reaction. Therefore, the SAS preparation approach helped to improve the low-temperature SCR activity, and developed a wider active temperature window.
Low-temperature SCR activity of MnOx–FeOy composites of Mn–Fe–O-SAS and Mn–Fe–O-CP.
IV. CONCLUSIONS
Through the SAS process, a series of nonsupported MnOx–FeOy composite oxide catalysts with different Mn/Fe ratios were successfully prepared. The following conclusions could be obtained:
(1) All MnOx–FeOy particles prepared by SAS method owned hollow structure and the average particle size was about 50 nm; the iron doping had little effect on the hollow structure and particle size of the catalysts.
(2) When the mass ratio of Mn(acac)3 to Fe(acac)3 in the precursor was 1:1, the prepared catalyst showed more crystal lattice defects and surface active oxygen species, which could increase the specific surface area, as well as strong Brönsted and Lewis acid sites on the surface. Thus the composite oxide catalyst prepared with a mass ratio of Mn/Fe (1:1) showed higher SCR activity at low temperature and a wider active temperature window.
(3) MnOx–FeOy composite oxide catalysts prepared by SAS method showed higher catalytic activity than that prepared by traditional coprecipitation method, because SAS method can contribute to the dispersion and interaction between manganese and iron, thus more Lewis acid and Brönsted acid sites could be formed. Activity evaluation showed that catalyst prepared by SAS method has higher activity and wider active temperature window. At 220 °C, the NO conversion rate reached the maximum 97%, moreover, the conversion rate could be maintained above 92% between 180 and 260 °C.
ACKNOWLEDGMENTS
The authors are grateful for the financial support of the National Natural Science Foundation of China (No. 20976120) and Natural Science Foundation of Tianjin (No. 09JCYBJC06200).