


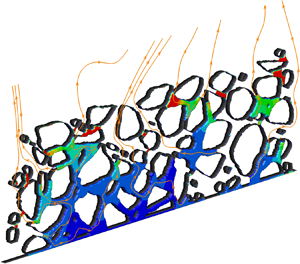



1. Introduction
Drying of a colloidal suspension finds a wide range of applications in various fields, from pharmaceutical, ink-jet printing, nanomaterial fabrication to cooling of integrated chips (Park & Moon Reference Park and Moon2006; Hamon et al. Reference Hamon2012; Su et al. Reference Su2020; Qin et al. Reference Qin, Zhao, Kang, Brunschwiler, Carmeliet and Derome2021a). It is a dynamic, coupled process of liquid drying together with nanoparticle transport, accumulation and deposition (Qin et al. Reference Qin, Su, Zhao, Mazloomi Moqaddam, Carro, Brunschwiler, Kang, Song, Derome and Carmeliet2020). Multi-physical phenomena occur during this process, including liquid/gas flows, phase change, heat transfer and mass transport. Drying of a colloidal suspension in porous media is significantly more complex because capillary flows in pores may influence both the drying dynamics and the nanoparticle behaviour. Additionally, nanoparticle depositions change the porous structure, which further influence the different multiphase flows and, thus, global drying process. Accurate modelling of the drying of a colloidal suspension confronts the significant challenges of resolving all these phenomena.
The development of theoretical and numerical models of drying of a colloidal suspension originated from droplet studies. The coffee ring effect is commonly observed in our daily life, i.e. a ring-shaped deposition forms at the contact line after a coffee drop evaporates. Deegan et al. (Reference Deegan, Bakajin, Dupont, Huber, Nagel and Witten1997) were the first to explain that the capillary flow from the droplet apex to its periphery induced by unequal evaporation rate is responsible for the transport of nanoparticles and, thus, the formation of the coffee ring. They proposed a theoretical model to predict the flow and solute transport within the droplet, agreeable with experimental results (Deegan et al. Reference Deegan, Bakajin, Dupont, Huber, Nagel and Witten2000). Hu & Larson (Reference Hu and Larson2005, Reference Hu and Larson2006) applied a finite element method (FEM) to account for the temperature effect on the surface and internal flows in a droplet. The modelling results show that the coffee ring deposition may be reversed by the Marangoni flow, which is induced by surface tension differences stemming from a temperature difference. Later, by coupling the FEM solving fluid flow, heat and mass transfer, and the continuum advection–diffusion equation solving nanoparticle transport, Bhardwaj, Fang & Attinger (Reference Bhardwaj, Fang and Attinger2009) numerically modelled the flow fields, evaporation time and deposit shapes under various conditions, showing good agreement with published experimental and numerical results. Kaplan & Mahadevan (Reference Kaplan and Mahadevan2015) proposed a multiphase model to investigate the drying dynamics and particle deposits, by coupling the inhomogeneous evaporation and flow dynamics inside the droplet. They successfully modelled the transition from coffee ring to uniform deposition, i.e. the nanoparticles deposit approximately uniformly on the substrate surface after droplet evaporation. Furthermore, Man & Doi (Reference Man and Doi2016), Wu, Man & Doi (Reference Wu, Man and Doi2018) proposed a theoretical model able to reproduce the ring-to-mountain transition and multiple ring depositions, controlled by the mobility of the contact line and the evaporation rate. The mountain-type deposition indicates that the nanoparticle amount increases from droplet contact line to the centre, similar to a mountain shape. Wei, Deng & Chen (Reference Wei, Deng and Chen2016) developed a theoretical model for the evaporation of a nanofluid droplet with insoluble nanoparticles. They studied the influence of initial nanoparticle concentration and Péclet number on the evaporation process and the resultant shell or sphere formation by nanoparticle precipitation when a droplet shrinks to a certain volume. They also found that the droplet diameter law is no longer guaranteed, i.e. the droplet diameter squared does not decrease linearly with time. Apart from the modelling of a colloidal droplet, Wang et al. (Reference Wang, Zhou, Sun, Xu, Ouyang and Wang2020) put forward a one-dimensional (1-D) numerical model to investigate the drying of a colloidal suspension in a capillary tube with two open ends, considering the coupling effect of evaporation, diffusion and convection. The numerical results agree with their own experiments on the nanoparticle volume fraction profiles. Concerning drying in porous media, the fluid flow and transport were solved based on the classical averaged equations of hydrodynamics and transport equation (Guglielmini et al. Reference Guglielmini, Gontcharov, Aldykiewicz and Stone2008; Veran-Tissoires & Prat Reference Veran-Tissoires and Prat2014). With this method, the modelling of evaporation, particle transport and precipitation was achieved at field scale. Using this model, Le, Hoang & Mahadevan (Reference Le, Hoang and Mahadevan2009) found that the consideration of capillary wicking could significantly affect solid salt transport and crystallization. Despite the success in revealing some drying and transport mechanics, these models are constructed at continuum scale; thus, unable to model the flow and heat/mass transfer at pore scale.
As a mesoscale approach using a Cartesian mesh, the lattice Boltzmann method (LBM) (Chen et al. Reference Chen, Kang, Mu, He and Tao2014; Gan et al. Reference Gan, Xu, Zhang and Succi2015; Li et al. Reference Li, Luo, Kang, He, Chen and Liu2016b; Fei & Luo Reference Fei and Luo2017; Huang, Wu & Adams Reference Huang, Wu and Adams2021; Liu et al. Reference Liu, Lu, Li, Yu and Sahu2021) is advantageous in modelling multiphase flows in arbitrary porous media, since it can automatically capture the interface by incorporating intermolecular-level interactions and easily deal with arbitrary geometry. For liquid drying, various advanced LBMs have been proposed. Fei et al. (Reference Fei, Qin, Wang, Luo, Derome and Carmeliet2022a) studied the drying of a suspended droplet in a confined space, and found that the diameter square law is not strictly obeyed in the final stage. Zhang et al. (Reference Zhang, Zhang, Zhang, Yang and Cheng2021a) modelled drying of a sessile droplet on flat surfaces, and achieved drying processes undergoing constant contact angle, constant contact radius and mixed modes, respectively. Qin et al. (Reference Qin, Del Carro, Mazloomi Moqaddam, Kang, Brunschwiler, Derome and Carmeliet2019a) modelled non-isothermal drying in spiral- and gradual-shaped quasi-two-dimensional porous structures dominated by capillarity, and achieved good agreement with the experimental results. They further extended their approach to consider the influence of contact angle hysteresis on the liquid configuration and drying rate (Qin et al. Reference Qin, Zhao, Kang, Derome and Carmeliet2021b). Panda et al. (Reference Panda, Supriya, Kharaghani, Tsotsas and Surasani2020b) revealed the transformation of hydraulic films to adsorbed films in irregular pore structures. They further investigated the thermal gradient effect on a stabilizing or destabilizing drying front, obtaining agreeable results with pore network model modelling (Panda et al. Reference Panda, Paliwal, Sourya, Kharaghani, Tsotsas and Surasani2020a). Zachariah, Panda & Surasani (Reference Zachariah, Panda and Surasani2019) extended the LBM from diffusive drying to convective drying, but with the limit of the non-condensable gaseous phase to small volume fraction. Recently, Fei et al. (Reference Fei, Qin, Zhao, Derome and Carmeliet2022b) improved this model to a high volume fraction of the non-condensable gaseous phase by using the cascaded collision model, and investigated the influence of different parameters on drying rate (Fei et al. Reference Fei, Qin, Zhao, Derome and Carmeliet2023). Regarding drying of a colloidal suspension, two different approaches of taking care of nanoparticles are put forward. In the Lagrangian method, the particles are modelled explicitly by Newton's second law. The force and torque for each particle are calculated and the trajectory can be recorded. Joshi & Sun (Reference Joshi and Sun2009, Reference Joshi and Sun2010) proposed both two-dimensional (2-D) and three-dimensional (3-D) LBMs to model drying of a colloidal droplet, and studied the influence of particle size and volume fraction on the droplet spreading dynamics and final deposition of particles. Using a similar approach, Zhao & Yong (Reference Zhao and Yong2017) studied the influence of surface wettability of interface-bound nanoparticles on the droplet surface tension and evaporation rate. Recently, Zhang et al. (Reference Zhang, Zhang, Zhao and Yang2021b) applied the immersed boundary scheme to model nanoparticle transport in a drying droplet, and realized the 2-D coffee ring deposition. Despite its advantages, two main disadvantages lie in the Lagrangian method, i.e. the difficulty in modelling large amounts of nanoparticles and the parallelization challenge. Different from the Lagrangian method tracking each individual particle, the Eulerian method represents the nanoparticles as a solute concentration and solves the nanoparticle transport by a modified convection diffusion equation. Compared with the Lagrangian method, the Eulerian approach is more compatible with LBM, and allows us to easily deal with large amounts of nanoparticles since they are represented as a solute. Nath & Ray (Reference Nath and Ray2021) applied a double-distribution LBM to reproduce desired microstructures by nanoparticle deposition after evaporation of a particle-laden droplet, with the manipulation of surface chemical heterogeneity to control contact line motion. Qin et al. (Reference Qin, Mazloomi Moqaddam, Del Carro, Kang, Brunschwiler, Derome and Carmeliet2019b, Reference Qin, Su, Zhao, Mazloomi Moqaddam, Carro, Brunschwiler, Kang, Song, Derome and Carmeliet2020) developed a tricoupled hybrid LBM to model drying of a colloidal suspension in various micropore structures, and achieved good agreement with microfluidic experimental results. The Eulerian method has been successfully applied to various studies including advanced optical material fabrication (Su et al. Reference Su2020), synthesis of nanoparticles (Chen et al. Reference Chen2022), immunosensing biochip design (Chi et al. Reference Chi2022), etc.
Despite the developments of Eulerian-type LBM in modelling colloid drying, the influence of local nanoparticles on drying dynamics and resultant deposition configurations is not yet reported in the literature. In fact, experimental work has shown that nanoparticles affect the thermal (Berger Bioucas et al. Reference Berger Bioucas, Rausch, Schmidt, Bück, Koller and Fröba2020), hydraulic (Manley & Mason Reference Manley and Mason1955; Pabst, Gregorová & Berthold Reference Pabst, Gregorová and Berthold2006) and interfacial properties (Wei et al. Reference Wei, Deng and Chen2016; Yong, Qin & Singler Reference Yong, Qin and Singler2016) of a base fluid, including its thermal conductivity and capacity, dynamic viscosity, surface tension, etc., as the nanoparticles are not only immersed in liquid but may cover a certain area of the liquid–gas interface. Mueller, Llewellin & Mader (Reference Mueller, Llewellin and Mader2010) studied the influence of nanoparticles of different aspect ratios on the effective viscosity of the suspension, covering a wide volume fraction range from dilute to highly concentrated. Fan & Striolo (Reference Fan and Striolo2012) derived a linear relation of the effective surface tension versus interfacial area occupied by the nanoparticles, without consideration of nanoparticle interaction. By utilizing the many-body dissipative particle dynamics method, compared with this linear relation, Yong et al. (Reference Yong, Qin and Singler2016) found the surface tension actually decreases less at low and more at high nanoparticle volume fractions, when nanoparticle interaction is accounted for. Both theoretical (Wei et al. Reference Wei, Deng and Chen2016) and experimental (Gan & Qiao Reference Gan and Qiao2011) results have shown that the presence of nanoparticles at the liquid–vapour interface reduces the local evaporation rate. However, none of these local nanoparticle effects are considered in existing Eulerian-type LBM, indicating that the current models may underestimate the local liquid viscosity/thermal conductivity and overestimate the surface tension/evaporation rate when modelling drying of a colloidal suspension, as explored in the abovementioned literature. When considering modelling drying of porous media, where these effects are quite local and may have different relative manifestation depending on pore geometry, the nanoparticle local influence on drying dynamics and its resultant deposition is more complex and unpredictable, as shown below in § 5.
In current work our main scientific purpose is to develop an accurate model to simulate drying of a colloidal suspension by considering the local nanoparticle effects on drying dynamics and deposition configuration, and further apply the proposed model to investigate the complicated drying of porous media under various conditions. The rest of the paper is organized as follows. We first implement the double-distribution multiple-relaxation-time (MRT) LBM in § 2, where the first distribution models isothermal two-phase flow and the second one nanoparticle transport and deposition.For the latter part, we propose to use a force term to consider the nanoparticle–fluid interaction, which has been verified to be more stable than incorporating this interaction in the velocity term (Nath & Ray Reference Nath and Ray2021). Afterwards in § 2, we propose a method to incorporate three local nanoparticle effects on drying of a colloidal suspension, namely the increase in liquid dynamic viscosity, the drop of liquid–vapour surface tension and the reduction of local drying rate by interface coverage. In § 4 the proposed model is validated for two cases: the drying of a suspended colloidal droplet and a capillary tube with both ends open. In § 5 the drying of a colloidal suspension in a 2-D complex porous medium is studied varying parameters like initial nanoparticle volume fraction, porous medium wettability, nanoparticle wettability and diffusion coefficient. Finally, a universal equation for the drying rate considering different variables is proposed and verified. Section 6 concludes the present work.
2. Numerical modelling
2.1. Liquid–vapour two-phase model
2.1.1. Multiple-relaxation-time pseudopotential lattice Boltzmann model
To simulate two-phase flow with thermodynamic consistency, we apply the MRT pseudopotential LBM proposed by Li, Luo & Li (Reference Li, Luo and Li2013). The simulations in the current work are in two dimensions, and a standard D2Q9 lattice framework is applied. Incorporating the external force term, the lattice Boltzmann (LB) equation for the populations of discrete velocities is written as
 \begin{equation}
{f_i}({\boldsymbol{x}} +
{{\boldsymbol{c}}_{\boldsymbol{i}}}{\rm \Delta} t,t + {\rm \Delta} t)
= {f_i}({\boldsymbol{x}},t) -
{({{\boldsymbol{\mathsf{M}}}^{{\boldsymbol{ -
1}}}}{\boldsymbol{\varLambda} \boldsymbol{\mathsf{M}}})_{ij}}(\,{f_j} - f_j^{eq}) +
{\rm \Delta} tF_i',
\end{equation}
where  ${f_i}$ (
 $\,f_i^{eq}$) is the (equilibrium) discrete density distribution function,
 ${{\boldsymbol {c}}_{\boldsymbol {i}}} = ({c_{ix}},{c_{iy}})$ is the discrete velocity in the
 ${i}$th direction,
 ${\rm \Delta} t$ is the time step,
 $F_i'$ represents the forcing term in the velocity space,
 ${\boldsymbol {\varLambda }} = (\tau _\rho ^{ - 1},\tau _{e}^{ - 1},\tau _\zeta ^{ - 1},\tau _j^{ - 1},\tau _q^{ - 1},\tau _j^{ - 1},\tau _q^{ - 1},\tau _v^{ - 1},\tau _v^{ - 1})$ is the diagonal matrix and
 ${\boldsymbol{\mathsf{M}}}$ is the orthogonal transformation matrix. Using the transformation matrix, the right-hand side of (2.1) can be rewritten as
 \begin{equation} {\boldsymbol{m}}^* = {\boldsymbol{m}} - {\boldsymbol{\varLambda }}({\boldsymbol{m - }}{{\boldsymbol{m}}^{eq}}) + {\rm \Delta} t\left({\boldsymbol{\mathsf{I}}} - \frac{{\boldsymbol{\varLambda }}}{2}\right){\boldsymbol{S}}, \end{equation}
where  ${\boldsymbol {m}} = {\boldsymbol{\mathsf{M}}\boldsymbol {f}}$,
 ${\boldsymbol{\mathsf{I}}}$ is the unit tensor,
 ${\boldsymbol {S}}$ is the forcing term in the moment space with
 $({\boldsymbol{\mathsf{I}}} - {{\boldsymbol {\varLambda }}}/{2}){\boldsymbol {S}} = {\boldsymbol{\mathsf{M}}\boldsymbol {F'}}$, and the equilibria
 ${{\boldsymbol {m}}^{eq}}$ are given by
 \begin{equation} {{\boldsymbol{m}}^{eq}} = \rho {(1, - 2 + 3|{\boldsymbol{u}}{|^2},1 - 3|{\boldsymbol{u}}{|^2},{u_x}, - {u_x},{u_y}, - {u_y},u_x^2 - u_y^2,{u_x}{u_y})^T}.\end{equation}
In the diagonal matrix, the parameters are selected as  $\tau _\rho ^{ - 1} = \tau _j^{ - 1} = 1.0,\tau _{e}^{ - 1} = \tau _\zeta ^{ - 1} = \tau _q^{ - 1} = 1.1$ to achieve good stability (Li et al. Reference Li, Luo and Li2013). The relaxation time
 ${\tau _v}$ is determined using the fluid kinematic viscosity with
 $\nu = c_s^2({\tau _v} - 0.5){\rm \Delta} t$, where
 ${c_s} = c/\sqrt 3$ is the speed of sound and
 $c=1$ is the lattice speed. The dynamic viscosity is represented as
 $\eta = \rho \nu$. The propagation process of the MRT LBM is written as
 \begin{equation} {f_i}({\boldsymbol{x}} + {{\boldsymbol{c}}_{\boldsymbol{i}}}{\rm \Delta} t,t + {\rm \Delta} t) = f_i^*({\boldsymbol{x}},t),\end{equation}
with the post-collision distribution  $f^* = {{\boldsymbol{\mathsf{M}}}^{ - 1}}{\boldsymbol {m}}^*$. The macroscopic forcing terms
 ${\boldsymbol {S}}$ from Li et al. (Reference Li, Luo and Li2013) are used,
 \begin{gather} \left.\begin{array}{c@{}}
{S_0} = 0, \quad {S_1} = 6({u_x}{F_x} + {u_y}{F_y}) +
{12\chi |{\boldsymbol{F}}{|^2}} / {[{\psi ^2}{\rm \Delta}
t({\tau_e} - 0.5)]}, \quad {S_2} ={-} {S_1},\quad {S_3} =
{F_x},\\ {S_4} ={-} {F_x},\quad {S_5} = {F_y},\quad {S_6}
={-} {F_y},\quad {S_7} = 2({u_x}{F_x} - {u_y}{F_y}),\quad
{S_8} = {u_x}{F_y} + {u_y}{F_x}, \end{array} \right\}
\end{gather}
where  $|{\boldsymbol {F}}| = \sqrt {F_x^2 + F_y^2}$,
 $\chi$ is a tuning parameter to adjust mechanical stability of the LBM. Following Li, Luo & Li (Reference Li, Luo and Li2012),
 $\chi =0.105$ is set in the present study to achieve thermodynamic consistency, making the liquid–vapour density ratio consistent with the Maxwell construction. Here
 $\psi$ is the interaction potential that will be described later. Generally,
 ${\boldsymbol {F}}$ includes fluid–fluid/fluid–solid interactions
 ${{\boldsymbol {F}}_f}$ and other body forces;
 ${{\boldsymbol {F}}_f}$ is given by
 \begin{equation} {{\boldsymbol{F}}_f} ={-} G\psi ({\boldsymbol{x}})\sum_{i = 1}^8 {w(|{{\boldsymbol{c}}_i}{|^2})} \psi ({\boldsymbol{x}} + {{\boldsymbol{c}}_i}){{\boldsymbol{c}}_i},\end{equation}
where  $G = - 1$ is the interaction strength and
 $w(|{{\boldsymbol {c}}_i}{|^2})$ are the force weights. The interaction potential
 $\psi$ is given by incorporating the non-ideal equation of state (EoS)
 ${p_{EoS}}$ as
 $\psi = \sqrt {{{2({p_{EoS}} - \rho c_s^2)}/{G{c^2}}}}$ (Yuan & Schaefer Reference Yuan and Schaefer2006). In this paper, we use the Carnahan–Starling EoS
 \begin{equation} {p_{EoS}} = \rho RT\frac{{1 + b\rho /4 + {{(b\rho /4)}^2} - {{(b\rho /4)}^3}}}{{{{(1 - b\rho /4)}^3}}} - a{\rho ^2}, \end{equation}
where  $a = 0.4963{R^2}T_c^2/{p_c},b = 0.18727R{T_c}/{p_c}$,
 $R$ is the gas constant,
 ${T_c}$ and
 ${p_c}$ are critical temperature and pressure, respectively. The parameters
 $a, b$ and
 $R$ are used to determine
 $T_c$ and
 $p_c$, and they may affect the numerical performance. Huang, Krafczyk & Lu (Reference Huang, Krafczyk and Lu2011) have studied the influences of these parameters on interface thickness, density ratio and numerical stability. In the current simulations,
 $a = 1,b = 4,R = 1$ are used following Yuan & Schaefer (Reference Yuan and Schaefer2006), Huang et al. (Reference Huang, Krafczyk and Lu2011), to realize an acceptable interface thickness of around five lattices and a small spurious current of
 $\sim {10^{-3}}$, while ensuring numerical stability. The Carnahan–Starling rather than Peng–Robinson EoS is chosen, since a higher density ratio can be achieved for the case of modelling evaporation, as reported in the literature (Li, Zhou & Yan Reference Li, Zhou and Yan2016c; Moqaddam, Derome & Carmeliet Reference Moqaddam, Derome and Carmeliet2018; Qin et al. Reference Qin, Del Carro, Mazloomi Moqaddam, Kang, Brunschwiler, Derome and Carmeliet2019a; Yu et al. Reference Yu, Yin, Li and Tang2022). To implement the contact angle and its hysteresis, the unknown
 $\psi$ of the solid nodes is calculated using a virtual wall density
 ${\rho _w}$. The rule to determine
 ${\rho _w}$ will be discussed below in subsection 2.1.2.
To achieve a tunable liquid–vapour surface tension  ${\gamma _{lv}}$, an additional source term
 ${\rm \Delta} t{\boldsymbol {C}}$ is added to the right-hand side of (2.2), as done by Li & Luo (Reference Li and Luo2013),
 \begin{align} {\boldsymbol{C}} &=
(0,1.5\tau_e^{ - 1}({{\mathsf{Q}}_{xx}} + {{\mathsf{Q}}_{yy}}), - 1.5\tau_\zeta
^{ - 1}({{\mathsf{Q}}_{xx}} + {{\mathsf{Q}}_{yy}}),0,0,0,0,\nonumber\\ &\quad - \tau_v^{ -
1}({{\mathsf{Q}}_{xx}} - {{\mathsf{Q}}_{yy}}), - \tau_v^{ -
1}{{\mathsf{Q}}_{xy}})^T,\end{align}
where the variables  ${{\mathsf{Q}}_{xx}},{{\mathsf{Q}}_{yy}},{{\mathsf{Q}}_{xy}}$ are calculated using a tensor
 \begin{equation} {\boldsymbol{\mathsf{Q}}} = \kappa \frac{G}{2}\psi ({\boldsymbol{x}})\sum_{i = 1}^8 {w(|{{\boldsymbol{c}}_i}{|^2})} [\psi ({\boldsymbol{x}} + {{\boldsymbol{c}}_i}) - \psi ({\boldsymbol{x}})]{{\boldsymbol{c}}_i}{{\boldsymbol{c}}_i},\end{equation}
and  $\kappa \in (0,1)$ is a parameter to tune the surface tension. The resultant surface tension follows a simple linear decrease of
 $\kappa$ as
 \begin{equation} {\gamma_{lv}}/{\gamma_{lv,0}} = 1 - \kappa.\end{equation}
With the above equations, the Navier–Stokes equations can be recovered through the Chapman–Enskog expansion under a low-Mach-number limit (McCracken & Abraham Reference McCracken and Abraham2005),
 \begin{equation} \left.\begin{array}{c@{}} \displaystyle {\dfrac{{\partial \rho }}{{\partial t}} + \boldsymbol{\nabla} \boldsymbol{\cdot} (\rho {\boldsymbol{u}}) = 0}, \\ \displaystyle \dfrac{{\partial (\rho {\boldsymbol{u}})}}{{\partial t}} + \boldsymbol{\nabla} \boldsymbol{\cdot} (\rho {\boldsymbol{uu}}) ={-} \boldsymbol{\nabla} (\rho c_s^2) + \boldsymbol{\nabla} \boldsymbol{\cdot} {\boldsymbol{\varPi }} + {\boldsymbol{F}} + {\boldsymbol{\xi }}, \end{array} \right\} \end{equation}
where  ${\boldsymbol {\varPi }} = \eta [\boldsymbol {\nabla } {\boldsymbol {u}} + {(\boldsymbol {\nabla } {\boldsymbol {u}})^T}] + ({\eta _b} - \eta )(\boldsymbol {\nabla } \boldsymbol {\cdot } {\boldsymbol {u}}){\boldsymbol{\mathsf{I}}}$ is the viscous stress tensor, in which
 $\eta = \rho c_s^2({\tau _v} - 0.5){\rm \Delta} t$ and
 ${\eta _b} = \rho c_s^2({\tau _e} - 0.5){\rm \Delta} t$ are the dynamic and bulk viscosity, respectively. The part
 ${\boldsymbol {\xi }} = - 2{G^2}{c^4}\chi \boldsymbol {\nabla } \boldsymbol {\cdot } (|\boldsymbol {\nabla } \psi {|^2}{\boldsymbol{\mathsf{I}}}) - \frac {1}{6}G{c^4}\kappa \boldsymbol {\nabla } \boldsymbol {\cdot } (\psi {\nabla ^2}\psi {\boldsymbol{\mathsf{I}}} - \psi \boldsymbol {\nabla } \boldsymbol {\nabla } \psi )$ includes the additional terms, where the first term is used to adjust the model stability (Li et al. Reference Li, Luo and Li2012), and the other two terms to independently adjust the surface tension (Li & Luo Reference Li and Luo2013). The parameters of
 $\chi$ and
 $\kappa$ in
 ${\boldsymbol {\xi }}$ are discussed in (2.5) and (2.10). The macroscopic variables of the two-phase flow are calculated as
 \begin{equation} \rho = \sum_{i = 0}^8 {{f_i}} ,{\boldsymbol{u}} = \frac{1}{\rho }\left(\sum_{i = 0}^8 {{f_i}} {{\boldsymbol{c}}_i} + \frac{{{\rm \Delta} t{\boldsymbol{F}}}}{2}\right). \end{equation}
For simplicity, the energy equation (Li et al. Reference Li, Kang, Francois and Hu2016a; Qin et al. Reference Qin, Del Carro, Mazloomi Moqaddam, Kang, Brunschwiler, Derome and Carmeliet2019a) describing the heat transfer is not included here in current simulations, and we limit our case to quasi-static evaporation under isothermal conditions. The influence of heat transfer including latent heat effects will be studied in future work.
2.1.2. Implementation of contact angle and its hysteresis
To more accurately prescribe the contact angle in a wide range with a smaller spurious current and to get rid of an unphysical fluid layer (see figures S1 and S2 in the supplementary material available at https://doi.org/10.1017/jfm.2023.344), we apply the geometric formulation scheme (Ding & Spelt Reference Ding and Spelt2007; Qin et al. Reference Qin, Zhao, Kang, Derome and Carmeliet2021b) for flat surfaces and the improved virtual wall density scheme proposed by Li, Yu & Luo (Reference Li, Yu and Luo2019) for curved boundaries, instead of the traditional method using a globally identical virtual wall density (Li et al. Reference Li, Luo, Kang and Chen2014).
For flat surfaces with a constant  $x$ or
 $y$ coordinate as illustrated in figure 1(a), the contact angle
 $\theta$ satisfies the following relation (Ding & Spelt Reference Ding and Spelt2007):
 \begin{equation} \tan \left(\frac{{\rm \pi} }{2} - \theta \right) ={-} \frac{{\partial \rho /\partial y}}{{|{\partial \rho /\partial x} |}}.\end{equation}
In this paper, the half-way bounce-back scheme is applied to realize the no-slip boundary, as shown in figure 1(b). Under this condition, the partial derivatives in (2.13) are calculated by
 \begin{equation} \left. \begin{array}{c@{}} \displaystyle \dfrac{{\partial {\rho_{x,1/2}}}}{{\partial x}} = 1.5\dfrac{{\partial {\rho_{x,1}}}}{{\partial x}} - 0.5\dfrac{{\partial {\rho_{x,2}}}}{{\partial x}}, \quad \text{where }\dfrac{{\partial {\rho _{x,y}}}}{{\partial x}} = \dfrac{{{\rho_{x + 1,y}} - {\rho_{x - 1,y}}}}{{2\delta x}},\\ \displaystyle \dfrac{{\partial {\rho_{x,1/2}}}}{{\partial y}} = \dfrac{{{\rho_{x,1}} - {\rho_{x,0}}}}{{\delta y}}.\end{array} \right\} \end{equation}
Combining (2.13) and (2.14), the wall density  ${\rho _w}$ is expressed as
 \begin{equation} {\rho_w} = {\rho_{x,0}} = {\rho_{x,1}} + \tan \left(\frac{{\rm \pi} }{2} - \theta \right)| {\partial {\rho _{x,1/2}}/\partial x} |.\end{equation}
For the automatic measurement of the local contact angle  ${\theta _m}$, we use the transformation of (2.13), i.e.
 \begin{equation} {\theta_m} = \frac{{\rm \pi} }{2} + {\rm{atan}}\left(\frac{{\partial \rho /\partial y}}{{| {\partial \rho /\partial x}|}}\right).\end{equation}
The measured local contact angle is used to implement contact angle hysteresis, using the scheme proposed in our previous work (Qin et al. Reference Qin, Zhao, Kang, Derome and Carmeliet2021b). During the simulation, the contact angle is prescribed as
 \begin{equation} \left. \begin{array}{c@{}} {{\theta_p}(t + {\rm \Delta} t) = {\theta_m}(t), {{\boldsymbol{x}}_{{O_c}}} = 0 {\text{ and }} {\theta_A} \ge {\theta_m}(t) \ge {\theta_R}}, \\ {{\theta_p}(t + {\rm \Delta} t) = {\theta_R},\ {{\boldsymbol{x}}_{{O_c}}} \boldsymbol{\cdot}{{\boldsymbol{n}}_s} < 0 {\text{ or }} {\theta_m}(t) < {\theta_R} }, \\ {{\theta_p}(t + {\rm \Delta} t) = {\theta_A},\ {{\boldsymbol{x}}_{{O_c}}} \boldsymbol{\cdot}{{\boldsymbol{n}}_s} > 0 {\text{ or }} {\theta_m}(t) > {\theta_A} }, \end{array} \right\} \end{equation}
where  $O_c$ represents the contact point and
 ${{\boldsymbol {X}}_{{O_c}}}$ indicates its displacement vector, defined as the displacement from the latest to the current iteration. Here
 ${\theta _R}$ and
 ${\theta _A}$ are receding and advancing contact angles, respectively;
 ${{\boldsymbol {n}}_s}$ is the surface vector of the liquid–vapour interface pointing to the vapour phase.
(a) Droplet on a flat surface with contact angle  $\theta$ at contact point
 ${O_C}$. Here
 ${{\boldsymbol {n}}_s}$ is the surface vector of the liquid–vapour interface pointing to the vapour phase, and
 ${{\boldsymbol {X}}_{{O_C}}}$ is the displacement vector of contact point
 ${O_C}$. (b) Illustration of half-way bounce-back scheme on a flat surface.

To consider the more complicated case of drying of a porous media with curved surfaces, where both  $x$ and
 $y$ coordinates change at the solid boundary, the simple and robust contact angle scheme proposed by Li et al. (Reference Li, Yu and Luo2019) is adopted. The virtual wall density
 ${\rho _w}$ is expressed as
 \begin{equation}
{\rho_w} = \left\{ \begin{array}{@{}c@{}} {\varphi
{\rho_{ave}}({\boldsymbol{x}}),\varphi \ge 1\quad {\rm
for}\ \theta \le {\rm{90}}^\circ}, \\
{{\rho_{ave}}({\boldsymbol{x}}) - {\rm \Delta} \rho ,{\rm \Delta}
\rho > 0\quad {\rm for}\ \theta > {\rm{90}}^\circ
}, \end{array}
\right.\end{equation}
where  $\varphi$ and
 ${\rm \Delta} \rho$ are constants. When
 $\varphi$ equals 1,
 ${\rho _w} = {\rho _{ave}}({\boldsymbol {x}})$ representing the neutral surface wettability with a contact angle of
 $\theta = 90^\circ$. The averaged fluid density around the solid node
 ${\rho _{ave}}({\boldsymbol {x}})$ is given as
 \begin{equation} {\rho_{ave}}({\boldsymbol{x}}) = \frac{{\displaystyle \sum_{i = 1}^8 {w(|{{\boldsymbol{c}}_i}{|^2})\rho ( {{\boldsymbol{x}} + {{\boldsymbol{c}}_i}} )I( {{\boldsymbol{x}} + {{\boldsymbol{c}}_i}} )} }}{{\displaystyle \sum_{i = 1}^8 {w(|{{\boldsymbol{c}}_i}{|^2})I( {{\boldsymbol{x}} + {{\boldsymbol{c}}_i}} )} }}, \end{equation}
where  $I( {{\boldsymbol {x}} + {{\boldsymbol {c}}_i}} )$ is an indicator equal to 1 at fluid lattices and 0 otherwise. Here
 $w(|{{\boldsymbol {c}}_i}{|^2})$ is the force weight used in (2.6). Note that, using this contact angle scheme, we need to determine the values for
 $\varphi$ or
 ${\rm \Delta} \rho$ on solid surfaces to achieve the desired contact angle
 $\theta$, rather than being able to define the value of
 $\theta$ directly. Due to this disadvantage, the scheme cannot be directly applied to model contact angle hysteresis and further developments in the future may address a more direct approach. In the current work, in the presence of curved boundaries, a constant contact angle is prescribed using (2.18) and (2.19).
2.2. Nanoparticle transport and deposition model
To make a consistent model, we also use LBM to solve the nanoparticle transport instead of a finite difference method (Qin et al. Reference Qin, Mazloomi Moqaddam, Del Carro, Kang, Brunschwiler, Derome and Carmeliet2019b) as previously proposed. Hence, compared with the SRT model by Nath & Ray (Reference Nath and Ray2021), we use the MRT scheme to improve the model stability and extend the parameter range (Li et al. Reference Li, Luo, Kang, He, Chen and Liu2016b; Wang, Liu & Rajamuni Reference Wang, Liu and Rajamuni2022). Moreover, we incorporate the fluid–particle interaction force term explicitly at the right-hand side of the LB equation, instead of regarding it as a velocity increment (Qin et al. Reference Qin, Mazloomi Moqaddam, Del Carro, Kang, Brunschwiler, Derome and Carmeliet2019b; Nath & Ray Reference Nath and Ray2021). Using this method, the numerical stability is highly enhanced. For instance, this treatment allows us to simulate drying of porous media with diffusion coefficient crossing two orders of magnitude, while the method using velocity increment fails to cover this range. The distribution function  $g$ is utilized to obtain the nanoparticle volume fraction
 $\phi$. Similar to (2.1), the LB equation for the mass transport is
 \begin{equation} {g_i}({\boldsymbol{x}} + {{\boldsymbol{c}}_{\boldsymbol{i}}}{\rm \Delta} t,t + {\rm \Delta} t) = {g_i}({\boldsymbol{x}},t) - {({{\boldsymbol{\mathsf{M}}}^{{\boldsymbol{ - 1}}}}{\boldsymbol{\varLambda \boldsymbol{\mathsf{M}}}})_{ij}}({g_j} - g_j^{eq}) + {\rm \Delta} tG_i'. \end{equation}
The corresponding form in momentum space is
 \begin{equation} {\boldsymbol{n}}^* = {\boldsymbol{n}} - {{\boldsymbol{\varLambda }}_g}({\boldsymbol{n - }}{{\boldsymbol{n}}^{eq}}) + {{\boldsymbol{\varLambda }}_g}{\boldsymbol{G}},\end{equation}
where  ${{\boldsymbol {\varLambda }}_g} = ({s_0},{s_1},{s_2},{s_3},{s_4},{s_5},{s_6},{s_7},{s_8})$ is the diagonal matrix,
 ${{\boldsymbol {n}}^{eq}}$ is the equilibrium moment and
 ${\boldsymbol {G}}$ is the additional force term to incorporate the fluid–particle interaction that prevents the nanoparticles from crossing the liquid–vapour interface. The parameters are set to
 ${s_0} = 1,{s_1} = {s_2} = {s_7} = {s_8} = 2 - {1 /{{\tau _g}}},{s_3} = {s_5} = {1/{{\tau _g}}},{s_4} = {s_6} = 1$ to dispose of the discrete effect of the half-way bounce-back boundary condition (Cui et al. Reference Cui, Hong, Shi and Chai2016). The equilibria are given as
 \begin{equation} {{\boldsymbol{n}}^{eq}} = \phi {(1, - 2 + 3|{{\boldsymbol{u}}_{fm}}{|^2},1 - 3|{{\boldsymbol{u}}_{fm}}{|^2},{u_{fm,x}}, - {u_{fm,x}},{u_{fm,y}}, - {u_{fm,y}})^T},\end{equation}
where  ${{\boldsymbol {u}}_{fm}} = ({u_{fm,x}},{u_{fm,y}})$ is the modified fluid velocity. To ensure nanoparticle transport occurring within the liquid only,
 ${{\boldsymbol {u}}_{fm}}$ is modelled as
 \begin{equation} {{\boldsymbol{u}}_{fm}} = \left\{ \begin{array}{@{}ll} {\boldsymbol{u}}, & \rho \ge 0.95{\rho_l}, \\ 0, & {\rm otherwise}. \end{array} \right. \end{equation}
Following the idea of Li & Luo (Reference Li and Luo2014), Li, Zhou & Yan (Reference Li, Zhou and Yan2017), the force term  $\boldsymbol {G}$ is written as
 \begin{equation} {\boldsymbol{G}} = {(0,0,0,{F_{fp,x}},0,{F_{fp,y}},0,0,0)^T},\end{equation}
where  ${F_{fp,x}}$ and
 ${F_{fp,y}}$ are the
 $x$ and
 $y$ components of fluid–particle interaction force modelled as
 \begin{equation} {{\boldsymbol{F}}_{fp}} ={-} {G_g}\phi ({\boldsymbol{x}})\psi ({\boldsymbol{x}})\sum_{i = 1}^8 {\psi ({\boldsymbol{x}} + {{\boldsymbol{c}}_i}){{\boldsymbol{c}}_i}}.\end{equation}
In (2.25) the interaction strength  ${G_g}$ between the nanoparticles and fluid is determined by ensuring the mass conservation of nanoparticles within the liquid phase. A simple auxiliary simulation of 1-D evaporation of colloidal suspension is conducted to determine
 ${G_g}$, as illustrated in figure S3 of the supplementary material.
From above, the recovered convection diffusion equation is
 \begin{equation} \frac{{\partial \phi }}{{\partial t}} + \boldsymbol{\nabla} \boldsymbol{\cdot} (\phi {{\boldsymbol{u}}_{fm}}) = \boldsymbol{\nabla} \boldsymbol{\cdot} [{D_p}\boldsymbol{\nabla} \phi ] - \boldsymbol{\nabla} \boldsymbol{\cdot} {{\boldsymbol{F}}_{fp}}, \end{equation}
where  ${D_p} = ({\tau _g} - 0.5)c_s^2$ is the nanoparticle diffusion coefficient. The nanoparticle volume fraction can be calculated as
 \begin{equation} \phi = \sum_{i = 0}^8 {{g_i}} .\end{equation}
With the consideration of fluid–particle interaction, the real nanoparticle velocity  ${{\boldsymbol {u}}_p}$ is given as
 \begin{equation} {{\boldsymbol{u}}_p} = {{\boldsymbol{u}}_{fm}} + {\rm \Delta} t{{\boldsymbol{F}}_{fp}}/\phi .\end{equation}
For the implementation of an evaporation boundary condition, the reader is referred to Qin et al. (Reference Qin, Zhao, Kang, Derome and Carmeliet2021b).
3. Consideration of local nanoparticle effect
In this section we propose a method to consider the influence of nanoparticles on the fluid dynamics in three aspects, i.e. increase of liquid viscosity, drop of surface tension and reduction of drying rate, considering a large range of particle volume fraction  $\phi$.
3.1. Liquid viscosity
For the suspension of spherical particles, three different regimes are generally defined (Mueller et al. Reference Mueller, Llewellin and Mader2010). In the dilute regime where  $\phi \le 0.02$, the fluid viscosity varies little and the viscosity ratio
 ${\eta _r}$ of the colloid and base fluid is described with the linear equation
 \begin{equation} {\eta_r}(\phi ) = 1 + B\phi, \phi \le 0.02,\end{equation}
where  $B = 2.5$ is the Einstein coefficient. In the semi-dilute regime where
 $\phi \le 0.25$, a second-order term is added to (3.1) as (Manley & Mason Reference Manley and Mason1955)
 \begin{equation} {\eta_r}(\phi ) = 1 + B\phi + {B_1}{\phi ^2},\phi \le 0.25,\end{equation}
and  $7.35 \le {B_1} \le 14.1$ is derived from particle–particle interactions. For a higher nanoparticle concentration, thus in the dense regime, the following empirical equation is proposed (Krieger & Dougherty Reference Krieger and Dougherty1959; Pabst et al. Reference Pabst, Gregorová and Berthold2006):
 \begin{equation} {\eta_r}(\phi ) = {\left(1 - \frac{\phi }{{{\phi _m}}}\right)^{ - B{\phi_m}}}.\end{equation}
Here  ${\phi _m}$ is the maximum packing concentration. For specifically ordered packing,
 ${\phi _m}$ can reach around 0.74, while for randomly monodisperse spheres,
 ${\phi _m} \approx 0.64$ is obtained from modelling (Rintoul & Torquato Reference Rintoul and Torquato1996). Figure S4 of the supplementary material compares (3.1)–(3.3), where we observe that the empirical equation works well in all three regimes. Therefore, (3.3) is applied in the current study to address nanoparticle effects on colloid viscosity. Assuming spherical particles and by the proper estimation of
 ${\phi _m}$, (3.3) has shown good agreement with the experimental results for particle diameters ranging from
 $2$ nm to
 $100\,\textrm {m}$, with the particle material from butadiene styrene to glass and metals, etc. (Krieger & Dougherty Reference Krieger and Dougherty1959; Mueller et al. Reference Mueller, Llewellin and Mader2010; Lin et al. Reference Lin, Majji, Cho, Zeeman, Swan and Richards2022). In our simulations
 ${\phi _m} = 0.64$ is used unless specified. When the concentration
 $\phi$ approaches
 ${\phi _m}$, the viscosity ratio
 ${\eta _r}$ can be infinite, which is beyond the simulation capability. To balance the simulated viscosity ratio range and model stability, the maximum viscosity ratio is set to
 ${\eta _{r,max}} = 104$ at
 $\phi = 0.605$. Using a higher maximum viscosity ratio of
 ${\eta _{r,max}} = 134$ is found to have negligible influence, as shown in figure S5 of the supplementary material with the 1-D evaporation of a colloidal suspension. The modified viscosity ratio as a function of nanoparticle concentration, as used in this study, is given in figure 2. We note that the shear thinning (Konijn, Sanderink & Kruyt Reference Konijn, Sanderink and Kruyt2014) and thickening (Wolf et al. Reference Wolf, Lam, Kirkland and Frith2007) effects are neglected, since the diffusive evaporation that we modelled is quasi-static under isothermal conditions, experiencing very low shear stresses.
Modified viscosity ratio based on (3.3) with maximum value of  ${\eta _{r,max}} = 104$ after
 $\phi \ge 0.605$.

3.2. Surface tension
It is well known that the surface tension can significantly change in the presence of nanoparticles. Specifically, surface tension may decrease with an increased amount of nanoparticles (Binks & Lumsdon Reference Binks and Lumsdon2000; Du et al. Reference Du, Glogowski, Emrick, Russell and Dinsmore2010; Fan & Striolo Reference Fan and Striolo2012). The interaction between nanoparticles may affect the surface tension to different degrees, depending on various particle properties (Yong et al. Reference Yong, Qin and Singler2016; Harikrishnan et al. Reference Harikrishnan, Dhar, Agnihotri, Gedupudi and Das2017). As a first attempt, we consider spherical nanoparticles and neglect nanoparticle interaction and gravity. Following Fan & Striolo (Reference Fan and Striolo2012), the surface tension of a colloidal suspension  ${\gamma _s}$ is given as
 \begin{equation} {\gamma_s} = {\gamma_l} - {E_d}{N_{p,if}}/{A_{if}},\end{equation}
where  ${E_d} = {\gamma _l}{\rm \pi} d_p^2{(1 - \cos {\theta _p})^2}/4$ (Binks & Lumsdon Reference Binks and Lumsdon2000) is the desorption energy required to remove the nanoparticles from the interface to the liquid phase,
 ${d_p}$ and
 ${\theta _p}$ are the nanoparticle diameter and contact angle, respectively. Here
 ${N_{p,if}}$ is the number of nanoparticles at the interface and
 ${A_{if}}$ is the interfacial area.
In the current Eulerian simulations nanoparticles are not explicitly modelled, thus it is impossible to calculate  ${\gamma _s}$ directly. We use an alternative method as follows. We note that, in our simulations, the fluid flow is assumed two dimensional with all variables identical along the third direction. Nevertheless, the nanoparticles are considered to be three dimensional, since physically they are spherical particles of nanosize instead of circular cylinders with infinite height. To couple the 2-D fluid flow and the 3-D nanoparticle effects, we simply assume cubic lattices with identical lattice length
 $\delta _x$ in the third direction. The nanoparticle volume in one computational lattice is
 $\phi \delta _x^3 = {N_p}({{\rm \pi} }/{6})d_p^3$, where
 ${N_p}$ is the number of particles in one lattice volume. The total interfacial area in one lattice is
 ${A_{if}} = \delta _x^2$. Assuming that the nanoparticles in one lattice are evenly distributed, the nanoparticle number at the interface equals
 ${N_{p,if}} = {({N_p})^{2/3}}$. Combining the above equations with (3.4), the ratio of the surface tension between the colloidal suspension and base liquid is expressed as
 \begin{equation} {\gamma_r} = \frac{{{\gamma_s}}}{{{\gamma_l}}} = 1 - \frac{1}{4}{{\rm \pi} ^{1/3}}{(6\phi )^{2/3}}{(1 - \cos {\theta_p})^2}. \end{equation}
Using (3.5), we can easily calculate the surface tension of a colloidal suspension knowing the local nanoparticle volume concentration and the nanoparticle contact angle. We note that in (3.5), we account only for the nanoparticle volume fraction at the liquid–vapour interface because only these nanoparticles affect the local surface tension. To further avoid any misunderstanding, we use the term nanoparticle interfacial fraction  ${\phi _{if}}$ at the liquid–vapour interface. Assuming that
 ${N_{p,if}}$ is the number of spherical nanoparticles with diameter
 ${d_p}$ and contact angle
 ${\theta _p}$ suspended on a locally flat liquid–vapour interface, the nanoparticle interfacial fraction is calculated as
 \begin{equation} {\phi_{if}} = \frac{{{N_{p,if}}{\rm \pi} d_p^2{{\sin }^2}{\theta_p}}}{{4{A_{if}}}} = \frac{1}{4}{{\rm \pi} ^{1/3}}{(6\phi )^{2/3}}{\sin ^2}{\theta_p}.\end{equation}
Combining (3.5) and (3.6), we obtain the surface tension ratio in a Eulerian model as
 \begin{equation} {\gamma_r} = \frac{{{\gamma_s}}}{{{\gamma_l}}} = 1 - {\left( {\frac{{1 - \cos {\theta_p}}}{{\sin {\theta_p}}}} \right)^2}{\phi_{if}}.\end{equation}
In order to take into account the influence of nanoparticles on surface tension, we define the coefficient  $\kappa$ in (2.9) as
 $\kappa = {( {(1 - \cos {\theta _p})/\sin {\theta _p}} )^2}{\phi _{if}}$ when
 ${\theta _p} \in (0,{\rm \pi} )$. The corresponding surface tension ratio, from (3.7), can be implemented according to (2.10). In our work the liquid–vapour interface is diffusive covering 5-6 lattices; thus, we need to determine on which lattice width
 $\kappa = {( {(1 - \cos {\theta _p})/\sin {\theta _p}} )^2}{\phi _{if}}$ should be implemented in order to ensure computational accuracy as well as efficiency. For this purpose, a single suspended droplet is tested, with widths equal to 5, 10 and 15 lattices starting from the half-liquid-density location. The nanoparticle contact angle
 ${\theta _p} = 90^\circ$ is used with fixed nanoparticle volume fraction
 $\phi = 0.266$, leading to
 $\kappa = 0.5$. Results in figure S6 and table S1 of the supplementary material show that the pressure and surface tension have negligible influence and the calculated
 ${\gamma _r} = {\gamma _s}/{\gamma _l} = 0.495 \approx 1 - \kappa$, indicating that 5 lattices are sufficient for an accurate simulation. We calculate the surface tension ratio
 ${\gamma _r}$ for different nanoparticle volume fractions. Results in figure 3 show that the simulation results agree well with the analytical equations. We note that the plots are given at the nanoparticle contact angle of
 ${\theta _p} = 90^\circ$. Smaller
 ${\theta _p}$ will lead to lower surface tension reduction.
Influence of nanoparticles on surface tension for different (a) volume fractions and(b) corresponding interfacial fractions, for a nanoparticle contact angle equal to  ${\theta _p} = 90^\circ$. The squares are LBM results while the solid lines are theoretical predictions.

3.3. Drying rate
When nanoparticles reside at the liquid–vapour interface, they occupy the interfacial area and subsequently may block local evaporation. Theoretical (Wei et al. Reference Wei, Deng and Chen2016), numerical (Yong et al. Reference Yong, Qin and Singler2016) and experimental (Gan & Qiao Reference Gan and Qiao2011) investigations have shown that nanoparticles indeed reduce the evaporation rate. The local evaporation rate ratio  $\beta$ is defined as
 \begin{equation} \beta = E{p_s}/E{p_l},\end{equation}
where  $E{p_s}$ and
 $E{p_l}$ are the drying rate of a colloidal suspension and base liquid, respectively. The evaporation rate is defined as the mass loss per unit time, for instance,
 $E{p_s} = [{m_s}({t_1}) - {m_s}({t_2})]/({t_1} - {t_2})$, where
 ${m_s}({t_1})$ and
 ${m_s}({t_2})$ are the mass of the colloidal suspension at time
 ${t_1}$ and
 ${t_2}$, respectively. Theoretically,
 $\beta$ is equal to the ratio of effective and initial interfacial areas (Wei et al. Reference Wei, Deng and Chen2016), i.e.
 \begin{equation} \beta \approx ({A_{if}} - {A_{p,if}})/{A_{if}} = 1 - {\phi_{if}},\end{equation}
where  ${\phi _{if}} = {A_{p,if}}/{A_{if}}$ is the nanoparticle interfacial fraction as defined in (3.6) and
 ${A_{p,if}}$ is the interfacial area occupied by suspended nanoparticles.
Combing (3.9) and (3.6), we can calculate the local effective evaporation rate of a colloidal suspension compared with the base liquid. In our simulations the quasi-static isothermal evaporation is modelled by LBM, which is equivalent to solving the NS equation. The evaporation is triggered by the difference in the vapour pressure between the liquid–vapour interface (at saturation) and the outlet boundary (set at a lower value) (Zhao & Yong Reference Zhao and Yong2017; Qin et al. Reference Qin, Zhao, Kang, Derome and Carmeliet2021b). The evaporation rate, i.e. the vapour flow rate, is influenced by the viscous force. Innovatively, we model the blocking effect of nanoparticles on the local evaporation rate of a colloidal suspension by increasing the vapour flow resistance, i.e. the viscous force above the liquid–vapour interface in the vapour phase. To quantify this effect, a 1-D drying case with a single liquid–vapour interface is simulated (see figure S7a of the supplementary material). We record the drying rate by varying the outlet vapour pressure  ${p_o}$ and the vapour viscosity ratio
 ${\eta _v}/{\eta _{v,0}}$, with
 ${\eta _{v,0}}$ indicating a reference constant viscosity. The drying rate
 $Ep$ is shown decreasing nonlinearly with increasing
 ${p_o}$ or
 ${\eta _v}/{\eta _{v,0}}$ (see figure S7b of the supplementary material). To quantify the influence of
 ${\eta _v}/{\eta _{v,0}}$ on
 $Ep$ considering different drying conditions (i.e.
 ${p_o}$), we normalize the
 $Ep$ with the
 $Ep$ at
 ${\eta _{v,0}}$, i.e.
 $E{p_n} = Ep({\eta _v})/Ep({\eta _{v,0}})$ under the same
 ${p_o}$ as shown in figure 4(a). We observe that the normalized drying rate
 $E{p_n}$ at different
 ${p_o}$ does not vary a lot; thus, we use an average curve to represent all the results. A relation between the average
 $E{p_n}$ and
 $\ln ({\eta _v}/{\eta _{v,0}}) = h(E{p_n})$ is fitted in figure 4(b) using a fourth-order polynomial
 $h(x)$ showing excellent agreement. Thus, the relation between
 ${\eta _v}/{\eta _{v,0}}$ and
 $E{p_n}$ is approximated as
 \begin{equation} {\eta_v}/{\eta_{v,0}} = \exp (h(E{p_n})).\end{equation}
(a) Normalized evaporation rate  $E{p_n} = Ep({\eta _v})/Ep({\eta _{v,0}})$ at different outlet vapour pressure
 ${p_o}$ and vapour viscosity ratio
 ${\eta _v}/{\eta _{v,0}}$. The line plot shows the average value. (b) Fourth-order polynomial fitting
 $h(x)$ between
 $E{p_n}$ and
 $\ln ({\eta _v}/{\eta _{v,0}})$. (c) Simulated evaporation rate ratio
 $\beta = E{p_s}/E{p_l}$ against the nanoparticle interfacial fraction
 ${\phi _{if}}$. Here
 $E{p_s}$ and
 $E{p_l}$ are the evaporation rate of colloidal suspension and base liquid, respectively.

In order to consider the decrease of the drying rate of a colloidal suspension due to the presence of nanoparticles, the evaporation ratio  $\beta = E{p_s}/E{p_l} \approx 1 - {\phi _{if}}$ is assumed to equal the normalized drying rate
 $E{p_n}$, i.e.
 $E{p_n} \approx 1 - {\phi _{if}}$. In our simulations we use
 \begin{equation} {\eta_v}/{\eta_{v,0}} = \exp (h(1 - {k_c}{\phi_{if}}))\end{equation}
to prescribe the vapour viscosity ratio  ${\eta _v}/{\eta _{v,0}}$, aiming to obtain the desired evaporation ratio
 $\beta$. A correction coefficient
 ${k_c} = 1.1$ is introduced to balance the influence of a small variation in fluid density due to the change in surface tension, as described in § 3.2. By incorporating (3.11) in our simulations, the modelled evaporation rate ratio
 $\beta = E{p_s}/E{p_l}$ agrees very well with the analytical expression of (3.9), as shown in figure 4(c).
We recall that the viscosity ratio in (3.11) is intended to model the blocking effect of liquid evaporation induced by a nanoparticle. Thus, we need to determine the distance from the liquid–vapour interface, considered to be at the half-liquid-density location, to the vapour phase, a distance upon which (3.11) requires to be implemented, in order to ensure the accurate modelling of the blocking effect. We have tested different distances  $d$, and the results of
 $d = 5,10,17$ lattices are identical, indicating the minimum distance of
 $d = 5$ lattices to be sufficient for accurate simulations. This distance is also compatible with the requirement of surface tension in § 3.2.
In §§ 3.1–3.3 we modelled the local nanoparticle effects on colloidal liquid viscosity increase, surface tension drop and evaporation rate reduction, by assuming spherical nanoparticles and neglecting particle–particle interaction and particle gravity. Since the nanoparticle amount, diameter and contact angle are all considered, this model is capable of dealing with nanoparticles of various materials.
4. Numerical validations
This section has two subsections. In the first subsection (4.1) we model the drying of a colloidal droplet suspended in vapour, and compare it with experimental results to validate the model. Afterwards in § 4.2, drying of a colloidal suspension in a single tube with two open ends is modelled with consideration of contact angle hysteresis, to further validate the model.
4.1. Drying of a suspended colloidal droplet
It is well known that, under isothermal conditions in an open environment, drying of a liquid droplet generally follows the diameter square ( $D^2$) law, i.e. the droplet diameter squared decreases linearly with time. Considering drying of a colloidal droplet, Wei et al. (Reference Wei, Deng and Chen2016) analysed the drying dynamics theoretically and found the diameter square may deviate from the
 $D^2$ law, which is influenced by the nanoparticle Péclet number, Pe. They define
 $Pe = K/(8{D_p})$, where
 $K$ is the slope of the
 $D^2$ law for liquid droplet drying and
 ${D_p}$ the nanoparticle diffusion coefficient. For low Pe, diffusion is more dominant and a packed sphere is formed, while high Pe indicates strong convection leading to hollow spheres. Their analytical results generally agree well with experimental results (Derkachov et al. Reference Derkachov, Kolwas, Jakubczyk, Zientara and Kolwas2008; Gan & Qiao Reference Gan and Qiao2011).
To validate our model, we simulate the drying of a colloidal droplet under two different Pe, i.e.  $Pe = 68$ and
 $Pe = 3.2$, and compare the simulations with experimental results. For the case of
 $Pe = 68$, a colloidal droplet of diameter
 ${D_0} = 100$ lattices with initial concentration
 ${\phi _0} = 2.5\,\%$ is simulated, following the experiment by Gan & Qiao (Reference Gan and Qiao2011). Isothermal evaporation is induced by a low pressure at the boundaries of the computational domain of
 $240 \times 240$ lattices
 $^2$. Following the theoretical work by Wei et al. (Reference Wei, Deng and Chen2016), the nanoparticle contact angle of
 ${\theta _p} = 40^\circ$ is used in the simulation to allow comparison with experimental results. The drying process is shown in the insert of figure 5(a), where
 ${t^*} = t/{t_{t,p}}$ is the normalized drying time with
 $t_{t,p}$ representing the total drying time of a pure droplet. We observed that the nanoparticles accumulate mainly at the liquid–vapour interface forming a shell structure. To analyse the nanoparticle accumulation, we define
 $(X - {X_0})/R$ as the distance from
 $X$ to the droplet centre
 ${X_0}$ normalized by the droplet initial radius
 $R$. The concentration profile after
 ${t^*} = 0.29$ in figure 5(a) shows a steep increase in concentration from vapour to liquid at the interface followed by a sharp decrease towards the droplet centre. To compare the drying process with the experiment, we plot the square of diameter against time. The droplet diameter is normalized by the initial diameter
 ${D_0}$ while the drying time is normalized by
 ${t^*}$. From figure 5(b) we observe that the slope for a pure liquid droplet is approximately constant, while it decreases gradually for colloidal droplets. The simulation result generally agrees well with the experiment by Gan & Qiao (Reference Gan and Qiao2011). The evaporation rate ratio
 $\beta = 1 - {\phi _{if}}$, defined above as the ratio between the liquid–vapour interfacial areas with and without nanoparticles, decreases with time due to the accumulation of nanoparticles at the liquid–vapour interface. At the final stages of evaporation, the normalized evaporation area remains constant because the maximum volume concentration
 ${\phi _m}$ is reached, and so is the maximum interface concentration
 ${\phi _{if,m}}$. The evolution of the nanoparticle interfacial fraction
 ${\phi _{if}}$ and resultant surface tension ratio
 ${\gamma _r}$ is shown in figure S8a of the supplementary material, where approximately linear curves are observed. The surface tension decreases slightly to a final value of 92.5 % since the nanoparticle contact angle is small (
 ${\theta _p} = 40^\circ$).
Drying of a colloidal droplet at  $Pe = 68$ with initial volume concentration
 ${\phi _0} = 2.5\,\%$ and nanoparticle contact angle
 ${\theta _p} = 40^\circ$. (a) Droplet and nanoparticle volume fraction profiles at four different time frames during the drying process. (b) Comparison of normalized diameter squared between the experimental and simulation results of a colloidal droplet (Gan & Qiao Reference Gan and Qiao2011) and pure droplet versus normalized time. Here
 $\beta = 1 - {\phi _{if}}$ represents the evaporation rate ratio between the colloidal and pure droplet.

For the case with  $Pe = 3.2$, we use a higher resolution with droplet diameter
 ${D_0} = 240$ lattices in a computational domain of
 $360 \times 360$ lattices
 $^2$, since the finally formed solid circle is rather small with initial concentration
 ${\phi _0} = 0.1\,\%$. Following the experiment by Derkachov et al. (Reference Derkachov, Kolwas, Jakubczyk, Zientara and Kolwas2008), the nanoparticle contact angle is set to
 ${\theta _p} = 73^\circ$, as measured by Paunov (Reference Paunov2003) and suggested by Wei et al. (Reference Wei, Deng and Chen2016). The drying process is shown in figure 6(a), where we observe that the nanoparticles have little effect on the drying process except for the final stage when a compact sphere is formed. The nanoparticle concentration in the droplet does not vary much due to the small Pe, as indicated by the line plots. Figure 6(b) shows that the modelled diameter squared evolution of a colloidal droplet is very close to that of a pure droplet, and agrees well with the experiment by Derkachov et al. (Reference Derkachov, Kolwas, Jakubczyk, Zientara and Kolwas2008). On the other hand, the evaporation ratio
 $\beta$ initially decreases more slowly compared with
 $Pe = 68$. However, in the final stage, as the concentration suddenly increases to a very high value (figure 6(a) around
 ${t^*} = 1.09$), the evaporation is seriously impacted. The increase of nanoparticle interfacial fraction
 ${\phi _{if}}$ and the decrease of surface tension ratio
 ${\gamma _r}$, shown in figure S8b of the supplementary material, are very gradual at first and vary dramatically in the end. The final surface tension drops to 56 %, due to the large nanoparticle contact angle of
 ${\theta _p} = 73^\circ$.
Drying of a colloidal droplet at  $Pe = 3.2$ with initial volume concentration
 ${\phi _0} = 0.1\,\%$ and nanoparticle contact angle
 ${\theta _p} = 73^\circ$. (a) Droplet and nanoparticle volume fraction profiles at four different time frames during the drying process. (b) Comparison of normalized diameter squared between the experimental and simulation results of a colloidal droplet (Derkachov et al. Reference Derkachov, Kolwas, Jakubczyk, Zientara and Kolwas2008) and pure droplet versus normalized time. Here
 $\beta = 1 - {\phi _{if}}$ represents the evaporation rate ratio between a colloidal and pure droplet.

4.2. Drying of a colloid in a capillary tube with two open ends
In this subsection we study the drying of a colloid in a capillary tube with two open ends, to further validate the model and investigate the local nanoparticle effect on the drying dynamics. Wang et al. (Reference Wang, Zhou, Sun, Xu, Ouyang and Wang2020) conducted an experiment to investigate the drying process and the deposition of an initially ordered colloidal suspension with an initial concentration of 11 %. The capillary tube is chemically treated to achieve a contact angle of around  $90^\circ$. During the drying process, they observed that the colloid remains pinned at one end of the tube, although both ends are open. They explained this is due to the presence of thermal fluctuation that causes the evaporation at one end of the tube to be much faster than at the other (Wang et al. Reference Wang, Zhou, Sun, Xu, Ouyang and Wang2020). This stronger evaporation at one end leads to the accumulation of particles near this pinned interface, which consists of nanosize menisci between nanoparticles. Subsequently, a capillary flow is induced that drives the nanoparticles preferably towards the pinned interface causing a unidirectional liquid flow and nanoparticle transport. Once reaching the maximum concentration of
 ${\phi _m} = 0.73$ (Wang et al. Reference Wang, Zhou, Sun, Xu, Ouyang and Wang2020), the nanoparticles are closely packed, forming the close packed region. Other regions observed are the concentrated, initial concentration and dilute regions, as shown in figure 7(a) (Wang et al. Reference Wang, Zhou, Sun, Xu, Ouyang and Wang2020).
Drying of a colloidal suspension in a capillary tube with two open ends. (a) Illustration of the evaporation process resulting in four nanoparticle regions (Wang et al. Reference Wang, Zhou, Sun, Xu, Ouyang and Wang2020). (b–e) Comparison of nanoparticle concentration profiles at different times between experiment (Wang et al. Reference Wang, Zhou, Sun, Xu, Ouyang and Wang2020) and simulation considering different nanoparticle effects. Here  ${\eta _s}$,
 ${\gamma _s}$ and
 $\beta$ represent the influence on suspension viscosity, suspension surface tension and local drying rate ratio, respectively. The result of (e) considering
 ${\eta _s} + {\gamma _s} + \beta$ is shown in movie 01.

The physical mechanism of capillary transport explained above is based on the nanosize meniscus between nanoparticles, which is difficult to simulate in our model because the nanoparticles are only implicitly modelled as a volume fraction. To physically analogize this capillary flow and realize the pinning of the interface at one open end (left end in this work), we apply contact angle hysteresis at this end. The contact angle range set at the left end is  $\theta \in [{\theta _R},{\theta _A}] = [30^\circ,95^\circ ]$, while at the right end a constant contact angle
 $\theta = 90^\circ$ is given. The small receding contact angle of
 ${\theta _R} = 30^\circ$ is set to induce sufficient capillary flow to ensure the pinning of the left liquid–vapour interface. The nanoparticle contact angle is set to
 ${\theta _p} = 45^\circ$. The tube is 720 lattices long with 700 lattices in the central region initially filled with a colloidal suspension to match the experiment (70 mm), and 10 lattices at both ends to apply a pressure boundary condition for evaporation. The mechanism is explained as follows. Initially, both sides are set at a contact angle of
 ${\theta _0} = 90^\circ$. Since the contact angle is fixed at the right-hand side, the meniscus recedes due to drying. Meanwhile, although the contact angle decreases at the left-hand side due to drying, the meniscus stays pinned, caused by the capillary flow from the right end induced by a contact angle difference. The capillary flow also transports nanoparticles from the right to left end.
We simulate the drying process and deposition with and without considering local nanoparticle effects with four cases. In case 1 we do not consider any local nanoparticle effects (no effect). In case 2 we consider the effect on liquid viscosity  ${\eta _s}$. Consequently, the nanoparticle diffusion coefficient
 ${D_p}$ is considered, since it is inversely proportional to
 ${\eta _s}$ according to Einstein's equation. We set a minimum value of
 ${D_{p,min}} =0.01$ to ensure the stability of the simulations, and verified that accuracy is maintained (see figure S9 of the supplementary material). In case 3 we consider the nanoparticle effect on
 ${\eta _s}$ and surface tension
 ${\gamma _s} ({\eta _s} + {\gamma _s} )$. In case 4 we consider the nanoparticle effect on all three effects, i.e.
 ${\eta _s},{\gamma _s}$ and local drying rate ratio
 $\beta ({\eta _s} + {\gamma _s} + \beta )$. In all four cases, a Péclet number
 $Pe \sim 25$ is assured. The nanoparticle concentration profiles during the drying process for the four cases are shown in figure 7(b–e). For case 1, the nanoparticle volume fraction at the left end is significantly underestimated before
 $t=17$ h, due to the omission that
 ${D_p}$ should decrease with higher liquid viscosity. Moreover, a discrepancy of the interface location at the right end is observed. The simulated interfaces are located to the right of the experimental ones before
 $t=32$ h, indicating the modelled drying rate at the right end of the tube is generally smaller than that of the experiment. For case 2, the nanoparticle volume fraction at the left end is much better predicted, since the nanoparticle effects on the suspension viscosity increase and the resultant nanoparticle diffusion coefficient decrease are considered. However, the interface at the right end recedes faster than that in the experiment. When considering the nanoparticle effect on surface tension in case 3, the surface tension decreases by about 10 % and 4 % at the left and right interfaces, respectively. The remaining surface tension is still high enough to maintain adequate capillary flow and keep the left interface pinned. Thus, the result of case 3 is almost identical to that of case 2. In case 4, when we further consider the nanoparticle effect on local drying rate, both the interface locations and nanoparticle profiles are observed to agree well with the experiment. To quantify the accuracy of the four cases, we calculate the average relative error (
 $Err$) of the right liquid–vapour interface location during the drying process, by comparing with the experimental result. Here
 $Err$ is calculated as
 $Err = ({1}/{n})\sum _{i = 1}^n {[1 - {X_{R,LBM}}(i)/{X_{R,EXP}}(i)]}$, where
 ${X_{R}}$ is the right liquid–vapour interface location,
 $n=7$ is the number of interface locations recorded in the experiment. The obtained
 $Err$ for the four cases is
 $-$8.8 %, 8.1 %, 8.3 %, 3.7 %, respectively, showing that the result considering all three nanoparticle effects is the most accurate. From the comparison we understand that, for similar Pe, the effect on liquid viscosity
 ${\eta _s}$ and, thus, nanoparticle diffusion coefficient
 ${D_p}$ is important to obtain more accurate nanoparticle concentration profiles, such as the maximum concentration. The effect on surface tension
 $\gamma _s$ is less important as long as it is high enough to support capillary transport. The effect on local drying rate ratio
 $\beta$ is necessary to achieve a better ‘time comparison’ during the drying process.
To further investigate the local nanoparticle effect on the drying dynamics, we compare the drying rate at both ends for the four cases, as shown in figure 8(a). The drying rate at the left end is much higher than at the right end, since the left liquid–vapour interface is pinned due to contact angle hysteresis, while the right interface recedes continually at a constant contact angle. Being closer to the exterior of the tube, the pressure gradient is higher at the left end, resulting in faster evaporation. The drying rate at the right end decreases quite similarly since the interface recedes similarly from the open end to deeper inside. The drying rate at the left end is different. In case 1 (no effect) the drying rate increases with time, which is due to a stronger capillary transport with time, making the contact angle at the left-hand interface increase slightly with time. The higher contact angle at the interface leads to a higher local liquid pressure, which, according to the non-ideal EoS in (2.7), favours phase transition from liquid to vapour, i.e. evaporation. However, this high evaporation rate increase might not be physical. By considering the nanoparticle effect on liquid viscosity in cases 2 and 3, the decrease of drying rate with time is more correctly modelled, since the increased liquid viscosity weakens the capillary transport. Comparing case 4 with cases 2 and 3, we observe a sharp decrease of drying rate before  $t_N=0.1$, due to the nanoparticle accumulation at the left end. The drying rate remains almost constant afterwards because the maximum concentration at the interface is reached. Figure 8(b) shows that the mass loss versus time is approximately linear for the case with no effect, which in also not physical. For the other cases, concave drying curves are observed. Despite the differences in drying process, the total evaporated liquid at the left or right ends are almost the same in all cases (see figure S10 of the supplementary material), since the dominant mechanism of capillary transport is correctly captured when similar Pe is assured.
Comparison of (a) normalized evaporation rate  $Ep_N$ and (b) colloidal suspension mass
 $m_N$ at different times during the drying process for different cases corresponding to figure 7.

To briefly conclude, the most accurate results are obtained when all the local nanoparticle effects are considered. Specifically in this case of a single capillary tube, the effects on liquid viscosity  ${\mu _l}$ with its side effect on nanoparticle diffusion coefficient
 ${D_p}$ and local drying rate
 $\beta$ are important, since the capillary flow is strong enough with/without considering the surface tension effect
 $\gamma _s$.
5. Drying of a porous medium
In the above two sections we have validated the accuracy of the proposed model. It is shown that the consideration of all three nanoparticle effects results in the most accurate results compared with the experimental results. In this section we study drying of porous media considering all local nanoparticle effects and investigate the influence of four parameters on drying dynamics and deposition configuration, which are nanoparticle volume fraction, surface wettability, diffusion coefficient and nanoparticle contact angle. The results are discussed one by one and summarized, and a universal relation between the average drying rate and the variables is proposed and verified at the end.
Before the parametric study, we first investigate the drying dynamics of the base case. The 2-D porous medium is a slice of porous asphalt (Son Reference Son2016), as shown in figure 9(a). The porosity is around 51.2 % with pores varying in shape and size. We select this configuration because drying of materials like soil, porous asphalt and bricks is very important in geophysics and building engineering. The narrow throats in this type of porous media can be clogged by particles and blocked, and, thus, the undergoing fluid dynamics and phase change can be seriously influenced. Initially, the pores are filled with a colloidal suspension, as shown in blue in figure 9(a). The left and right sides are periodic, while the bottom is a flat wall. The evaporation is induced at the top boundary with a vapour pressure fixed lower than the saturation pressure. The nanoparticle volume fraction is  ${\phi _0} = 5.0\,\%$, with the nanoparticle contact angle
 ${\theta _p} = 45^\circ$ and porous medium surface wettability
 $\theta = 30^\circ$. Figure 9(b–f) illustrates the colloidal liquid configuration and corresponding depositions during the drying process. Figure 9(c) shows that the liquid–vapour interface recedes non-uniformly from top to bottom, where large pores are invaded first, followed with small ones afterwards. The nanoparticle volume fraction increases around the vicinity of the liquid–vapour interface, due to the accumulation of nanoparticles caused by interface receding. With drying going on, the colloidal suspension forms isolated clusters and nanoparticles deposit when their volume fraction reaches the maximum value of 64 %; thus, deposited structures have a 36 % porosity. Examples of such depositions are given in figure 9(c) at locations A and B. There may still remain liquid within the deposition (white profiles at location A) or vapour that can still be transported through it (location B). The streamlines in liquid phase in figure 9(c) show the flows from large menisci to small ones, which is due to capillary pumping. In figure 9(d) the main remaining liquid is located at the top-left and central-bottom regions: the former is due to large nanoparticle depositions blocking the drying through the narrow pores and the latter is due to being far away from the top drying boundary. Towards the end of the simulation, the remaining liquid is situated at the central-bottom region, as shown in figure 9(e,f). The final deposition configuration is shown in figure 11(b). The quantification of drying and deposition is described in § 5.1 below.
Drying of a colloidal suspension in a porous medium with a porosity of 51.2 % and surface contact angle  $\theta = 30^\circ$ (movie 02). (a) The porous medium is initially filled with a colloidal suspension with nanoparticle volume fraction
 ${\phi _0} = 5.0\,\%$, nanoparticle contact angle
 ${\theta _p} = 45^\circ$ and diffusion coefficient
 ${D_p} = 0.03$. (b)–(f) Drying processes at different times with contours showing nanoparticle volume fraction (or deposition in red) and streamlines showing liquid capillary flow and vapour transport. Note that red areas may include white curves, such as shown at locations A, C and D in panels (c) and (e), to indicate the liquid–vapour or liquid–solid interfaces within the deposited porous structure.

5.1. Varied nanoparticle volume fraction
In this subsection we study the influence of initial nanoparticle volume fraction,  ${\phi _0}$, ranging from 0 % (pure liquid) to 10 % with an interval of 2.5 %. All other parameters are the same as the above case shown in figure 9. We first investigate the drying dynamics and corresponding nanoparticle transport, accumulation and deposition. Two representative cases with
 ${\phi _0} = 2.5\,\%$ and
 ${\phi _0} = 10.0\,\%$ are shown in figure 10. The drying process is similar initially, i.e. large pores at the right side and top-middle parts are invaded first, as seen in figure 10(a,d). Afterwards in panels (b,e), drying continues in the top-middle part. In the last stage, with
 ${\phi _0} =2.5\,\%$, the main liquid remains in the central-bottom part and a small amount persists at the top left due to the very small evaporation rate where deposition occurs (white curves at location A for instance). For the case with
 ${\phi _0} = 10.0\,\%$, there is a lot more deposition at the left part in the narrow pores (locations B and C), making more liquid remain there. The liquid remaining in the centre-bottom part is similar in the two cases, but with much higher nanoparticle volume fraction for the case with
 ${\phi _0} =10.0\,\%$.
Drying and nanoparticle deposition process for two cases with a different initial nanoparticle volume fraction of (a–c)  ${\phi _0} = 2.5\,\%$ (movie 03) and (d–f)
 ${\phi _0} = 10.0\,\%$ (movie 04). The colour bar is the same as in figure 9.

Figures 11(a)–11(d) shows the final deposition configurations for these four different initial nanoparticle volume fractions. It is observed that, when the volume fraction is small (figure 11a), the depositions are confined to long-narrow pores. Some depositions are formed as ‘thin bridges’ (locations A and B) connecting the solids, due to a dearth of nanoparticles. With increasing initial nanoparticle volume fraction (figure 11b,c), larger pores (locations C and D) also become filled. When the initial volume fraction is high enough (10 % in figure 11d), the deposition may occupy a large amount of volume connecting several pores (location E) regardless of pore size and shape.
Final nanoparticle deposition configurations after drying for different nanoparticle volume fractions ranging from (a)  ${\phi _0} = 2.5\,\%$, (b)
 ${\phi _0} = 5.0\,\%$, (c)
 ${\phi _0} = 7.5\,\%$ to (d)
 ${\phi _0} = 10.0\,\%$.

To further investigate the drying processes, we compare the normalized colloidal liquid mass  ${m_N} = m(t)/m(t = 0)$, i.e. the ratio of residual liquid mass during evaporation versus the initial mass. The normalized nanoparticle deposition volume is given as the ratio of deposited nanoparticle volume
 ${V_d}$ against solid volume of porous medium
 ${V_{pm}}$. As shown in figure 12(a), before reaching
 ${m_N} = 75\,\%$ when the liquid–vapour interface recedes into the porous medium, the liquid mass drops almost linearly at high rate. Afterwards, the slope of
 ${m_N}$ gradually decreases for all cases, indicating a diffusive mode of drying. With increasing initial nanoparticle volume fraction
 ${\phi _0}$, the liquid mass
 ${m_N}$ decreases slower with time (here displayed in terms of iterations), implying decreasing drying rate.This observation is explained by the more important blocking of drying by depositions at higher nanoparticle volume fraction. The normalized deposition volume is shown at the right vertical axis of figure 12(a). First, the volume increases stepwise, indicating nanoparticles only deposit when the entire isolated cluster reaches the maximum volume fraction
 ${\phi _m} = 64\,\%$. Second, with the increasing
 ${\phi _0}$, the deposition becomes more similar. For instance, the deposition profile of
 ${\phi _0} = 7.5\,\%$ agrees with that of
 ${\phi _0} = 5.0\,\%$ before the iteration of
 $23 \times {10^4}$, while the deposition profile of
 ${\phi _0} = 10\,\%$ agrees with that of
 ${\phi _0} = 7.5\,\%$ until the iteration of
 $48 \times {10^4}$. Furthermore, we analyse spatially the deposition. In figure 12(b),
 ${Y_N}$ is the normalized height of porous medium and
 ${\psi _Y}$ is the porosity at this height. The result for
 ${\phi _0} = 0$ is the porous medium porosity with
 ${\psi _Y}$ varying from 32 % to 93 %, with which the other cases are compared. With the increase of
 ${\phi _0}$ up to
 $7.5\,\%$, the decrease in
 ${\psi _Y}$ (or amount of deposition) becomes generally larger for
 ${Y_N} > 0.4$, which is the upper part of the porous medium. At the lower part, the decrease of
 ${\psi _Y}$ is much less significant (see figure S11 of the supplementary material). The reason is that, when
 ${\phi _0}$ is not very high, the blocking effect of the evaporation rate is not dominant and, thus, capillary transport in a colloidal liquid still transports nanoparticles to the upper part close to the outer surface. In contrast, when
 ${\phi _0}$ is large enough (10 %), the nanoparticle diffusion becomes dominant over capillary transport and the decrease in porosity
 ${\psi _Y}$ is more uniform over the entire height
 ${Y_N}$, representing a more uniform deposition. This is confirmed by the nanoparticle Péclet number decreasing from approximately
 $Pe \in [1,5]$ at
 ${\phi _0} = 2.5\,\%$ to
 $Pe \in [0.3,2]$ at
 ${\phi _0} = 10\,\%$.
Results for different initial nanoparticle volume fractions  ${\phi _0}$. (a) Normalized liquid mass
 ${m_N}$ (left vertical axis) and nanoparticle deposition
 ${V_d}/{V_{pm}}$ (right vertical axis) versus time. (b) Final porosity
 ${\psi _Y}$ for each slice along the vertical axis
 ${Y_N}$ of the porous medium.

5.2. Variation of surface wettability of porous medium
The second parameter that we study is the surface wettability of the porous medium. In the above cases, the contact angle equals  $\theta = 30^\circ$, while here we vary the contact angle from
 $\theta = 15^\circ$ to
 $\theta = 90^\circ$. The initial nanoparticle volume fraction is
 ${\phi _0} = 5.0\,\%$, and the other parameters remain the same. Figure 13 shows the comparison of the drying process for
 $\theta = 15^\circ$ and
 $\theta = 90^\circ$. Figures 13(a) and 13(d) show that the receding of the liquid–vapour interface is initially somewhat more uniform for
 $\theta = 90^\circ$ than for
 $\theta = 15^\circ$. Since capillary pumping at
 $\theta = 90^\circ$ is negligible, the liquid in narrow pores dries faster than that at high capillary pressure at
 $\theta = 15^\circ$, as indicated by differences at locations A, B and C, D in figure 13(b,d). Consequently, the liquid mainly remains in narrow pores at
 $\theta = 15^\circ$ (locations E and F in figure 13c), while it may remain in larger pores at
 $\theta = 90^\circ$ (locations G and H in figure 13f).
Drying and nanoparticle deposition process for different porous medium contact angles of (a–c)  $\theta = 15^\circ$ (movie 05) and (d–f)
 $\theta = 90^\circ$ (movie 06). The colour bar is the same as in figure 9.

The final nanoparticle depositions are shown in figure 14. With increasing contact angle  $\theta$, the capillary pressure decreases and, thus, the capillary flow transporting the nanoparticles from large to small pores becomes weaker. As explained above, the high capillary pressure at small
 $\theta$ also slows down the evaporation, leaving the liquid in narrow pores for a much longer time. As a result, the depositions tend to occur in long-narrow pores at small
 $\theta$, while they may develop in larger pores at high
 $\theta$ (as indicated in light blue ellipses in figure 14). Also, the drying tends to be more continuous from top to bottom at high
 $\theta$ and, thus, the deposition becomes more elongated in the vertical direction (light blue ellipse in figure 14d). Finally, more depositions may be formed at the bottom of the porous medium in large pores, as indicated with a green ellipse in figure 14(d) for instance.
Final nanoparticle deposition configurations after drying under different surface wettability of porous medium of (a)  $\theta = 15^\circ$, (b)
 $\theta = 30^\circ$, (c)
 $\theta = 60^\circ$, (d)
 $\theta = 90^\circ$.

In terms of quantitative analysis, the liquid mass loss curves  ${m_N}$ of figure 15(a) for different porous medium wettability are very similar, indicating the drying rates are approximately the same. The explanation is as follows. When the contact angle is smaller than
 $\theta = 75^\circ$ (high wettability), the deposition configurations look similar, as shown in figure 14(a–c), implying a similar drying process. The deposition versus time curves at the right vertical axis of figure 15(a) also confirm this observation. Therefore, the influence of nanoparticle deposition on drying rate is similar. For the contact angle of
 $\theta = 75^\circ$ and especially
 $\theta = 90^\circ$, the deposition pattern starts to show more and more differences. For instance, the number of deposition clusters decreases, due to the smaller capillary pressure that leads to fewer interface ruptures during drying. When the liquid is continuous during drying with less interface interruptions, the deposition is less likely to occur, and less deposition occurs in pores in the top half-domain (figure 14(a,d)). As per this reasoning, the drying rate is relatively higher afterwards in the bottom half-domain (after
 ${t_1}$ in figure S12 of the supplementary material) compared with the case of
 $\theta = 15^\circ$ because there are less deposition sites blocking vapour diffusion in the top half-domain in the cases of higher contact angle. However, the nanoparticle volume fraction remaining in the liquid is also generally higher, making the drying rate lower in the last period (after
 ${t_2}$ in figure S12). These two effects may balance each other to some degree, which is the reason that the overall drying rates at
 $\theta = 75^\circ$ and
 $\theta = 90^\circ$ are similar to those at smaller contact angles. Comparing the curves of nanoparticle deposition in figure 15(a), the deposition process at
 $\theta = 90^\circ$ is seen to be quite different, being more uniform with time. As done in § 5.1, we compare the porosity
 ${\psi _Y}$ along the vertical direction of the porous medium for the base case and cases with deposition. As shown in figure 15(b), we observe that the deposition is more uniform along the whole
 ${Y_N}$ at
 $\theta = 90^\circ$ (figure S13 of the supplementary material), since the drying process is more continuous with negligible capillary pumping, as explained above. The number of final isolated deposition clusters
 $N_c$ is given in figure 15(c). With increasing contact angle, the number of isolated deposition clusters remains almost the same below
 $\theta = 60^\circ$ and decreases quickly afterwards, as explained above.
Results for different surface wettability of a porous medium. (a) Normalized liquid mass  ${m_N}$ (left vertical axis) and nanoparticle deposition
 ${V_d}/{V_{pm}}$ (right vertical axis). (b) Final porosity
 ${\psi _Y}$ along the vertical axis
 ${Y_N}$ of the porous medium. (c) Number of final isolated deposition clusters.

5.3. Variation of surface wettability of nanoparticles
As we explained in § 3.3, the nanoparticles residing at the liquid–vapour interface block the local drying rate. In this subsection we study the influence of nanoparticle surface wettability on drying dynamics and resultant deposition configuration, with the nanoparticle contact angle ranging from  ${\theta _p} = 15^\circ$ (movie 07 in the supplementary material) to
 $75^\circ$ (movie 08). All other parameters are those of the case described in figure 9. The comparison in drying process between
 ${\theta _p} = 15^\circ$ and
 $75^\circ$ is shown in figure S14 of the supplementary material, where only small differences are observed. The final deposition configurations are shown in figure 16. We observe that these deposition configurations are quite similar, with only small differences as indicated in the ellipses. In figure 16(d) the locations labelled with letters A–C show liquid clusters, which did not dry out completely, due to a very low drying rate under high nanoparticle contact angle.
Final nanoparticle deposition configurations after drying under different surface wettability of nanoparticles of (a)  ${\theta _p} = 15^\circ$, (b)
 ${\theta _p} = 30^\circ$, (c)
 ${\theta _p} = 60^\circ$, (d)
 ${\theta _p} = 75^\circ$.

The loss of normalized liquid mass  ${m_N}$ and increase in normalized deposition
 ${V_d}/{V_{pm}}$ during drying are shown in figure 17(a). It is obvious that, with increasing nanoparticle contact angle
 ${\theta _p}$, drying slows down and takes more and more time to be completed, in fact, drying time increases with increasing contact angle. Correspondingly, the depositions occur later for higher
 ${\theta _p}$, also shown in figure 17(a). The decrease of porosity along the porous medium height is shown in figure 17(b). The curves for different nanoparticle contact angles almost coincide with each other, further confirming that the depositions are quite similar. The other two influences of nanoparticles, i.e. increase in viscosity and decrease in surface tension, do not show much impact on the drying process or deposition configurations. The reason lies in the fact that the drying is mostly diffusive, and the capillary flow related to the surface tension is not dominant. Without important capillary flow, the liquid flow in a porous medium is very slow and, thus, a local increase of viscosity does not affect the global drying process much.
Results for different surface wettability of nanoparticles. (a) Normalized liquid mass  ${m_N}$ (left vertical axis) and nanoparticle deposition
 ${V_d}/{V_{pm}}$ (right vertical axis) versus time. (b) Comparison of the final porosity
 ${\psi _Y}$ at each slice along the vertical axis
 ${Y_N}$ of the porous medium.

5.4. Variation of nanoparticle diffusion coefficient
The last parameter that we study is the nanoparticle diffusion coefficient, which is varied from  ${D_p} = 0.01$ to
 ${D_p} = 1.0$ covering two orders of magnitude. All other parameters are the same as for the case shown in figure 9. The comparison of drying dynamics between
 ${D_p} = 0.01$ and
 ${D_p} = 1.0$ are shown in figure 18. It is obvious that the nanoparticles accumulate at the vicinity of liquid–vapour interfaces for
 ${D_p} = 0.01$, while they are almost uniformly distributed in the liquid phase for
 ${D_p} = 1.0$. Moreover, more depositions occur in small pores at the early drying stage for
 ${D_p} = 0.01$ than
 ${D_p} = 1.0$, as observed in the right-top part (locations A–F) of the porous medium in figure 18(b,d), due to more nanoparticle accumulation before isolated clusters form. Since more nanoparticles are deposited in the early stage at small
 ${D_p}$, the number of nanoparticles left in the remaining liquid at the later stage is much lower than for the case with high
 ${D_p}$, as observed at locations G and H in figure 18(c,f).
Drying and nanoparticle deposition process for two cases with different nanoparticle diffusion coefficients, (a–c)  ${D_p} = 0.01$ (movie 09) and (d–f)
 ${D_p} = 1.0$ (movie 10). The colour bar is the same as in figure 9.

The final depositions are compared in figure 19. The depositions are quite similar for  ${D_p} = 0.01$ and
 ${D_p} = 0.06$, when the overall Péclet number is calculated to be larger than unity. Under these circumstances, advection due to receding of the liquid–vapour interface and capillary transport from large to small pores still play a role. As observed in the previous paragraph, more depositions may form at the top part at a smaller diffusion coefficient (light blue ellipses in figure 19). Oppositely, for the higher diffusion coefficients
 ${D_p} =0.3$ and 1.0, we see more deposition at the bottom in the last drying stage (green ellipses in figure 19). Overall, at high diffusion coefficient, the deposition is more uniform along the vertical direction leading to larger deposition clusters.
Final nanoparticle deposition configurations after drying for different nanoparticle diffusion coefficients, (a)  ${D_p} = 0.01$, (b)
 ${D_p} = 0.06$, (c)
 ${D_p} = 0.3$ and (d)
 ${D_p} = 1.0$.

The loss of normalized liquid mass  ${m_N}$ and increase of normalized deposition
 ${V_d}/{V_{pm}}$ during drying are shown in figure 20(a). We observe that, with increasing diffusion coefficient
 ${D_p}$, the drying becomes faster. The reason is that at low
 ${D_p}$ the nanoparticles tend to accumulate at the liquid–vapour interface, and the drying rate is highly blocked. When the
 ${D_p}$ is sufficiently high, the nanoparticles are more uniformly distributed in the liquid, and their influence on the drying rate remains unchanged during the drying process. In consequence, the drying curves converge with increasing
 ${D_p}$. The deposition curves shown in figure 20(a) indicate that more deposition occurs earlier at smaller
 ${D_p}$ while the deposition is getting more uniform with time at higher
 ${D_p}$, as we observed above. Figure 20(b) shows that, with increasing
 ${D_p}$, the deposition along the vertical direction (
 ${Y_N}$) of the porous medium decreases around the location of
 ${Y_N} \in (0.8,0.85)$ in the top part, while it increases around
 ${Y_N} \in (0.15,0.3)$ in the bottom part. It is noted that the spatial distribution reflects the deposition process with time, since the top parts generally dry out first, followed by the middle and bottom parts.
Results for different nanoparticle diffusion coefficients  ${D_p}$. (a) Normalized liquid mass
 ${m_N}$ (left vertical axis) and nanoparticle deposition
 ${V_d}/{V_{pm}}$ (right vertical axis) versus time. (b) Final porosity
 ${\psi _Y}$ at each slice along the vertical axis
 ${Y_N}$ of the porous medium.

5.5. Summary of the parametric study
In the above work we studied the drying of a colloidal suspension in a porous medium and the resultant nanoparticle deposition considering three local nanoparticle effects. The parametric investigation includes varying the initial nanoparticle concentration  ${\phi _0}$, porous medium contact angle
 $\theta$, nanoparticle contact angle
 ${\theta _p}$ and nanoparticle diffusion coefficient
 ${D_p}$. The results and analyses can be summarized as follows.
(i) With increasing initial nanoparticle concentration
 ${\phi _0}$ from zero to $10\,\%$, the average drying rate decreases, and the deposition tends to be more uniform along the porous medium height direction.
(ii) With increasing porous medium contact angle
$\theta$ from $15^\circ$ to $90^\circ$, the average drying rate varies slightly, while the liquid configuration during drying is more continuous showing fewer isolated clusters and the deposition is more uniform along the porous medium height direction.(iii) With increasing nanoparticle contact angle
${\theta _p}$ from $15^\circ$ to $75^\circ$, the average drying rate decreases gradually, but the final deposition is only slightly influenced.(iv) With increasing nanoparticle diffusion coefficient
${D_p}$ from 0.01 to 1.0, the averaged drying rate increases and converges at a certain value, while the deposition is becoming more uniform along the vertical direction of the porous medium.


To better quantify the influence of different parameters on the average drying rate, we plot all results as shown in figure 21. Note that we only consider the normalized liquid mass  ${m_N} \in (1\,\% ,75\,\% )$, i.e. once the liquid–vapour interface has receded into the porous medium (at
 ${m_N} = 75\,\%$) until almost all liquid is dried, since the last remaining liquid for
 ${m_N} \le 1\,\%$ dries out at a very low drying rate. The normalized average drying rates
 $E{p_{n,a}}$ for different parameter values is shown in figure S15 of the supplementary material. The results for different porous medium wettability are not shown since they are almost the same, as explained in figure 15(a). Although we have already analysed the influence of the parameters on the drying rate separately, here we desire to further look at this dataset as a whole and aim to quantify the different influences by proposing a unified relation.
Comparison of LBM results for the normalized average evaporation rate  ${(E{p_{n,a}})_{LBM}}$ under different conditions (initial concentration
 ${\phi _0} \in [0,10\,\%]$, nanoparticle contact angle
 ${\theta _p} \in [15^\circ,75^\circ ]$, nanoparticle diffusion coefficient
 ${D_p} \in [0.01,1.0]$) with unified relation
 ${(E{p_{n,a}})_{Eq.}} = [1 - 4.517\phi _0^{2/3}\sin \theta _p^2]*[0.046\ln ({D_p}) + 1.11]$. The solid circles indicate the verification with the parameters of
 ${\phi _0}$,
 ${\theta _p}$ and
 ${D_p}$ given in table 1.

In § 3.3 we obtained a relation for the local normalized evaporation rate  $E{p_n} = E{p_s}/E{p_l} \approx 1 - {\phi _{if}}$ for the case of a simple flat liquid–vapour interface, We now extend the relation to account for the complex drying of porous media. From (3.6) giving the interfacial nanoparticle volume fraction, we obtain the relation between the local average evaporation rate
 $E{p_n}$, nanoparticle volume fraction
 $\phi$ and nanoparticle contact angle
 ${\theta _p}$, i.e.
 $E{p_n} \approx 1 - \frac {1}{4}{{\rm \pi} ^{1/3}}{(6\phi )^{2/3}}{\sin ^2}{\theta _p}$. For porous media, an analogous relation can be proposed for the drying rate
 $E{p_n} \approx 1 - {p_1}{\phi ^{2/3}}{\sin ^2}{\theta _p}$, where
 ${p_1}$ is a parameter to be adjusted for the porous media of consideration. For the nanoparticle diffusion coefficient, figure S15c of the supplementary material shows a logarithmic trend. Therefore, we propose
 $E{p_n} \approx {p_2}\ln ({D_p}) + {p_3}$ to describe the influence of the nanoparticle diffusion coefficient. To incorporate all three parameters,
 ${\phi _0}$,
 ${\theta _p}$ and
 ${D_p}$, into a unified relation, we combine the different expressions into a singular relation for the normalized average evaporation rate
 $E{p_{n,a}}$,
 \begin{equation} E{p_{n,a}} \approx [1 - {p_1}\phi_0^{2/3}{\sin ^2}{\theta_p}]*[{p_2}\ln ({D_p}) + {p_3}],\end{equation}
where the parameters  ${p_1}$ to
 ${p_3}$ are determined by fitting to the data obtained from current LBM simulations. For
 ${p_1} = 4.517$,
 ${p_2} = 0.046$ and
 ${p_3} = 1.11$, a good agreement is achieved between the simulation data and the approximated value as observed in figure 21, with a coefficient of determination
 ${R^2} = 92.2\,\%$.
Since the parametric study only considered the variation of a single parameter, while the others remained unchanged, we conducted additional simulations for different combinations of the three parameters covering the parameter range, as given in table 1. The average relative error of the obtained results is 4.7 % indicating an acceptable agreement, as shown by cyan solid circles in figure 21.
Verification of (5.1) for different combinations of independent variables  ${\phi _0}$,
 ${\theta _p}$ and
 ${D_p}$.

6. Concluding remarks
In this paper we have implemented a 2-D double-distribution MRT LBM to study the isothermal drying of colloidal suspensions considering the local nanoparticle effect. The two MRT LBMs solve two-phase flow and nanoparticle transport, respectively. For the later, a force term to model the fluid–particle interaction is added to the right-hand side of the LB equation, which is more advantageous stability wise than incorporating it as a velocity increment, as previously done. More importantly, the local nanoparticle effects on the fluid dynamics, namely viscosity increase, surface tension drop and local drying rate reduction, are incorporated into the model. The model is validated by simulating the drying of a 2-D suspended colloidal droplet. For the Péclet numbers of 68 and 3.2, a hollow shell and a compact sphere are formed, respectively, and the evolution of the diameter squared agrees well with experimental results. Afterwards, the model is further validated by simulating the drying of a colloid in a 2-D capillary tube with two open ends. Different cases considering the three local nanoparticle effects are conducted. It is observed that, for a Péclet number  $Pe \sim 25$, the drying dynamics is very similar. The best agreement is obtained when considering all three nanoparticle effects.
Using our validated model, we further investigate the complex drying of colloidal suspension in 2-D porous media considering three local nanoparticle effects. We first analyse the drying dynamics and resultant nanoparticle transport, accumulation and deposition for the specific case of porous asphalt. Then we conduct a parametric study varying initial nanoparticle concentration  ${\phi _0} \in [0,10\,\% ]$, porous medium contact angle
 $\theta \in [15^\circ,90^\circ ]$, nanoparticle contact angle
 ${\theta _p} \in [15^\circ,75^\circ ]$ and diffusion coefficient
 ${D_p} \in [0.01,1.0]$. Their influences on drying dynamics, drying rate, deposition process and final deposition configurations are analysed in detail. Finally, to quantify these influences, we propose a unified relation between the average drying rate and the studied parameters
 ${\phi _0}$,
 ${\theta _p}$ and
 ${D_p}$. The porous medium contact angle
 ${\theta }$ is not included as it does not show a significant influence. The unified relation for this porous medium reads
 $E{p_{n,a}} \approx [1 - {p_1}\phi _0^{2/3}{\sin ^2}{\theta _p}]*[{p_2}\ln ({D_p}) + {p_3}]$, where the parameters are
 ${p_1} = 4.517$,
 ${p_2} = 0.046$ and
 ${p_3} = 1.11$. The good agreement between prediction using unified relation and simulation results based on random combinations of the free parameters validate further the proposed relation. We note that the proposed expression is specific to the porous asphalt studied and to the assumptions stemming from 2-D modelling of fluid flow. Moreover, the expression is only valid for diffusive drying without air convection.
In the future, to achieve a more universal relation, the model will be extended to investigate drying of colloidal suspension in 3-D combining experimental study with the consideration of non-isothermal effects and air convection. More complicated processes and applications such as consolidation, crystallization and sol-gel transition, etc., will also be explored.
Supplementary material and movies
Supplementary material and movies are available at https://doi.org/10.1017/jfm.2023.344.
Acknowledgements
Dr S. Xiao (University of Bath, UK) is acknowledged for assistance in postprocessing partial data.
Funding
Swiss National Science Foundation (SNF, project no. 175793) and the Fundamental Research Funds for the Central Universities (G2022KY05105) are acknowledged for financial support, and Swiss National Super Computing Center (project no. s1081) is acknowledged for computational support. Q. K. acknowledges support from LANL's Institutional Computing Program.
Declaration of interests
The authors report no conflict of interest.


 Open access

