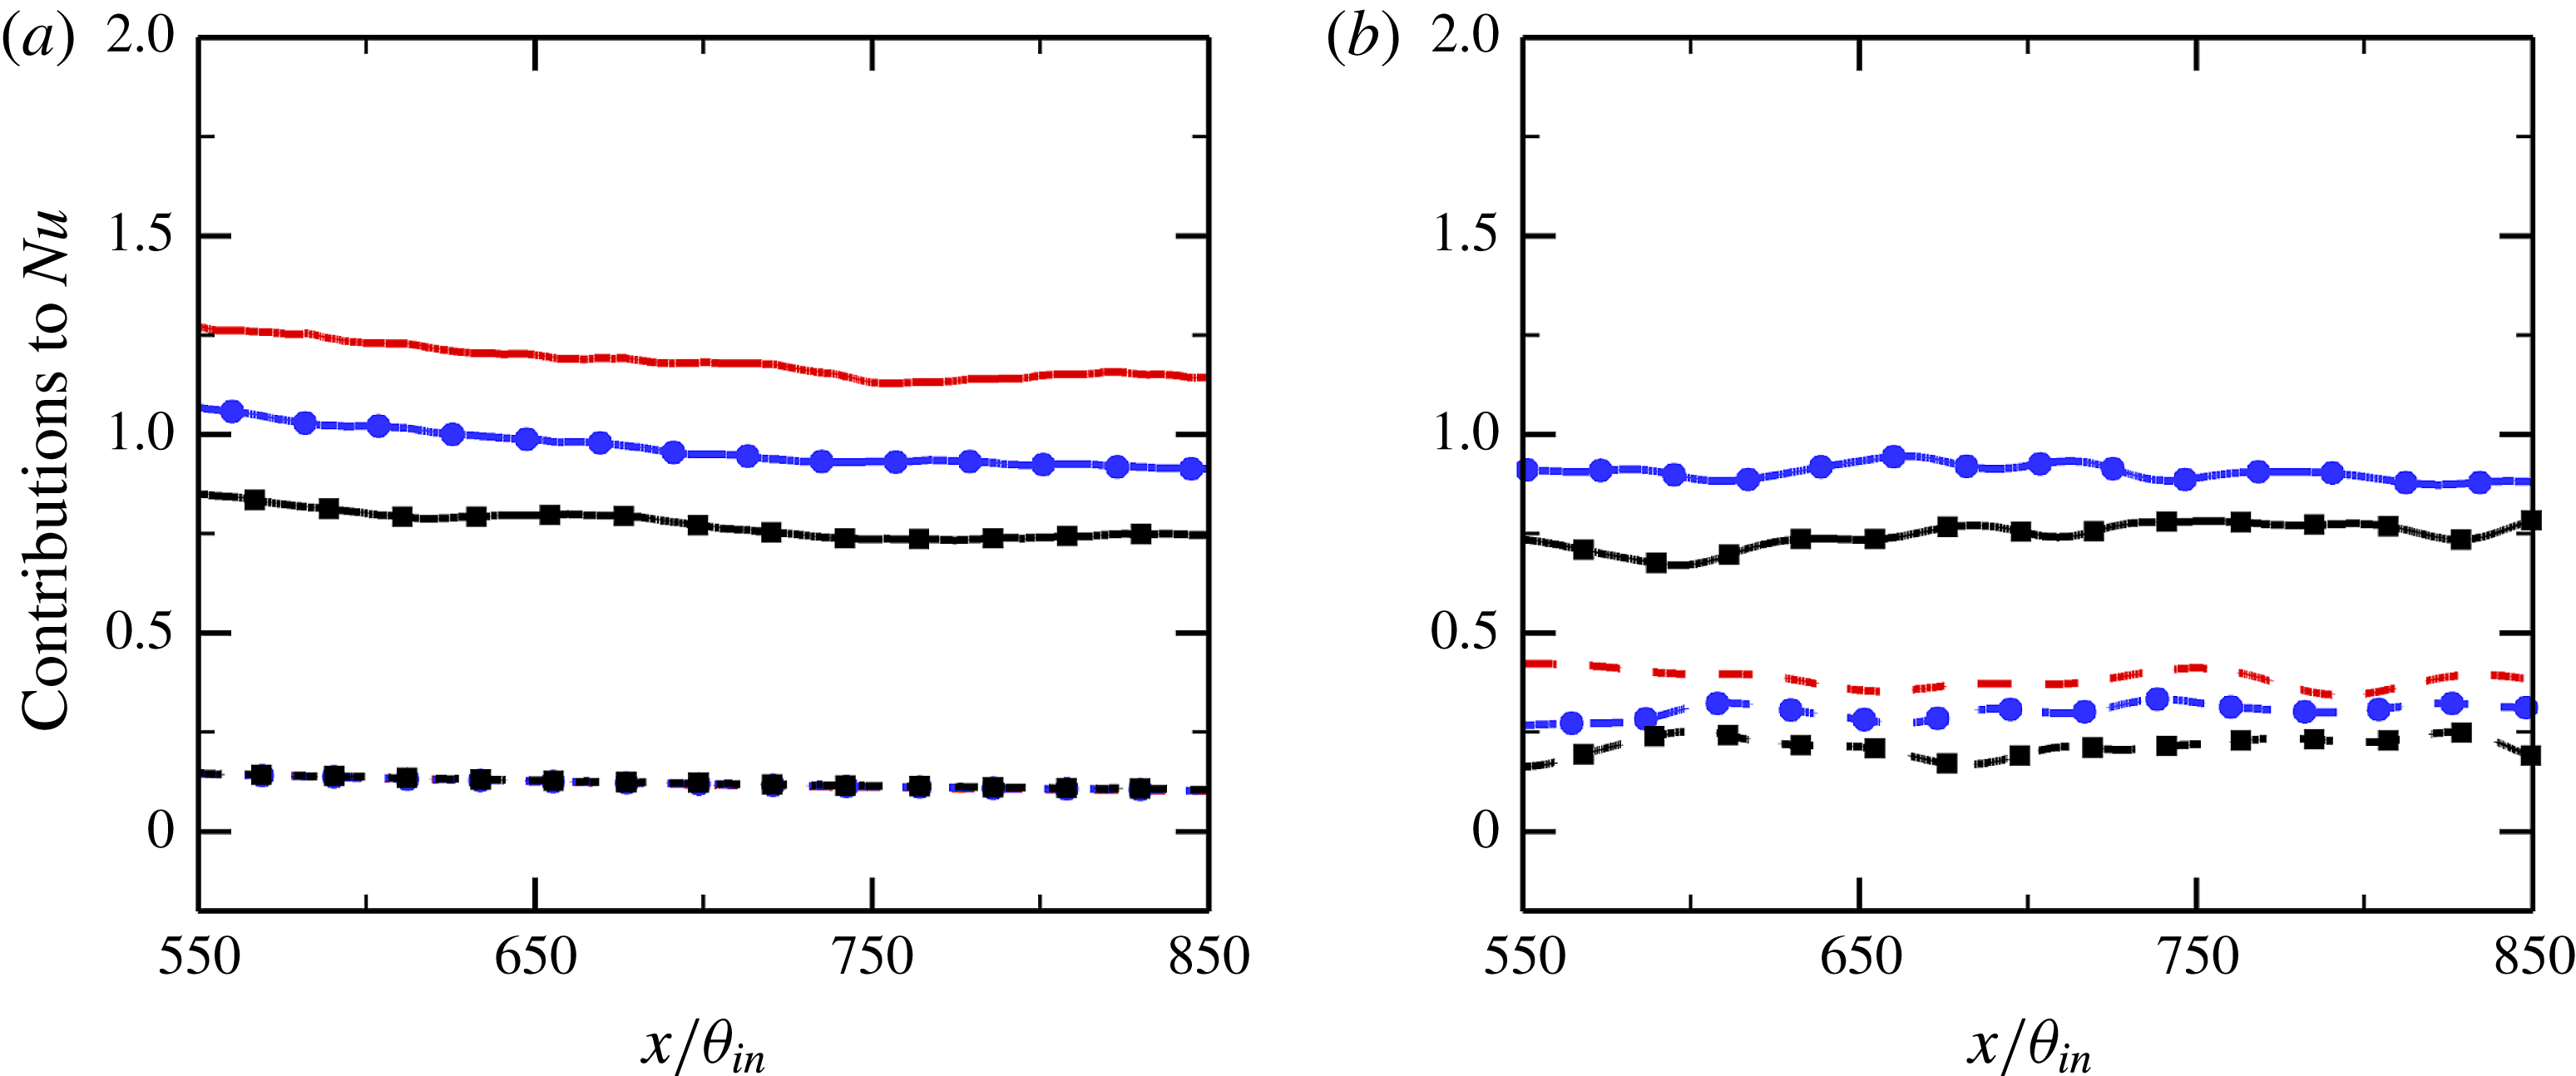
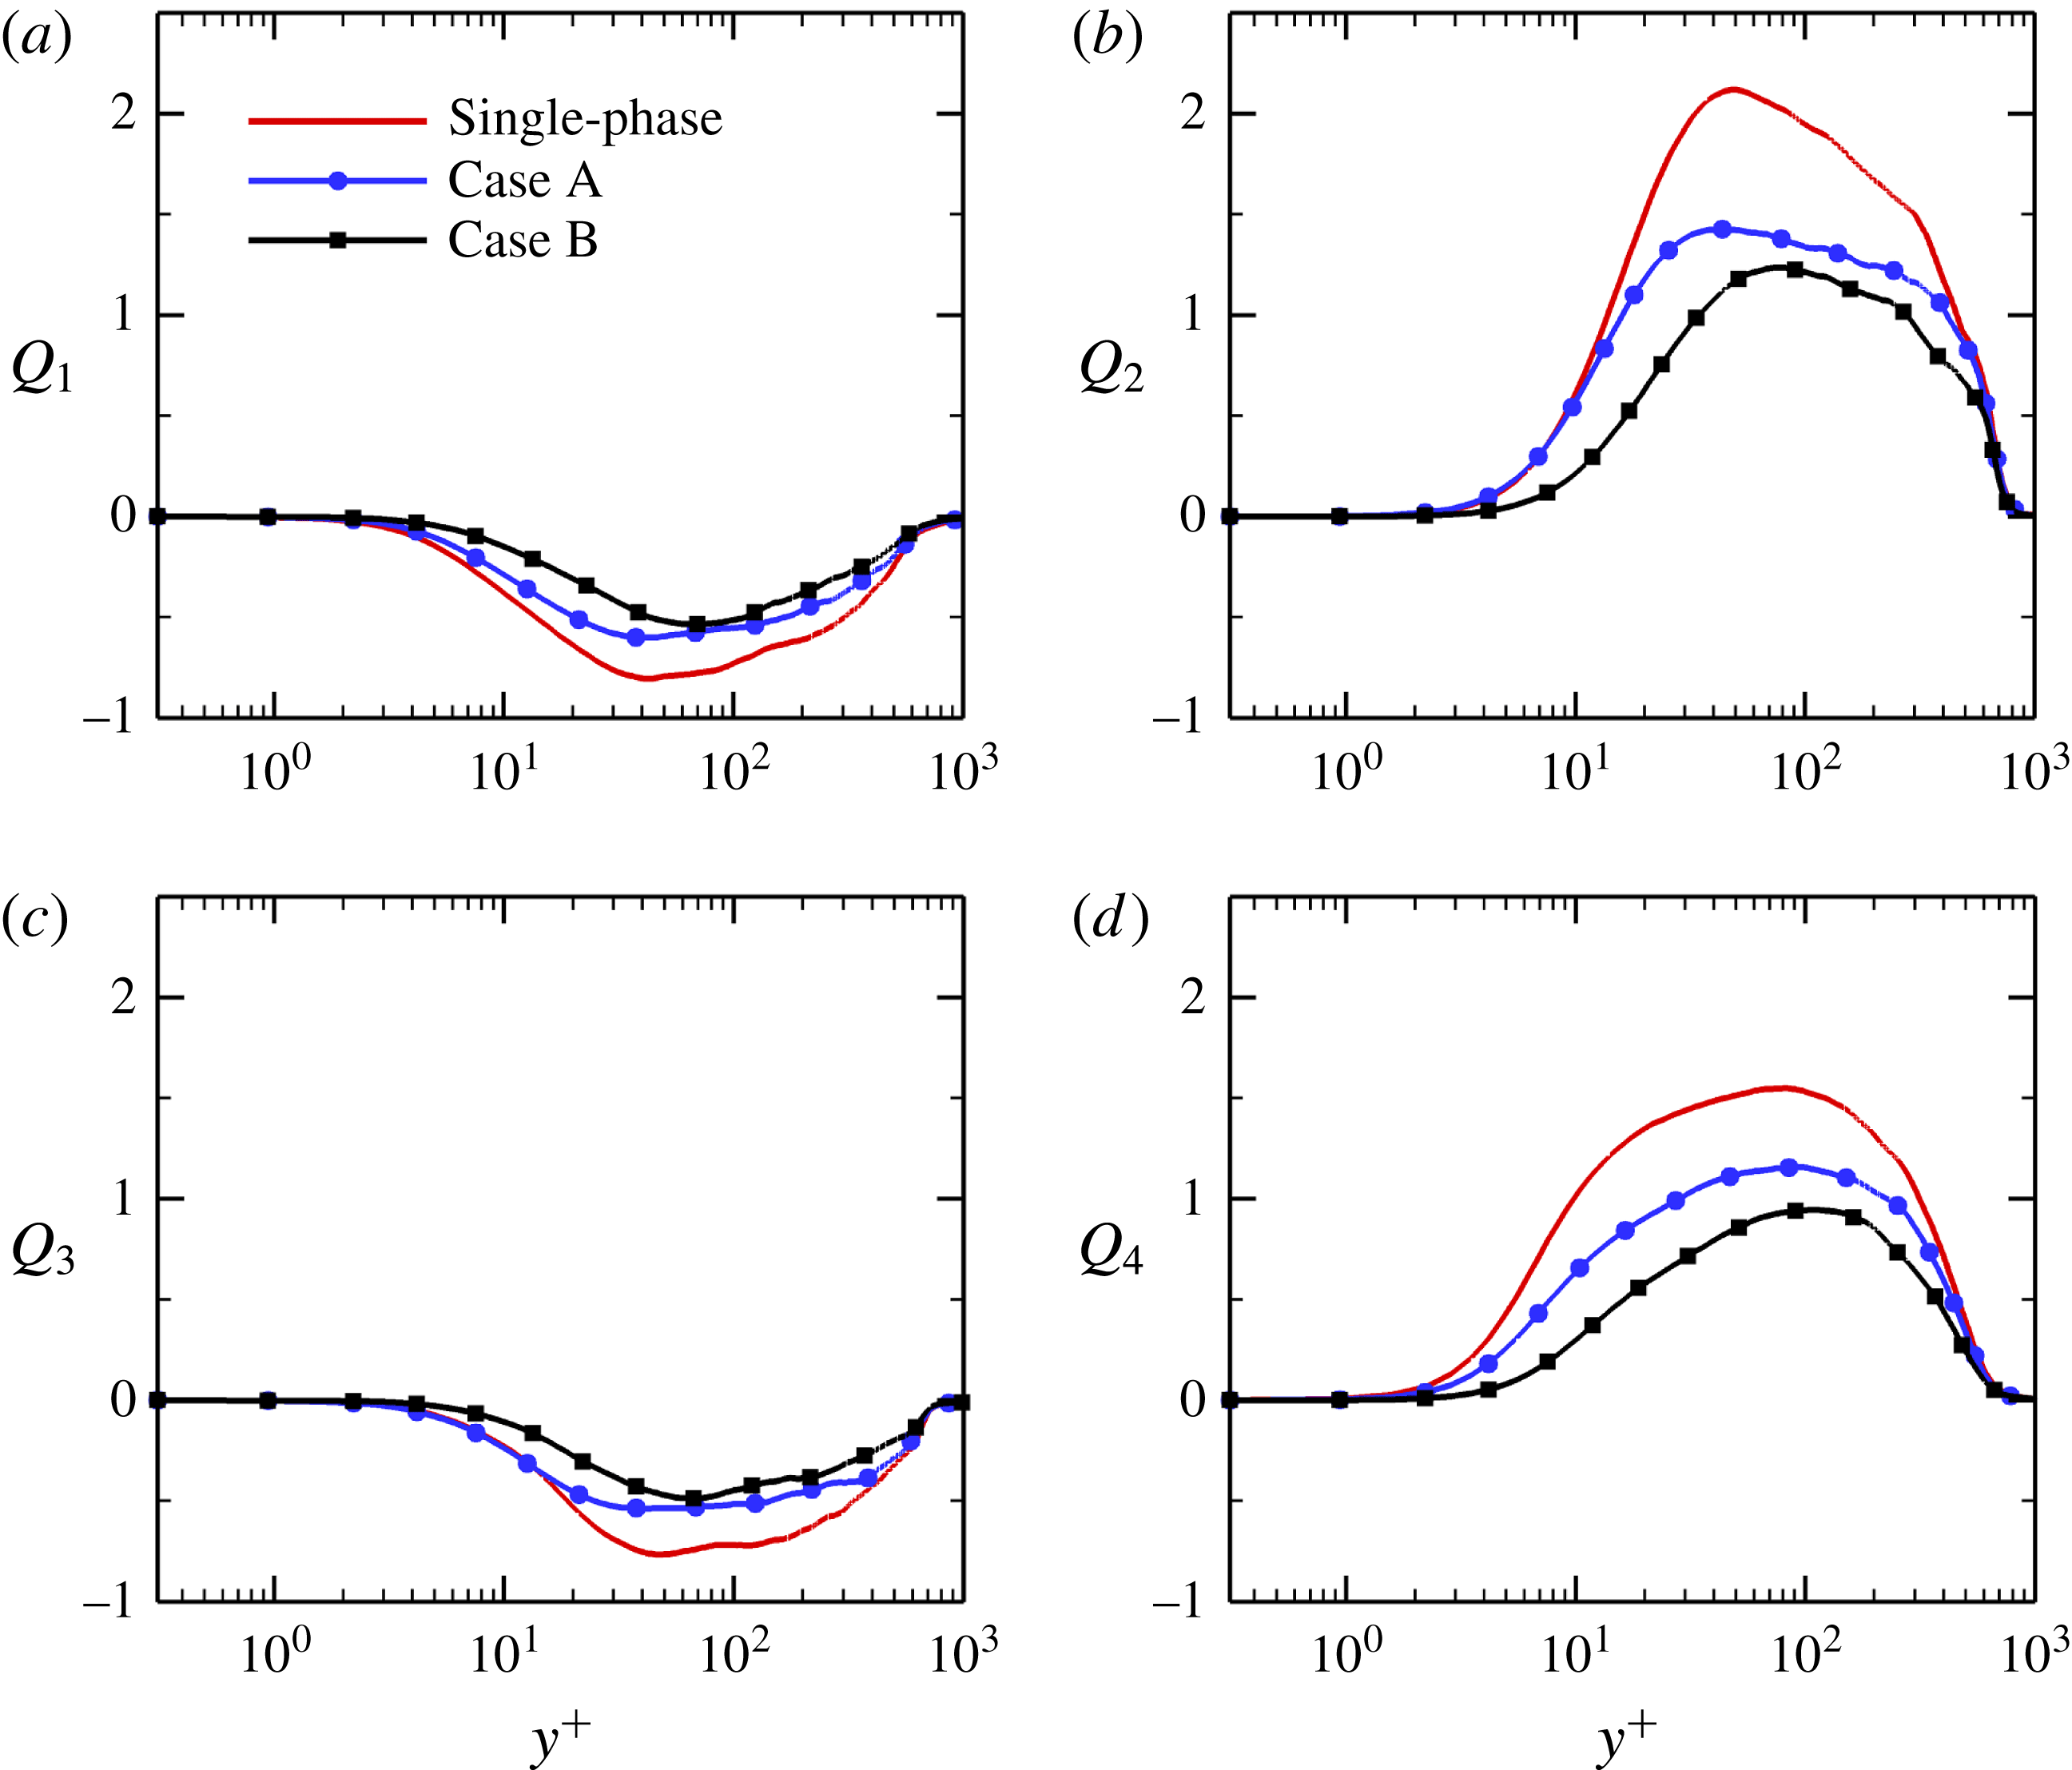
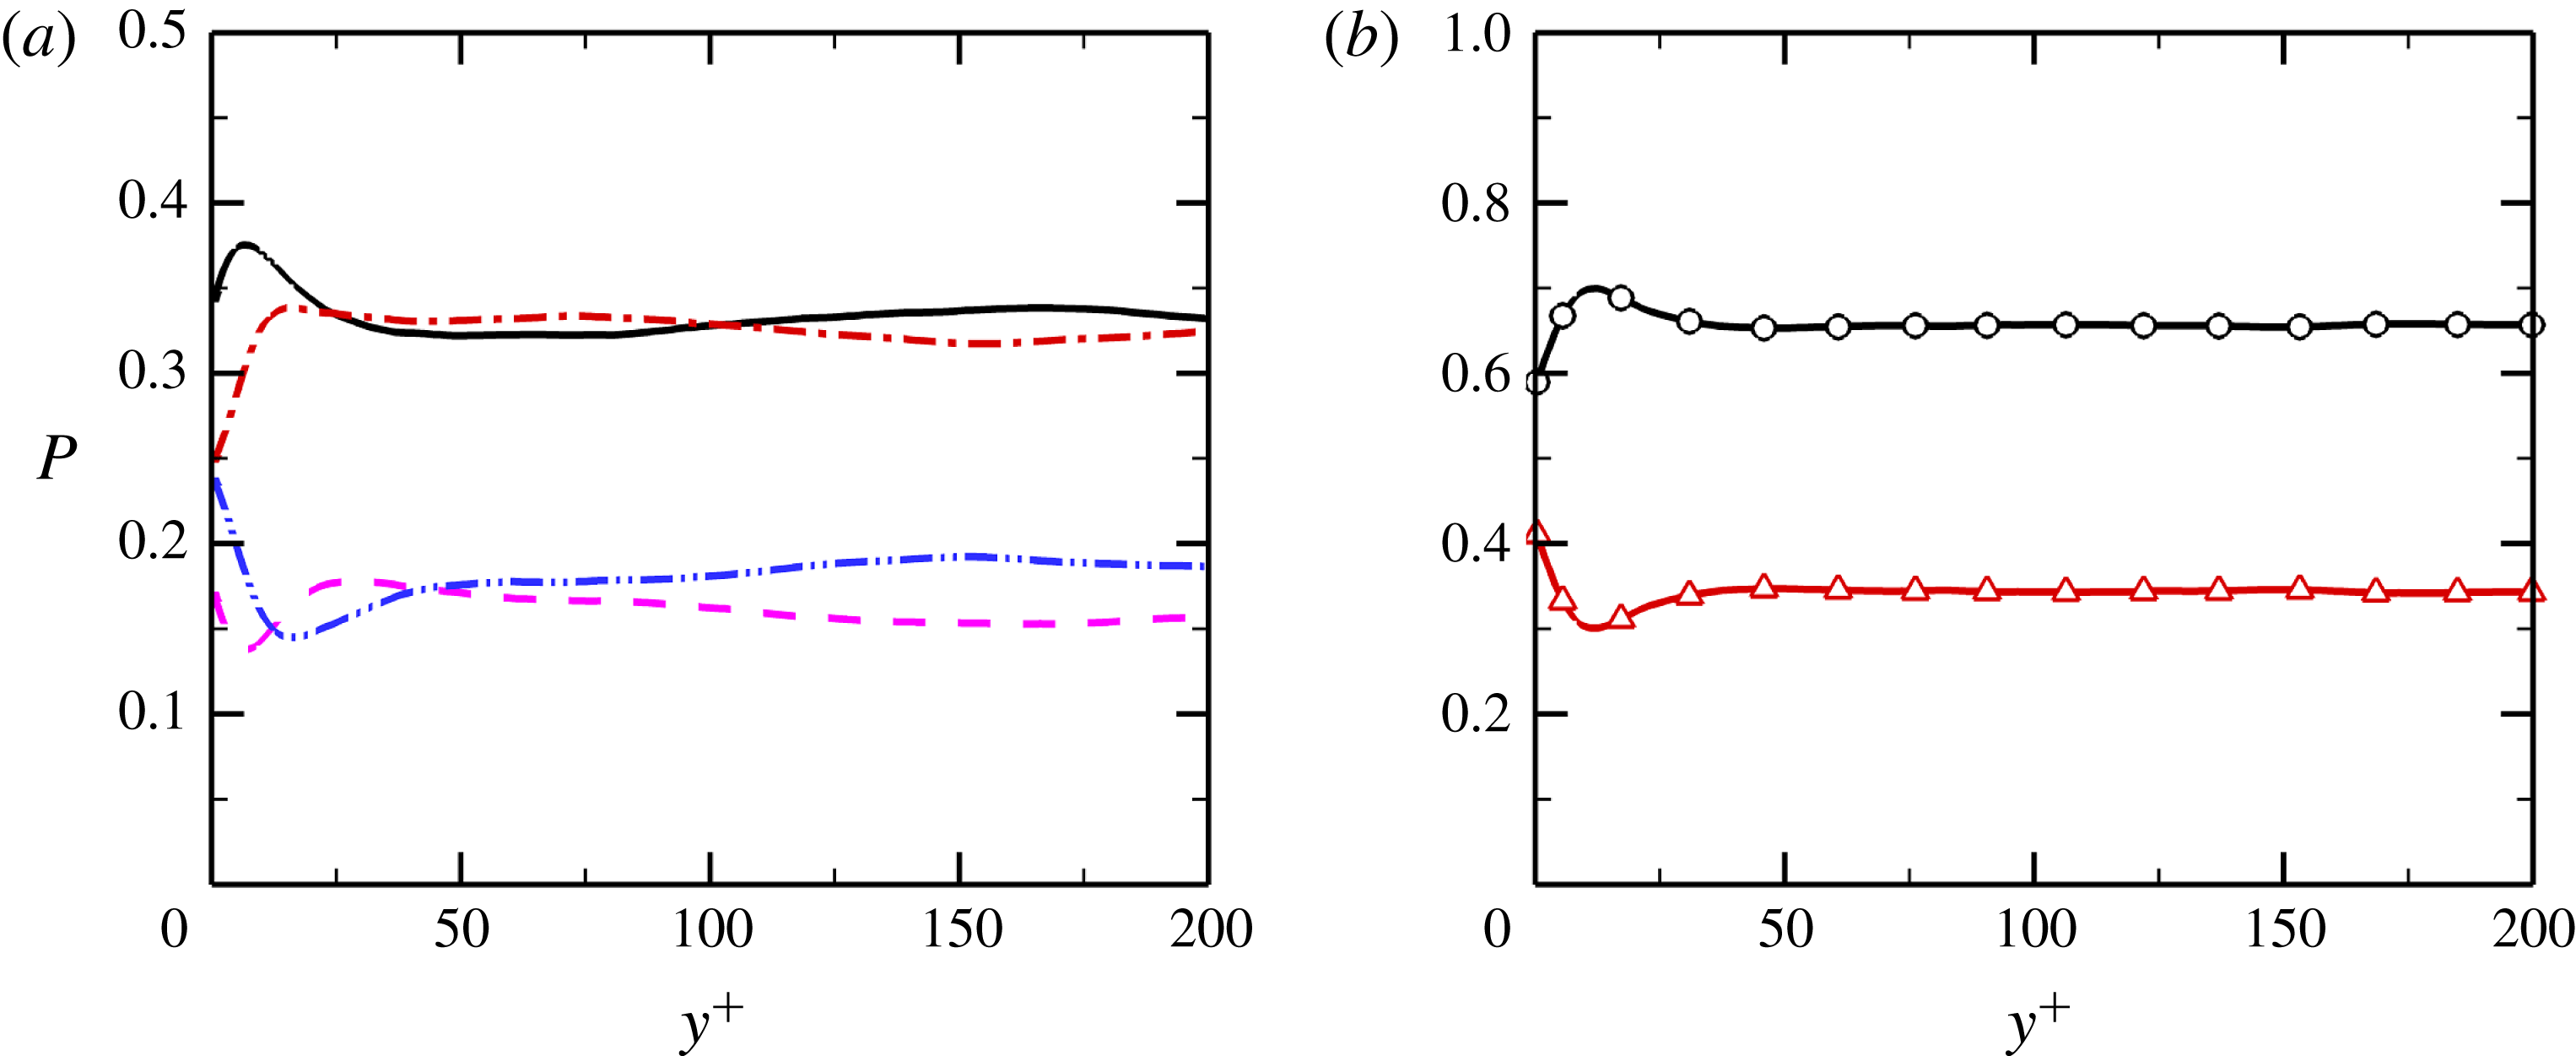
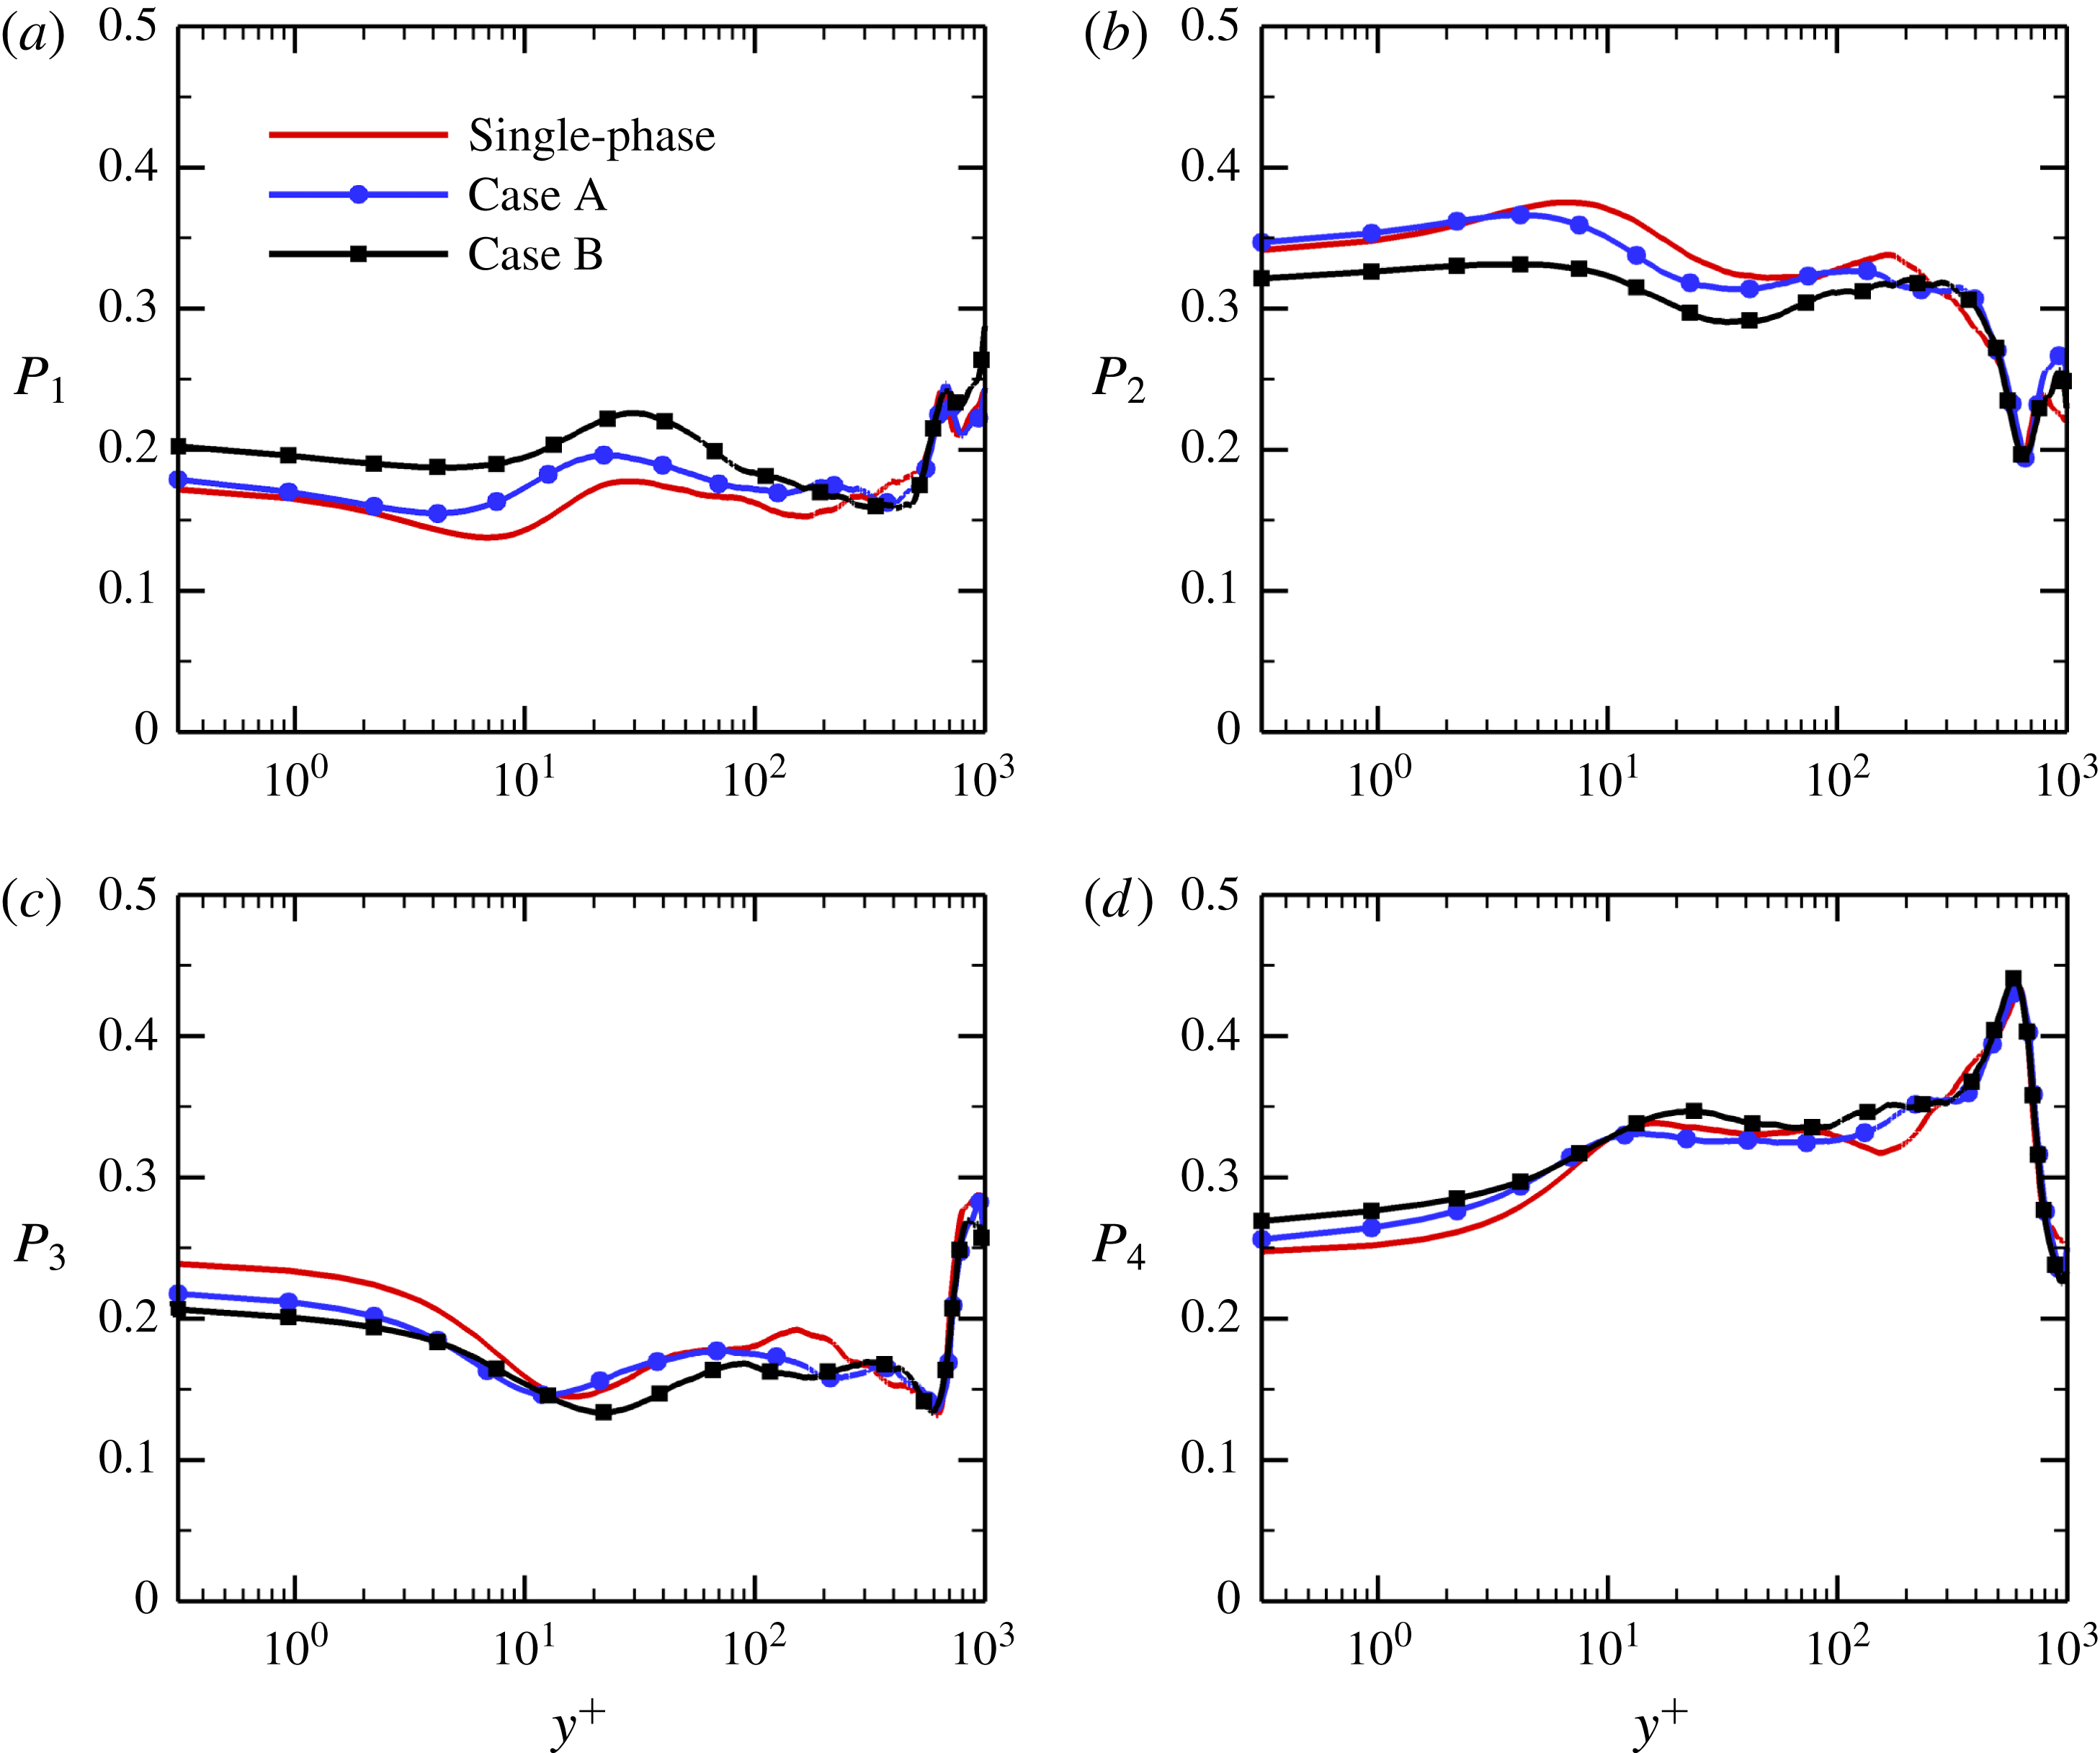
1 Introduction
Turbulent flows laden with particles are widely encountered in a broad range of natural phenomena and industrial applications, such as volcanic eruptions, pulverized coal combustion and urban pollutant dispersion. In these flows there exist complex interactions between inertial particles, flow turbulence and heat transfer, many of which have not yet been adequately investigated and still remain open questions.
Over the past few decades, a great number of laboratory experiments and numerical simulations have been conducted to investigate the heat transfer between particles and fluid in non-isothermal turbulent flows. In general, the heat transfer coefficient is affected by particle size, mass loading, particle specific heat and fluid Reynolds number (Avila & Cervantes Reference Avila and Cervantes1995; Mansoori, Saffar-Avval & Ahmadi Reference Mansoori, Saffar-Avval, Tabrizi and Ahmadi2002). Han, Sung & Chung (Reference Han, Sung and Chung1991) proposed a two-fluid model to study the heat transfer in gas–solid two-phase flows in a vertical pipe with constant wall heat flux. They found that the presence of particles with low mass loadings caused a reduction in the Nusselt number due to the increase in the viscous sublayer thickness, while the opposite was true for the particles with high mass loadings. Avila & Cervantes (Reference Avila and Cervantes1995) numerically analysed the heat transfer coefficient in a gas–solid turbulent pipe flow with constant wall temperature, using an Euler–Lagrangian mathematical model. They reported that small particles (
 $d_{p}<140~\unicode[STIX]{x03BC}\text{m}$
) increased the heat transfer coefficient, whereas large particles had no significant impact on it. However, this is in contrast to the experimental data of Hetsroni & Rozenblit (Reference Hetsroni and Rozenblit1994) in a flume, in which heat transfer was observed to be enhanced by large polymer particles but it was not significantly affected by small particles. In addition, Mansoori et al. (Reference Mansoori, Saffar-Avval, Tabrizi and Ahmadi2002) concluded that the addition of solid particles attenuated the temperature fluctuations in the near-wall region. Recently, Lessani & Nakhaei (Reference Lessani and Nakhaei2013) investigated the effect of particle specific heat on the heat transfer rate of a turbulent channel flow by means of large-eddy simulation. They found that the heat transfer rate increased proportionally with particle specific heat.
Besides using the numerical modelling of heat transfer in particle-laden flows, direct numerical simulation (DNS) has also been employed to investigate the turbulent heat transfer modulation caused by particles. Jaberi & Mashayek (Reference Jaberi and Mashayek2000) examined the influences of several important flow and particle parameters on the thermal statistics of the fluid and particles by DNSs of stationary and decaying isotropic turbulent flows with one-way and two-way coupling. Hetsroni, Mosyak & Pogrebnyak (Reference Hetsroni, Mosyak and Pogrebnyak2002) studied the interactions between coarse particles and fluid turbulence in a non-isothermal turbulent channel flow by means of both DNS and experiment, focusing mainly on the effect of particle diameter on the momentum and heat transfer in the vicinity of the wall. Their results indicated that the wall-normal turbulent heat flux for the fluid phase increased with increasing particle diameter. Zonta, Marchioli & Soldati (Reference Zonta, Marchioli and Soldati2008) performed DNSs of particle-laden fully developed turbulent channel flows with heat transfer to study the effects of particle inertia on the temperature fields of the dispersed and fluid phases. They stated that smaller particles enhanced the heat transfer fluxes at the wall, whereas larger particles slightly attenuated it. They subsequently further investigated the heat transfer modulation produced by solid microparticles with different sizes and different mass loadings through a quantitative analysis of time-dependent heat fluxes (Zonta, Marchioli & Soldati Reference Zonta, Marchioli and Soldati2010). Kuerten, van der Geld & Geurts (Reference Kuerten, van der Geld and Geurts2011) investigated the turbulence modulation and heat transfer in a two-way coupled DNS of particle-laden channel flow, and showed that the presence of inertial particles enhanced the heat transfer and increased the friction velocity. Their numerical results indicated that the turbophoresis effect was responsible for the increase in heat transfer and the particle specific heat was an important parameter to evaluate the heat transfer modulation by particles. On the other hand, Nakhaei & Lessani (Reference Nakhaei and Lessani2017) recently exploited a DNS of non-isothermal turbulent channel flow laden with solid particles. They found that the heat transfer rate, fluid velocity fluctuations and turbulent heat fluxes were attenuated under the effect of particles.
Despite the continuously increasing number of experimental and numerical investigations, most have focused either on homogeneous and isotropic turbulent flows or on parallel flows, such as pipe or channel flows, in which spatial periodicity is assumed along the flow direction. To this date, little is known about the effect of inertial particles on a spatially developing turbulent boundary layer with heat transfer. Moreover, the physical mechanisms for the modification of turbulent flow and heat transfer by particles remain poorly understood. Concerning the single-phase thermal boundary layer flows, numerous studies have been conducted to investigate the passive scalar transport with different wall boundary conditions (isothermal or isoflux walls) and different Reynolds and Prandtl numbers (Fulachier & Dumas Reference Fulachier and Dumas1976; Kong, Choi & Lee Reference Kong, Choi and Lee2000; Li et al. Reference Li, Schlatter, Brandt and Henningson2009; Li, Luo & Fan Reference Li, Luo and Fan2016a ). A strong correlation between the streamwise velocity and temperature fluctuations was observed in the near-wall region.
In our recent study (Li, Luo & Fan Reference Li, Luo and Fan2016b
), we investigated the interactions between inertial particles and fluid turbulence in a isothermal flat-plate boundary layer with relatively low Reynolds numbers,
 $80\leqslant Re_{\unicode[STIX]{x1D703}}\leqslant 1150$
, and explained the physical mechanisms of turbulence modulation by particles. In the present study, DNSs of spatially developing turbulent thermal boundary layers laden with small solid particles have been carried out using a realistic fully developed turbulent inflow, extending the Reynolds number range from
 $Re_{\unicode[STIX]{x1D703}}=1100$
to 1940. The main purpose of this work is to assess, for the first time to the authors’ best knowledge, the interactions between turbulence, heat transfer and particles in a spatially evolving turbulent thermal boundary layer over a flat plate by means of a two-way coupled Eulerian–Lagrangian point-particle method.
The structure of the paper is as follows. The numerical method and the models adopted for the particle phase are described in § 2. Then in § 3, we present the results for DNSs of particle-laden turbulent flows with heat transfer, focusing on the effects of particle inertia on turbulent velocity and temperature fields. The influence of inertial particles on turbulent coherent structures is investigated in detail in § 4. In § 5, we investigate the underlying physical mechanisms of turbulent heat transfer modulation caused by particles from various aspects. Finally, conclusions are drawn and future developments are outlined in § 6.
2 Numerical method
2.1 Governing equations of fluid flow
In this study, the continuity, momentum and energy equations governing the motion of the non-isothermal incompressible fluid can be expressed in dimensionless form as
 $$\begin{eqnarray}\displaystyle & \displaystyle \unicode[STIX]{x1D735}\boldsymbol{\cdot }\boldsymbol{u}=0, & \displaystyle\end{eqnarray}$$
 $$\begin{eqnarray}\displaystyle & \displaystyle {\displaystyle \frac{\unicode[STIX]{x2202}\boldsymbol{u}}{\unicode[STIX]{x2202}t}}+\boldsymbol{u}\boldsymbol{\cdot }\unicode[STIX]{x1D735}\boldsymbol{u}=-\unicode[STIX]{x1D735}p+{\displaystyle \frac{1}{Re_{\unicode[STIX]{x1D703}_{in}}}}\unicode[STIX]{x1D6FB}^{2}\boldsymbol{u}+\boldsymbol{f}, & \displaystyle\end{eqnarray}$$
 $$\begin{eqnarray}\displaystyle & \displaystyle {\displaystyle \frac{\unicode[STIX]{x2202}\unicode[STIX]{x1D6E9}}{\unicode[STIX]{x2202}t}}+\boldsymbol{u}\boldsymbol{\cdot }\unicode[STIX]{x1D735}\unicode[STIX]{x1D6E9}={\displaystyle \frac{1}{Re_{\unicode[STIX]{x1D703}_{in}}Pr}}\unicode[STIX]{x1D6FB}^{2}\unicode[STIX]{x1D6E9}+q, & \displaystyle\end{eqnarray}$$
where
 $\boldsymbol{u}=(u,v,w)$
is the instantaneous fluid velocity vector, where
 $u$
,
 $v$
and
 $w$
are the velocity components in the streamwise (
 $x$
), wall-normal (
 $y$
) and spanwise (
 $z$
) directions, respectively;
 $p$
is the fluctuating kinematic pressure;
 $\unicode[STIX]{x1D6E9}$
is the dimensionless temperature, defined as
 $\unicode[STIX]{x1D6E9}=(T-T_{w})/(T_{\infty }-T_{w})$
, where
 $T_{w}$
and
 $T_{\infty }$
denote the wall temperature and free-stream temperature, respectively; the momentum thickness Reynolds number at the inlet,
 $Re_{\unicode[STIX]{x1D703}_{in}}=U_{\infty }\unicode[STIX]{x1D703}_{in}/\unicode[STIX]{x1D708}$
, is defined based on the free-stream fluid velocity
 $U_{\infty }$
, the inlet momentum thickness
 $\unicode[STIX]{x1D703}_{in}$
and the kinematic viscosity
 $\unicode[STIX]{x1D708}$
;
 $Pr=\unicode[STIX]{x1D70C}_{f}\unicode[STIX]{x1D708}c_{f}/k_{f}$
is the Prandtl number, where
 $\unicode[STIX]{x1D70C}_{f}$
,
 $c_{f}$
and
 $k_{f}$
are the density, specific heat and thermal conductivity of the Newtonian fluid, respectively;
 $\boldsymbol{f}$
and
 $q$
represent the momentum-coupling and energy-coupling terms in the particle-laden flows. In the present simulations, the fluid is taken to be air with
 $\unicode[STIX]{x1D70C}_{f}=1.205~\text{kg}~\text{m}^{-3}$
,
 $\unicode[STIX]{x1D708}=1.5\times 10^{-5}~\text{m}^{2}~\text{s}^{-1}$
and
 $Pr=0.71$
.
The governing equations of fluid flow (2.1)–(2.3) are solved using a fractional step method on staggered grids (Perot Reference Perot1993). The convective and wall-parallel diffusion terms are integrated explicitly using a low-storage, third-order Runge–Kutta scheme, while the diffusion terms in the wall-normal direction are integrated implicitly using a second-order Crank–Nicolson scheme. The spatial derivatives in the convective terms are discretized by a fourth-order central difference scheme and the derivatives in the diffusion terms are discretized based on fourth-order Lagrange interpolating polynomials (Shukla, Tatineni & Zhong Reference Shukla, Tatineni and Zhong2007; Desjardins et al. Reference Desjardins, Blanquart, Balarac and Pitsch2008). The biconjugate gradient stabilized (BICGSTAB) solver with multigrid preconditioner is used to solve the pressure Poisson equation.
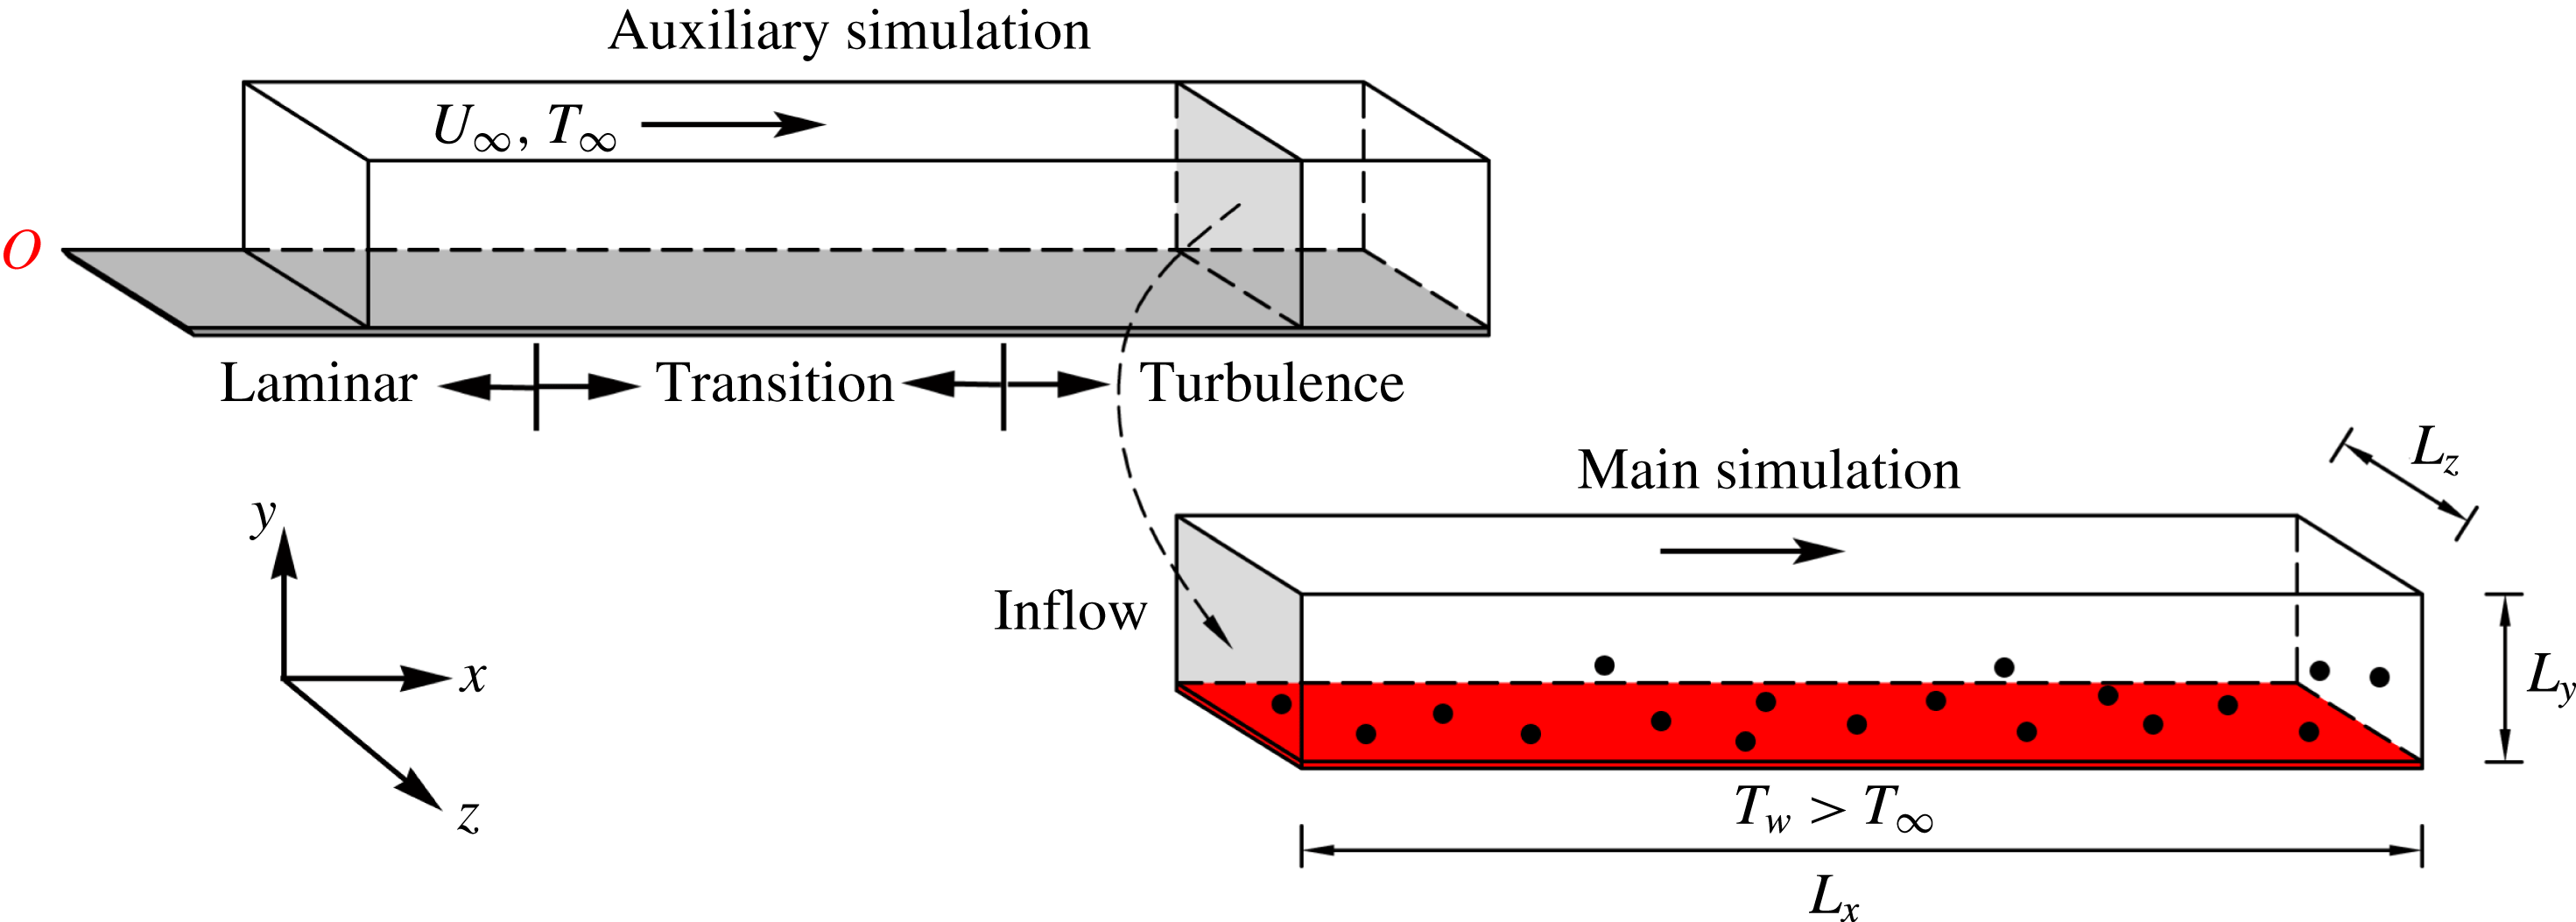
Figure 1 shows a schematic diagram of the computational domain. The origin of the three-dimensional Cartesian coordinate system is located on the wall at the leading edge of the flat plate and the turbulent inflow is characterized by
 $Re_{\unicode[STIX]{x1D703}_{in}}=1100$
(
 $x=440\unicode[STIX]{x1D703}_{in}$
). The dimensions of the computational domain are
 $464\unicode[STIX]{x1D703}_{in}\times 109\unicode[STIX]{x1D703}_{in}\times 27\unicode[STIX]{x1D703}_{in}$
with
 $4096\times 512\times 128$
grid points along the
 $x$
,
 $y$
and
 $z$
directions, respectively. The grids are uniform in the streamwise and spanwise directions, with
 $\unicode[STIX]{x0394}x^{+}=5.36$
and
 $\unicode[STIX]{x0394}z^{+}=9.98$
; while stretched grids are employed in the wall-normal direction by using a hyperbolic-tangent function, with the first grid point away from the wall being located at
 $\unicode[STIX]{x0394}y_{min}^{+}=0.62$
, which is smaller than the minimum Kolmogorov length scale
 $\unicode[STIX]{x1D702}_{min}^{+}=1.39$
. The streamwise resolution is comparable to that used in previous boundary layer simulations (Simens et al.
Reference Simens, Jiménez, Hoyas and Mizuno2009; Wu & Moin Reference Wu and Moin2010; Lee et al.
Reference Lee, Jung, Sung and Zaki2013) and the grid resolution in the spanwise direction is close to that used by Schlatter et al. (Reference Schlatter, Örlü, Li, Brethouwer, Fransson, Johansson, Alfredsson and Henningson2009) and Araya & Castillo (Reference Araya and Castillo2012). Unless otherwise stated, all variables written in wall units (identified by superscript
 $+$
) are non-dimensionalized using the dimensionless wall-friction velocity
 $u_{\unicode[STIX]{x1D70F}}=0.043$
of the single-phase flow at
 $Re_{\unicode[STIX]{x1D703}}=1840$
.
Schematic diagram of the computational domain in the particle-laden turbulent boundary layer with heat transfer, where
 $L_{x}$
,
 $L_{y}$
and
 $L_{z}$
are the dimensions of the computational domain in the streamwise, wall-normal and spanwise directions, respectively.

For the DNS of spatially developing turbulent boundary layers, one main challenge is how to specify a realistic time-dependent turbulent inflow boundary condition. In this study, an auxiliary simulation approach, in which DNS of a zero-pressure-gradient flat-plate boundary layer has been performed with
 $Pr=0.71$
over a wide range of Reynolds numbers,
 $80\leqslant Re_{\unicode[STIX]{x1D703}}\leqslant 1150$
, was employed to generate turbulent inflow conditions (figure 1). The geometry and flow parameters in the auxiliary computation are the same as those in Li et al. (Reference Li, Luo and Fan2016b
). In order to trigger a laminar boundary layer to turbulence, the velocity fluctuations of the isotropic turbulence were introduced periodically into the computational domain with the free-stream velocity in the auxiliary simulation. When the flow field reached quasi-steady state, a time series of instantaneous velocity and temperature data was extracted from the
 $y$
–
 $z$
plane at
 $Re_{\unicode[STIX]{x1D703}}=1100$
and used as the inflow condition for the present simulation.
At the outflow plane of the computational domain,
 $x=904\unicode[STIX]{x1D703}_{in}$
, convective boundary conditions are specified (Orlanski Reference Orlanski1976). Periodic boundary conditions are used in the homogeneous spanwise direction. No-slip conditions are enforced on the isothermally heated wall. At the top of the computational domain, the boundary conditions are
 $u=U_{\infty }$
,
 $\unicode[STIX]{x2202}v/\unicode[STIX]{x2202}y=\unicode[STIX]{x2202}w/\unicode[STIX]{x2202}y=0$
and
 $\unicode[STIX]{x1D6E9}=\unicode[STIX]{x1D6E9}_{\infty }$
. Velocity corrections are also made at the exit to ensure global mass conservation.
2.2 Governing equations of particle motion
Concerning the dispersed phase, it is assumed that all particles are pointwise rigid spheres with identical diameter
 $d_{p}$
and density
 $\unicode[STIX]{x1D70C}_{p}$
. The temperature is considered to be uniform inside each particle, since the particle Biot number,
 $Bi=h_{p}d_{p}/(2k_{p})$
, is much smaller than 0.1 (Crowe et al.
Reference Crowe, Schwarzkopf, Sommerfeld and Tsuji2011), where
 $k_{p}$
is the thermal conductivity of the particles and
 $h_{p}$
is the convective heat transfer coefficient between the particles and the fluid. For small heavy particles,
 $\unicode[STIX]{x1D70C}_{p}/\unicode[STIX]{x1D70C}_{f}=1500$
, the only significant force is the drag force (Elghobashi & Truesdell Reference Elghobashi and Truesdell1992). To focus on particle–fluid interactions, gravity is not considered. The particle angular velocity is included in the particle-laden simulations, because it is used to calculate the non-ideal collisions.
Therefore, the Lagrangian equations to govern the motion of particles can be written as
 $$\begin{eqnarray}\displaystyle & \displaystyle {\displaystyle \frac{\text{d}\boldsymbol{x}_{p}}{\text{d}t}}=\boldsymbol{u}_{p}, & \displaystyle\end{eqnarray}$$
 $$\begin{eqnarray}\displaystyle & \displaystyle m_{p}{\displaystyle \frac{\text{d}\boldsymbol{u}_{p}}{\text{d}t}}=\boldsymbol{F}+\boldsymbol{F}_{c}, & \displaystyle\end{eqnarray}$$
 $$\begin{eqnarray}\displaystyle & \displaystyle I_{p}{\displaystyle \frac{\text{d}\unicode[STIX]{x1D74E}_{p}}{\text{d}t}}=\boldsymbol{T}+\boldsymbol{T}_{c}, & \displaystyle\end{eqnarray}$$
 $$\begin{eqnarray}\displaystyle & \displaystyle c_{p}m_{p}{\displaystyle \frac{\text{d}T_{p}}{\text{d}t}}=Q+Q_{c}, & \displaystyle\end{eqnarray}$$
where
 $\boldsymbol{x}_{p}$
,
 $\boldsymbol{u}_{p}$
,
 $\unicode[STIX]{x1D74E}_{p}$
and
 $T_{p}$
represent the position vector, linear velocity vector, angular velocity vector and temperature of each spherical particle with specific heat
 $c_{p}$
, mass
 $m_{p}=\unicode[STIX]{x03C0}\unicode[STIX]{x1D70C}_{p}d_{p}^{3}/6$
and moment of inertia
 $I_{p}=m_{p}d_{p}^{2}/10$
.
 $\boldsymbol{F}_{c}$
,
 $\boldsymbol{T}_{c}$
and
 $Q_{c}$
are respectively the force, torque and conductive heat transfer rate caused by the particle–particle and particle–wall collisions. The drag force
 $\boldsymbol{F}$
, the torque
 $\boldsymbol{T}$
and the rate of convective heat transfer from the fluid to the particle
 $Q$
are expressed as
 $$\begin{eqnarray}\displaystyle & \displaystyle \boldsymbol{F}=3\unicode[STIX]{x03C0}\unicode[STIX]{x03BC}d_{p}(1+0.15Re_{p}^{0.687})(\boldsymbol{u}_{f}-\boldsymbol{u}_{p}), & \displaystyle\end{eqnarray}$$
 $$\begin{eqnarray}\displaystyle & \displaystyle \boldsymbol{T}={\displaystyle \frac{\unicode[STIX]{x1D70C}_{f}}{2}}\left({\displaystyle \frac{d_{p}}{2}}\right)^{5}C_{R}|\unicode[STIX]{x1D74E}_{f}-\unicode[STIX]{x1D74E}_{p}|(\unicode[STIX]{x1D74E}_{f}-\unicode[STIX]{x1D74E}_{p}), & \displaystyle\end{eqnarray}$$
 $$\begin{eqnarray}\displaystyle & \displaystyle Q=Nu_{p}\unicode[STIX]{x03C0}d_{p}k_{f}(T_{f}-T_{p}), & \displaystyle\end{eqnarray}$$
where
 $\boldsymbol{u}_{f}$
,
 $\unicode[STIX]{x1D74E}_{f}=1/2\unicode[STIX]{x1D735}\times \boldsymbol{u}_{f}$
and
 $T_{f}$
are the velocity, angular velocity and temperature of the fluid at the particle position, which are evaluated using fourth-order Lagrange interpolating polynomials (near the wall, the interpolation scheme switches to one sided);
 $\unicode[STIX]{x1D707}$
is the dynamic viscosity of the fluid;
 $Re_{p}=d_{p}|\boldsymbol{u}_{f}-\boldsymbol{u}_{p}|/\unicode[STIX]{x1D708}$
is the particle Reynolds number; the particle Nusselt number
 $Nu_{p}$
is obtained from the Ranz–Marshall correlation (Ranz & Marshall Reference Ranz and Marshall1952)
 $$\begin{eqnarray}Nu_{p}={\displaystyle \frac{h_{p}d_{p}}{k_{f}}}=2+0.6Re_{p}^{1/2}Pr^{1/3}.\end{eqnarray}$$
According to Sommerfeld (Reference Sommerfeld2003), the rotational coefficient
 $C_{R}$
is given by
 $$\begin{eqnarray}C_{R}=\left\{\begin{array}{@{}ll@{}}{\displaystyle \frac{64\unicode[STIX]{x03C0}}{Re_{R}}}\quad & Re_{R}\leqslant 32,\\ {\displaystyle \frac{12.9}{Re_{R}^{0.5}}}+{\displaystyle \frac{128.4}{Re_{R}}}\quad & 32<Re_{R}<1000,\end{array}\right.\end{eqnarray}$$
where
 $Re_{R}$
is the rotational Reynolds number and it is defined as
 $Re_{R}=d_{p}^{2}|\unicode[STIX]{x1D74E}_{f}-\unicode[STIX]{x1D74E}_{p}|/\unicode[STIX]{x1D708}$
. In the present study,
 $Re_{R}$
is confirmed by the calculated results to be smaller than 32 and thus the torque can also be written as
 $$\begin{eqnarray}\boldsymbol{T}=\unicode[STIX]{x03C0}\unicode[STIX]{x03BC}d_{p}^{3}(\unicode[STIX]{x1D74E}_{f}-\unicode[STIX]{x1D74E}_{p}).\end{eqnarray}$$
In fact, our DNS results indicate that the particle Reynolds number
 $Re_{p}$
is rather small, and thus the flow around the particle can be approximately regarded as Stokes flow.
2.3 Two-way coupling and Lagrangian particle tracking
The particle volume fraction
 $\unicode[STIX]{x1D6F7}_{v}$
and mass loading
 $\unicode[STIX]{x1D6F7}_{m}$
are high enough to alter the turbulence (
 $\unicode[STIX]{x1D6F7}_{v}=6.67\times 10^{-4}$
) and thus two-way coupling is used in this study, where
 $\unicode[STIX]{x1D6F7}_{m}$
is defined to be the ratio of the mass of particles to the mass of fluid in the computational domain. Since the size of the particle is much smaller than the grid scale, a point-force approximation is assumed to model the effects of particles on the fluid velocity and temperature fields. The coupling terms in the momentum and energy equations can be formulated as
 $$\begin{eqnarray}\displaystyle & \displaystyle \boldsymbol{f}_{m}=-\mathop{\sum }_{n=1}^{n_{p}}{\displaystyle \frac{\unicode[STIX]{x1D70C}_{p}V_{p}}{\unicode[STIX]{x1D70C}_{f}V_{m}}}{\displaystyle \frac{\text{d}\boldsymbol{u}_{p}^{n}}{\text{d}t}}S(\boldsymbol{x}^{n},\boldsymbol{x}^{m}), & \displaystyle\end{eqnarray}$$
 $$\begin{eqnarray}\displaystyle & \displaystyle q_{m}=-\mathop{\sum }_{n=1}^{n_{p}}{\displaystyle \frac{c_{p}\unicode[STIX]{x1D70C}_{p}V_{p}}{c_{f}\unicode[STIX]{x1D70C}_{f}V_{m}}}{\displaystyle \frac{\text{d}T_{p}^{n}}{\text{d}t}}S(\boldsymbol{x}^{n},\boldsymbol{x}^{m}), & \displaystyle\end{eqnarray}$$
where
 $\boldsymbol{f}_{m}$
and
 $q_{m}$
are respectively the feedback force and heat transfer rate to the Eulerian grid point
 $m$
from the particles within the control volume of fluid
 $V_{m}$
,
 $n_{p}$
is the total number of particles in the control volume,
 $V_{p}$
is the volume of particles,
 $\boldsymbol{u}_{p}^{n}$
and
 $T_{p}^{n}$
are the velocity and temperature of the
 $n$
th particle. The weight function
 $S(\boldsymbol{x}^{n},\boldsymbol{x}^{m})$
locally distributes the reverse effect of particle
 $n$
on the Eulerian grid
 $m$
using a fourth-order Lagrangian interpolation scheme. In order to satisfy the total kinetic energy conservation for the particle–fluid system, the interpolation scheme is also employed to evaluate the fluid velocity at the particle position (Sundaram & Collins Reference Sundaram and Collins1999).
In this work, the Eulerian–Lagrangian point-particle approach is used to simulate the particle-laden turbulent boundary layer flows. The particle trajectories are tracked individually through the integration of (2.4) by a second-order Crank–Nicolson scheme. The temperature, linear and angular velocities of the particles are integrated explicitly by a third-order Runge–Kutta scheme. After the turbulent velocity and temperature fields have been fully developed, a great number of particles are released randomly into the computational domain both inside and outside the boundary layer zone
 $(y\leqslant 20\unicode[STIX]{x1D703}_{in})$
and their initial velocities and temperatures are set equal to those of the local fluid at the centre of the particle. In order to keep the particle volume fraction constant, when one particle exits the domain from the outflow plane, another particle is randomly reinjected into the domain from the inflow plane. Particles moving outside the computational domain along the homogeneous spanwise direction are reintroduced via periodic boundary conditions. The height of the computational domain is large enough that no particles could pass through the top boundary. Particle–wall collisions are assumed when the particle centre is at a distance from the wall lower than one particle radius. In the present study, the hard sphere model is employed to deal with the particle–wall and particle–particle collisions (Yamamoto et al.
Reference Yamamoto, Potthoff, Tanaka, Kajishima and Tsuji2001). When collisions occur, the model described by Molerus (Reference Molerus1997) is used to calculate the inter-particle and particle–wall heat transfer.
One of the most important parameters that controls the dynamics of inertial particles is the particle Stokes number
 $St=\unicode[STIX]{x1D70F}_{p}/\unicode[STIX]{x1D70F}_{f}$
, where
 $\unicode[STIX]{x1D70F}_{p}=\unicode[STIX]{x1D70C}_{p}d_{p}^{2}/(18\unicode[STIX]{x1D707})$
is the particle aerodynamic response time and
 $\unicode[STIX]{x1D70F}_{f}=\unicode[STIX]{x1D703}_{in}/U_{\infty }$
is the characteristic time scale of the fluid. Similarly, the particle thermal Stokes number, defined as
 $St_{T}=\unicode[STIX]{x1D70F}_{T}/\unicode[STIX]{x1D70F}_{f}$
, is also an important parameter for the heat transfer of particle-laden turbulent flow, where
 $\unicode[STIX]{x1D70F}_{T}=\unicode[STIX]{x1D70C}_{p}c_{p}d_{p}^{2}/(12k_{f})$
is the particle thermal response time. In order to investigate the effects of particles on turbulent flow and heat transfer in a spatially developing flat-plate boundary layer, the particle populations characterized by different Stokes numbers are considered. Since the physical problem investigated in this study is the dispersion of coal particles in air, the thermal Stokes number
 $St_{T}$
is approximately equal to the particle Stokes number
 $St$
. Table 1 reports the parameters of the tracked particles in the present simulations. The minimum grid spacing is larger than the diameter of the particles, while it is smaller than the minimum Kolmogorov length scale, i.e.
 $d_{p}<\unicode[STIX]{x0394}y_{min}<\unicode[STIX]{x1D702}_{min}$
. Therefore, it satisfies the requirements imposed by the point-particle DNS approach (Portela & Oliemans Reference Portela and Oliemans2003).
The simulations were performed using 1024 processors on 64 IBM 16-way nodes based on a two-way coupled Eulerian–Lagrangian point-particle algorithm, which has been previously used in DNS of isothermal particle-laden turbulent flows in a spatially developing flat-plate boundary layer (Li et al.
Reference Li, Luo and Fan2016b
). The number of processors allocated was
 $256\times 1\times 4$
along the
 $x$
,
 $y$
and
 $z$
directions, respectively. The dimensionless computational time step in wall units,
 $\unicode[STIX]{x0394}t^{+}=0.11$
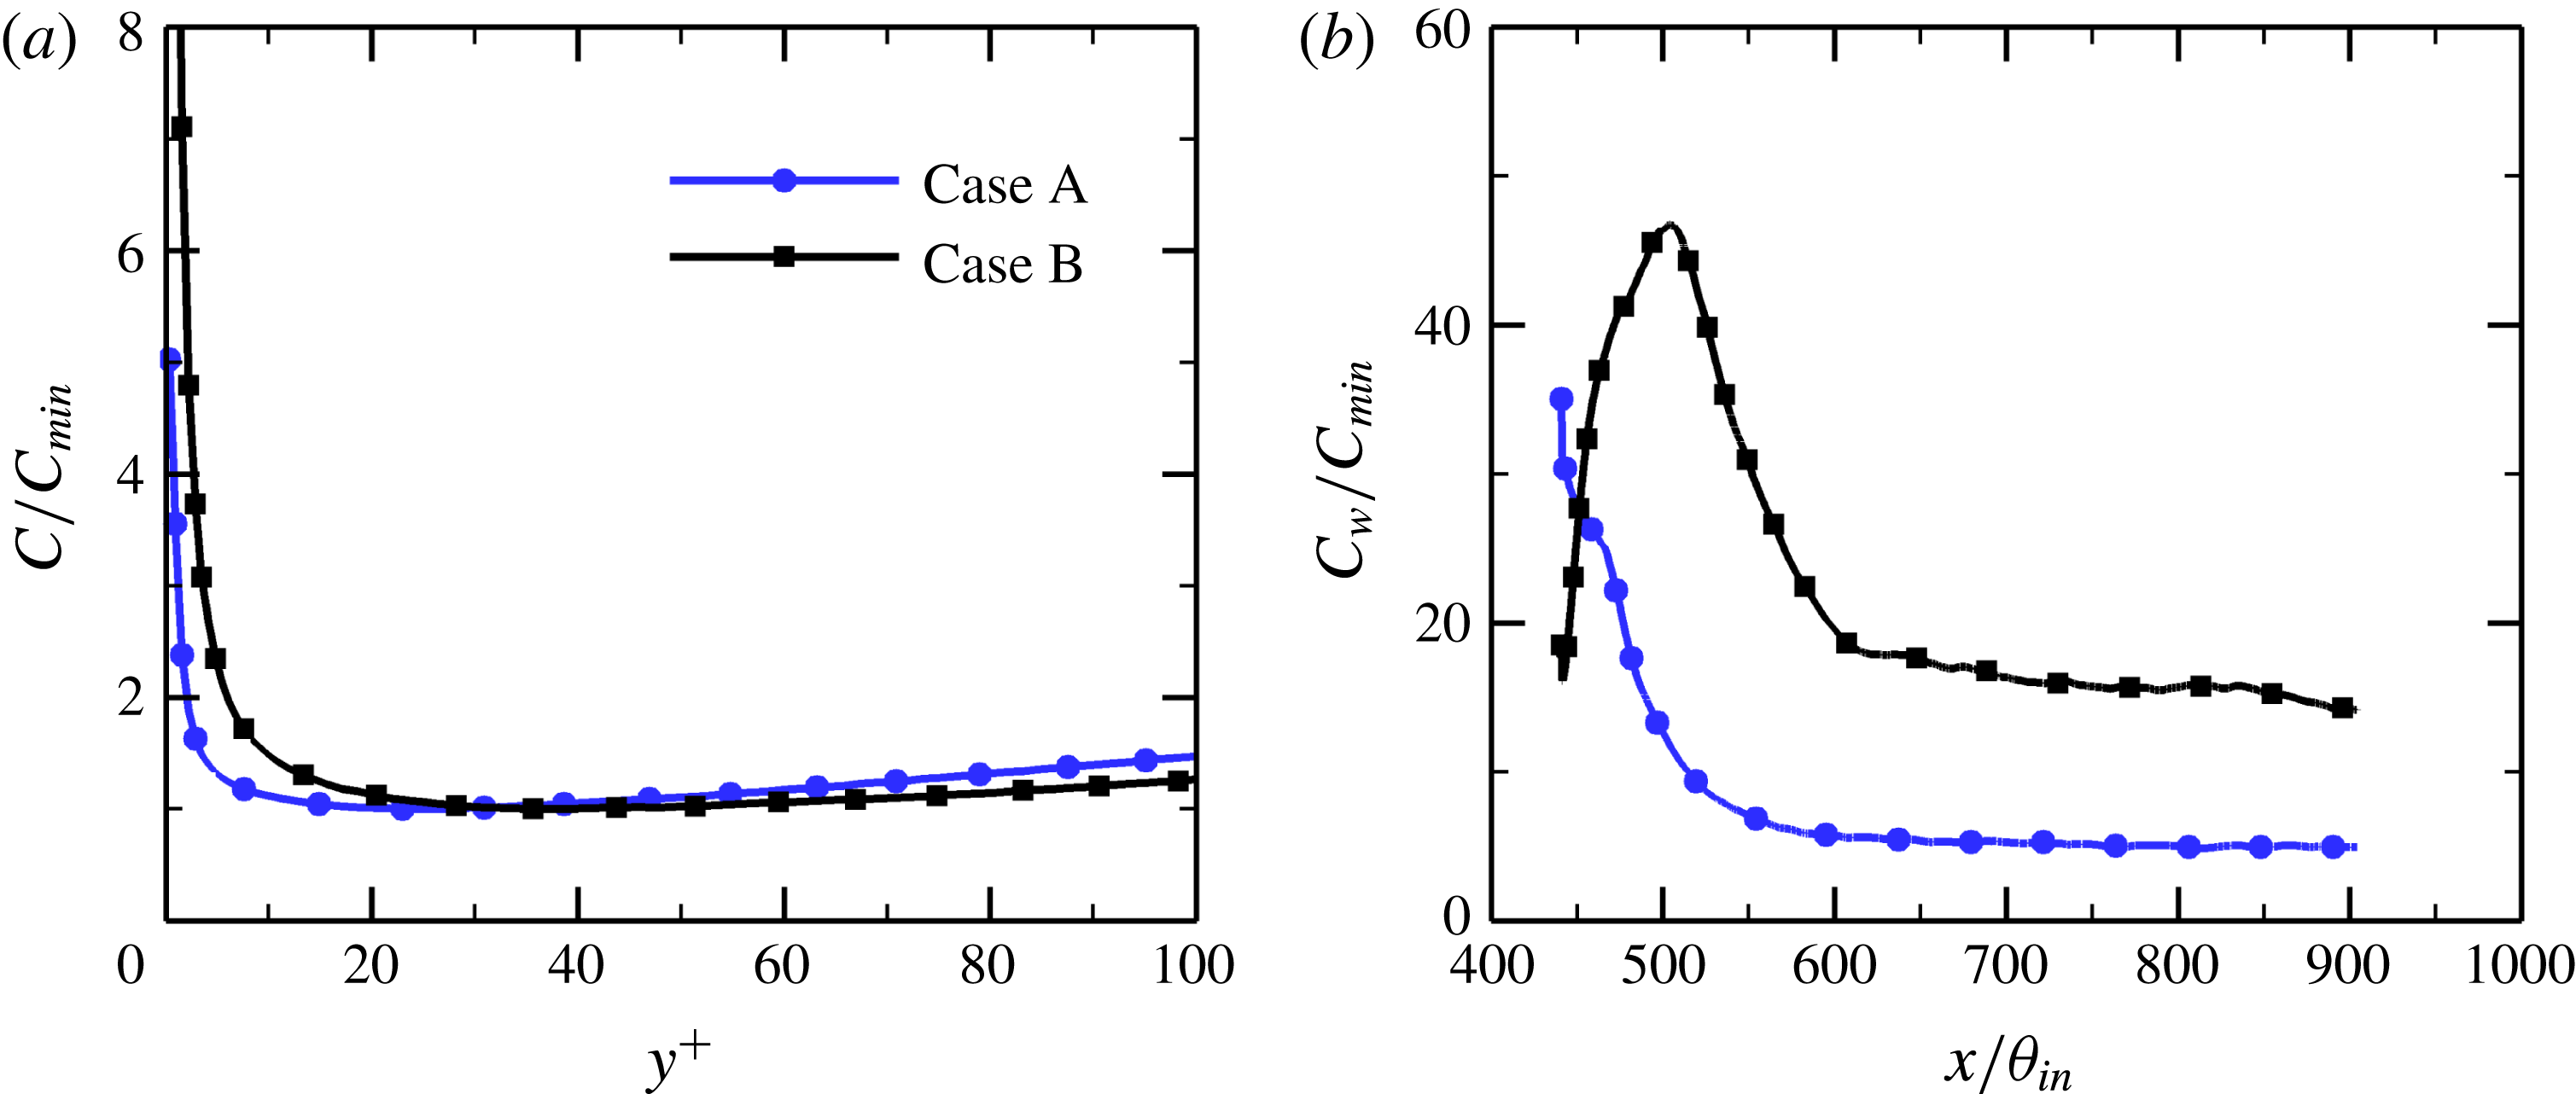
, was small enough that particles and fluid elements cannot travel more than half a grid cell per iterative step. The velocity, temperature and particle concentration fields reached statistically quasi-steady state after
 $70\,000\unicode[STIX]{x0394}t$
, as shown in figure 2. We then collected statistics for another
 $60\,000\unicode[STIX]{x0394}t$
. All statistical results have been averaged over time and over the homogeneous spanwise direction.
Parameters of the tracked particles in the particle-laden turbulent thermal boundary layers, where
 $N_{p}$
is the total number of particles in the computational domain.

(a) Wall-normal profiles of the particle concentration
 $C$
, normalized by its local minimum value
 $C_{min}$
, versus the inner wall coordinate
 $y^{+}$
at the streamwise station
 $x=828\unicode[STIX]{x1D703}_{in}$
; (b) particle concentration at the wall
 $C_{w}$
versus the streamwise coordinate
 $x/\unicode[STIX]{x1D703}_{in}$
, where
 $C_{w}$
is defined as the number of particles within the grid cell closest to the wall.

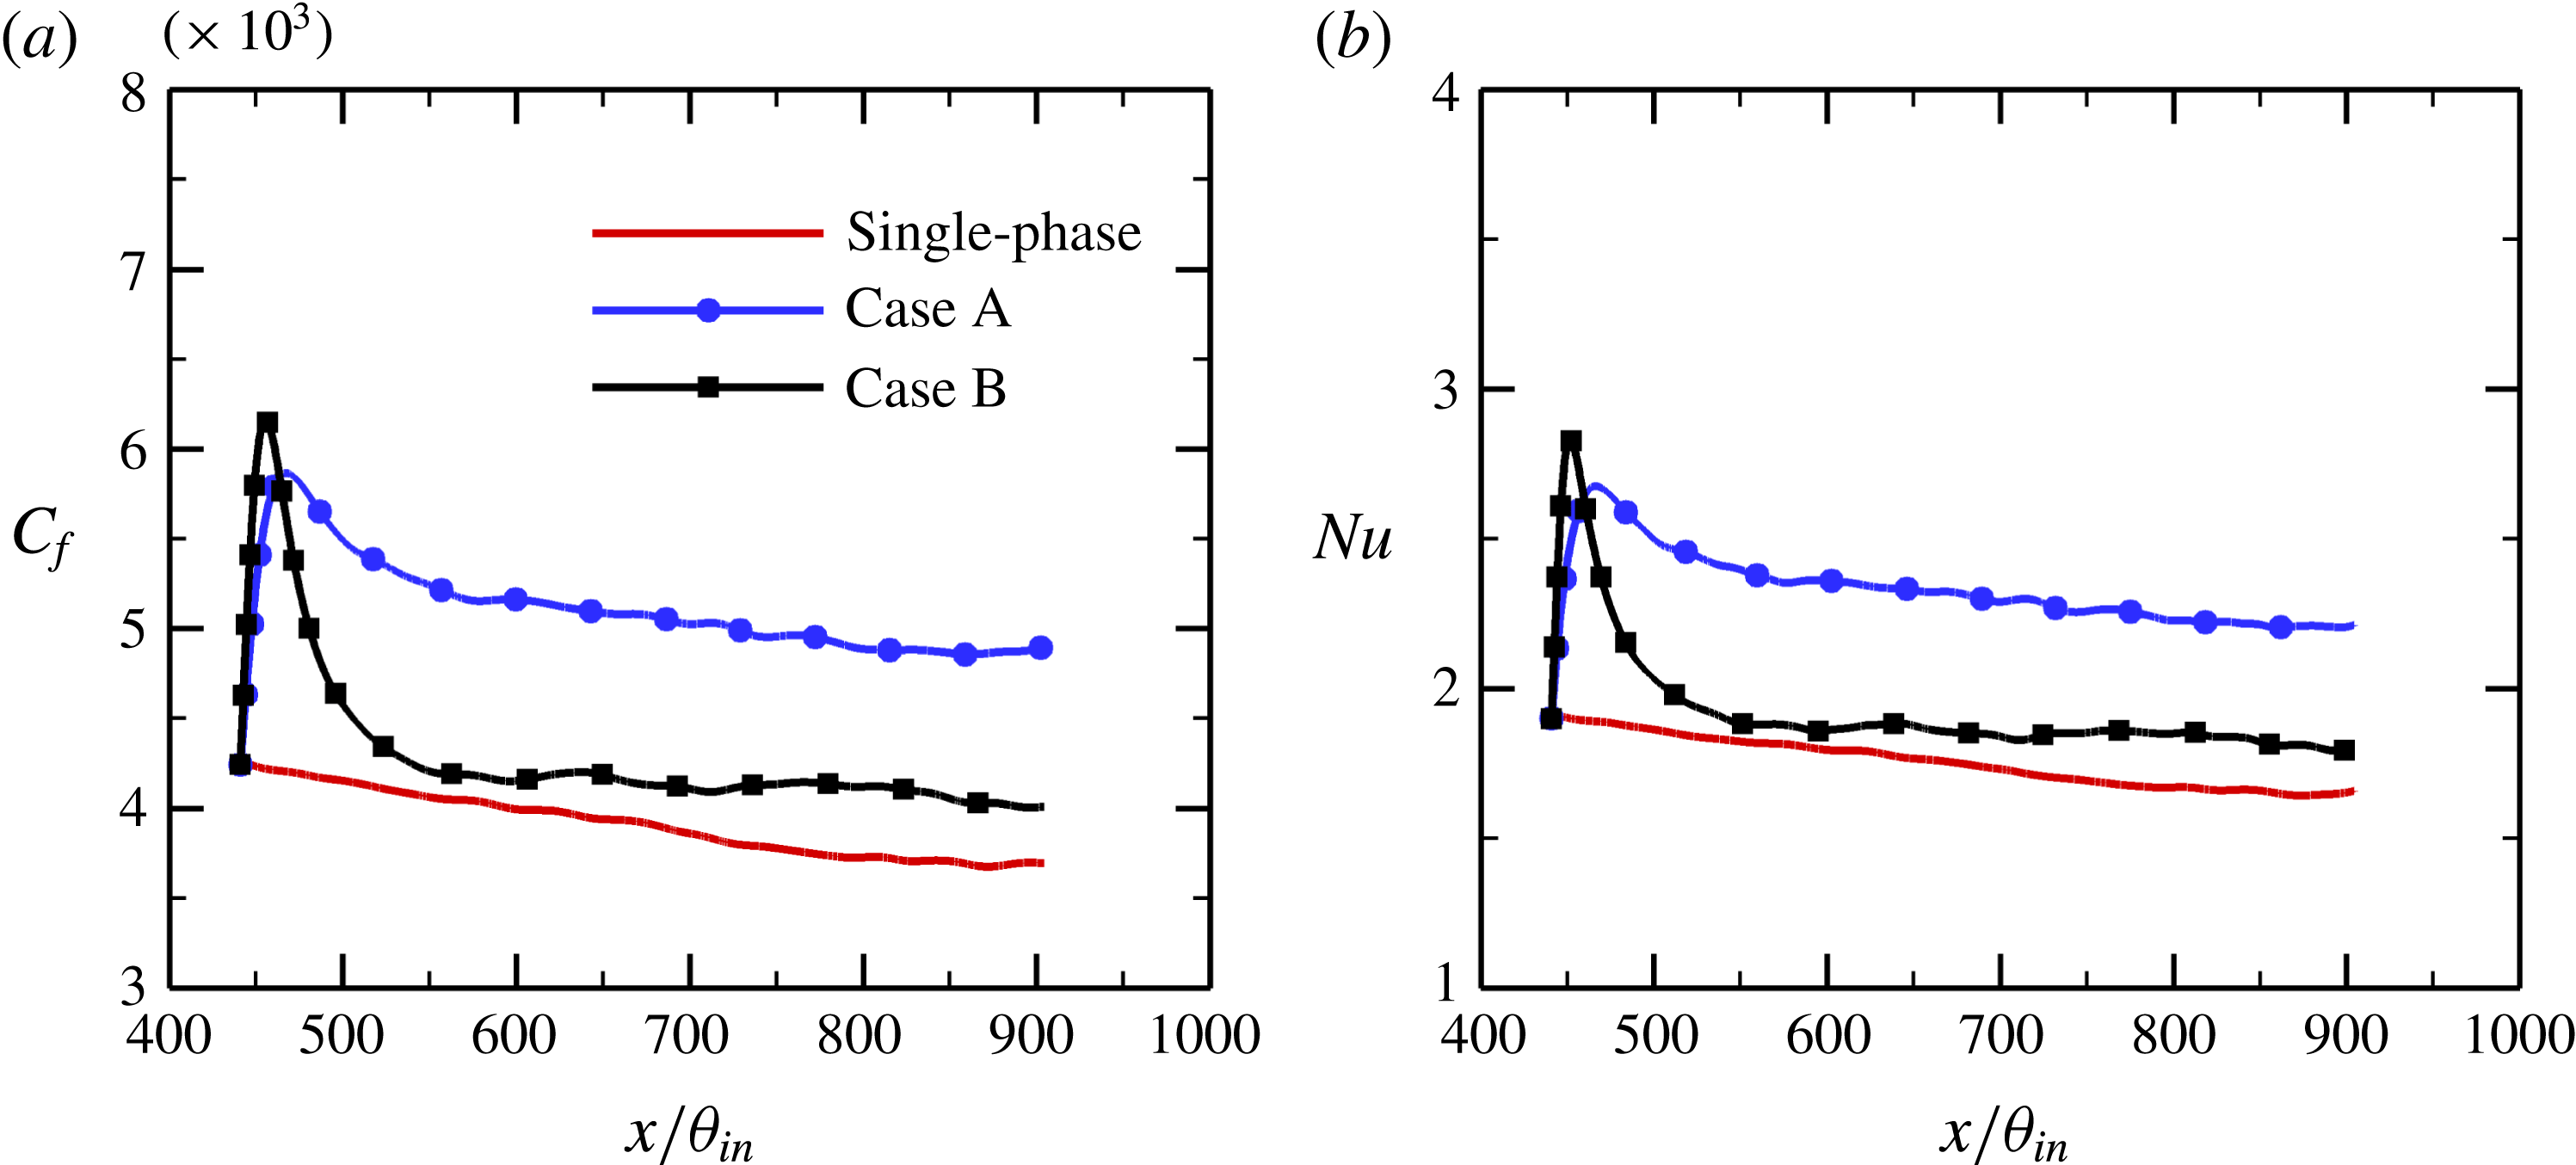
Evolution of (a) the mean skin-friction coefficient
 $C_{f}$
and (b) the Nusselt number
 $Nu$
with the streamwise coordinate
 $x/\unicode[STIX]{x1D703}_{in}$
along the flat plate.

3 Turbulence statistics
3.1 Global statistics
Figure 3 shows the evolution of the mean skin-friction coefficient
 $C_{f}$
and the Nusselt number
 $Nu$
along the flat plate with the streamwise coordinate
 $x/\unicode[STIX]{x1D703}_{in}$
, where
 $C_{f}$
and
 $Nu$
are defined as
 $$\begin{eqnarray}\displaystyle & \displaystyle C_{f}={\displaystyle \frac{\unicode[STIX]{x1D70F}_{w}}{1/2\unicode[STIX]{x1D70C}_{f}U_{\infty }^{2}}}, & \displaystyle\end{eqnarray}$$
 $$\begin{eqnarray}\displaystyle & \displaystyle Nu={\displaystyle \frac{h\unicode[STIX]{x1D703}_{in}}{k_{f}}}, & \displaystyle\end{eqnarray}$$
where
 $\unicode[STIX]{x1D70F}_{w}=\unicode[STIX]{x1D707}\unicode[STIX]{x2202}\bar{u}/\unicode[STIX]{x2202}y|_{y=0}$
is the mean wall shear stress and
 $h$
is the convective heat transfer coefficient. The numerical results for the single-phase flow, which have been validated in our recent study (Li et al.
Reference Li, Luo and Fan2016a
), are also included in this figure for a quantitative comparison. It is evident that both
 $C_{f}$
and
 $Nu$
are substantially increased in the particle-laden flows with respect to the single-phase flow, indicating that the skin-friction drag and heat transfer are enhanced under the effect of inertial particles.
As is well known, the skin-friction coefficient
 $C_{f}$
is considered to be an excellent scalar indicator to identify the state of boundary layer flows, i.e. the laminar, transitional and turbulent regions. The locations at which the local minimum and maximum of
 $C_{f}$
occur correspond approximately to the locations of the onset and completion of the transitional region, respectively (Jacobs & Durbin Reference Jacobs and Durbin2001). Although a realistic fully developed turbulent inflow is specified at the inlet, the addition of particles produces a remarkable change in the flow state. It is found that the ‘turbulence’ supplied at the inflow plane from the auxiliary simulation decays due to the strong disturbance caused by particles and the flow undergoes a return transition to turbulence within a long distance downstream of the inlet, at least approximately 100 initial momentum thicknesses. This means that a large streamwise length is needed to perform a DNS of particle-laden turbulent boundary layer, in order to eliminate the influence of upstream boundary conditions and allow turbulence to develop sufficiently. Hereinafter, most of the turbulence statistics will be sampled at the streamwise location
 $x=828\unicode[STIX]{x1D703}_{in}$
(corresponding to
 $Re_{\unicode[STIX]{x1D703}}=1840$
in the single-phase flow). This location is chosen to be as far downstream as possible without being affected by the inflow boundary condition and to avoid any interactions with the outflow boundary condition. The flow reached a fully turbulent state at this location. In the fully developed turbulent region, the particles in case A with smaller Stokes number
 $St=1$
seem to have stronger effects on the skin-friction coefficient and Nusselt number than the larger particles in case B with
 $St=5$
.
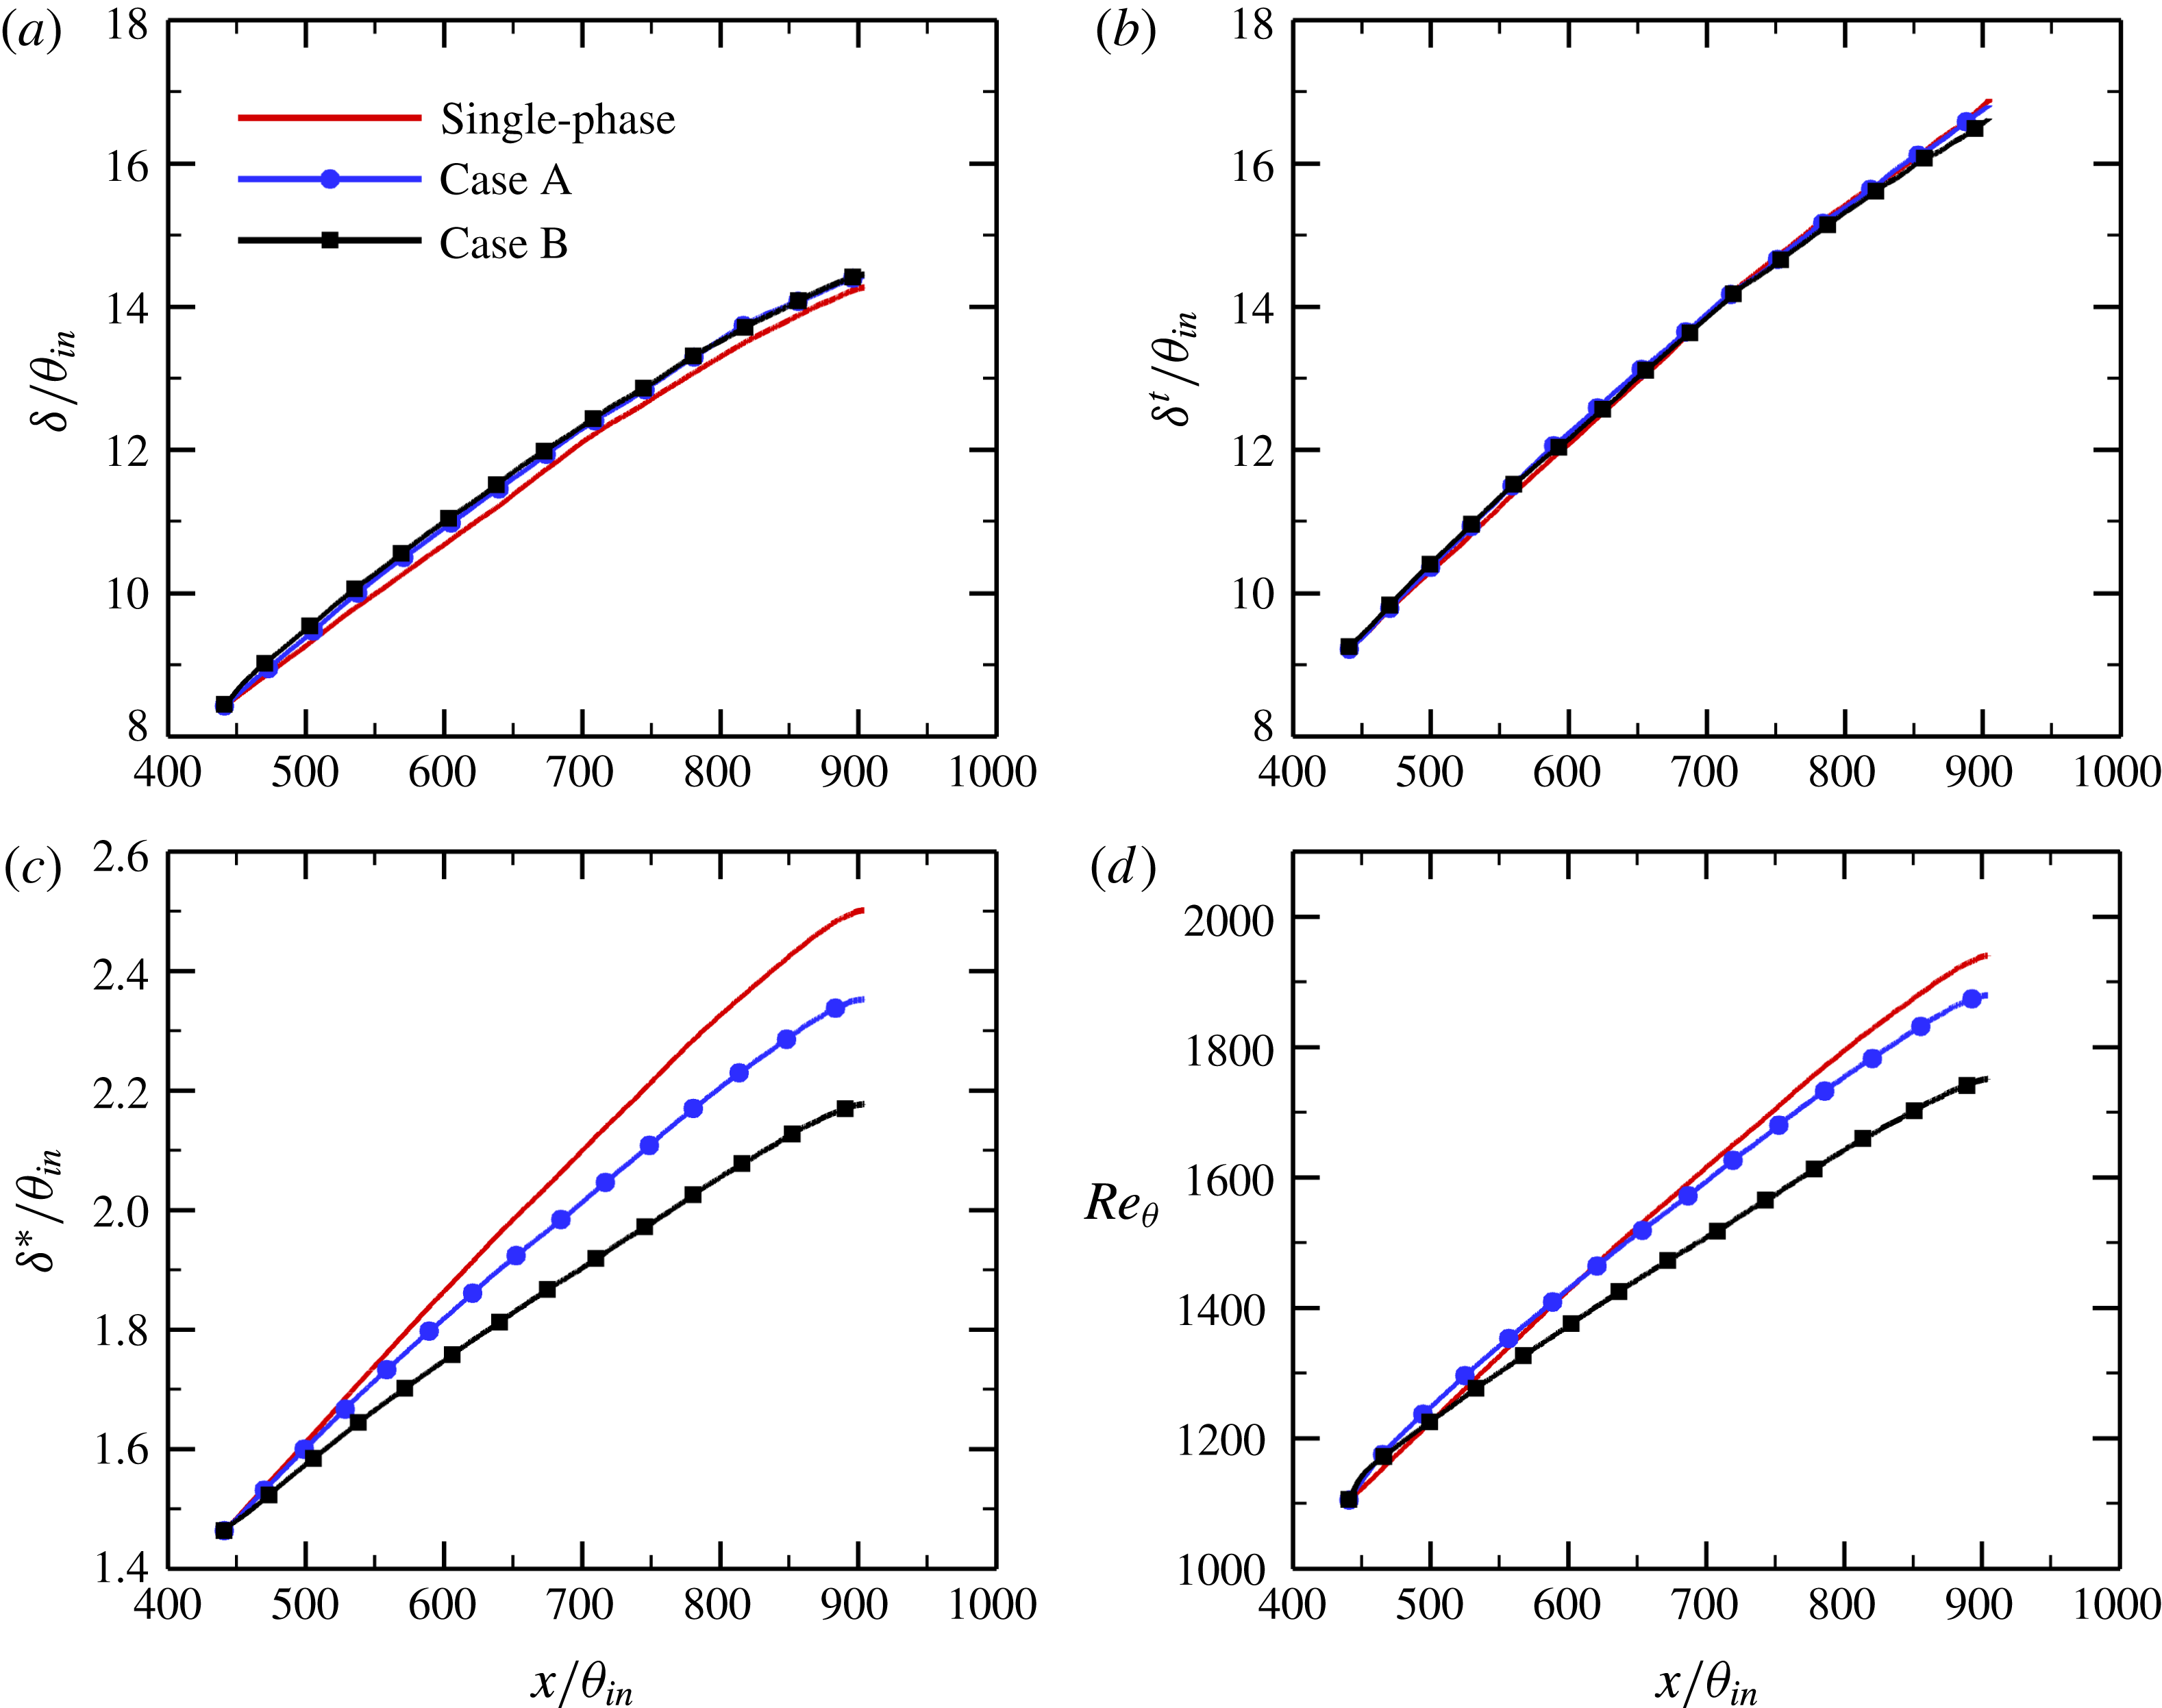
Different from channel or pipe flows in which periodicity is assumed along the flow direction, the turbulent boundary layer flow over a flat plate develops spatially along the streamwise direction. To assess the effect of particles on boundary layer development, figure 4 reports the variations of the boundary layer global and integral parameters along the flat plate, including the velocity boundary layer thickness
 $\unicode[STIX]{x1D6FF}$
, the thermal boundary layer thickness
 $\unicode[STIX]{x1D6FF}^{t}$
, the displacement thickness
 $\unicode[STIX]{x1D6FF}^{\ast }$
and the momentum thickness Reynolds number
 $Re_{\unicode[STIX]{x1D703}}=U_{\infty }\unicode[STIX]{x1D703}/\unicode[STIX]{x1D708}$
, where
 $\unicode[STIX]{x1D6FF}$
and
 $\unicode[STIX]{x1D6FF}^{t}$
are defined based on 99 % of the free-stream velocity and free-stream temperature, respectively. The displacement and momentum thicknesses are expressed as
 $$\begin{eqnarray}\displaystyle & \displaystyle \unicode[STIX]{x1D6FF}^{\ast }=\int _{0}^{\unicode[STIX]{x1D6FF}}(1-\bar{u})\,\text{d}y, & \displaystyle\end{eqnarray}$$
 $$\begin{eqnarray}\displaystyle & \displaystyle \unicode[STIX]{x1D703}=\int _{0}^{\unicode[STIX]{x1D6FF}}\bar{u}(1-\bar{u})\,\text{d}y, & \displaystyle\end{eqnarray}$$
where
 $\bar{u}$
is the mean streamwise fluid velocity. In the particle-laden turbulent boundary layers at moderate Reynolds numbers,
 $1100\leqslant Re_{\unicode[STIX]{x1D703}}\leqslant 1940$
, the velocity boundary layer thickness
 $\unicode[STIX]{x1D6FF}$
is slightly increased compared with the unladen flow, which is exactly opposite to our previous numerical results in a low-Reynolds-number turbulent boundary layer laden with small particles (Li et al.
Reference Li, Luo and Fan2016b
). In addition, the particles have an almost negligible effect on the thermal boundary layer thickness, irrespective of particle Stokes number, as shown in figure 4(b). However, the presence of inertial particles significantly reduces the displacement thickness
 $\unicode[STIX]{x1D6FF}^{\ast }$
and the momentum thickness Reynolds number
 $Re_{\unicode[STIX]{x1D703}}$
in the fully developed turbulent region, and the levels of reduction increase with particle Stokes number. This is due to the fact that the velocity and thermal boundary layer thicknesses are much more sensitive to inflow condition than the integral boundary layer thicknesses, i.e.
 $\unicode[STIX]{x1D6FF}^{\ast }$
and
 $\unicode[STIX]{x1D703}$
. Therefore, it is more effective to use the boundary layer integral parameters to examine the turbulence modulation by particles.
Variations of boundary layer global and integral parameters with
 $x/\unicode[STIX]{x1D703}_{in}$
: (a) velocity boundary layer thickness
 $\unicode[STIX]{x1D6FF}$
; (b) thermal boundary layer thickness
 $\unicode[STIX]{x1D6FF}^{t}$
; (c) displacement thickness
 $\unicode[STIX]{x1D6FF}^{\ast }$
; (d) momentum thickness Reynolds number
 $Re_{\unicode[STIX]{x1D703}}$
.

As mentioned above, the displacement thickness
 $\unicode[STIX]{x1D6FF}^{\ast }$
and the momentum thickness
 $\unicode[STIX]{x1D703}$
decrease monotonically with increasing particle Stokes number
 $St$
in the particle-laden flows. The fact that the shape factor,
 $H_{12}=\unicode[STIX]{x1D6FF}^{\ast }/\unicode[STIX]{x1D703}$
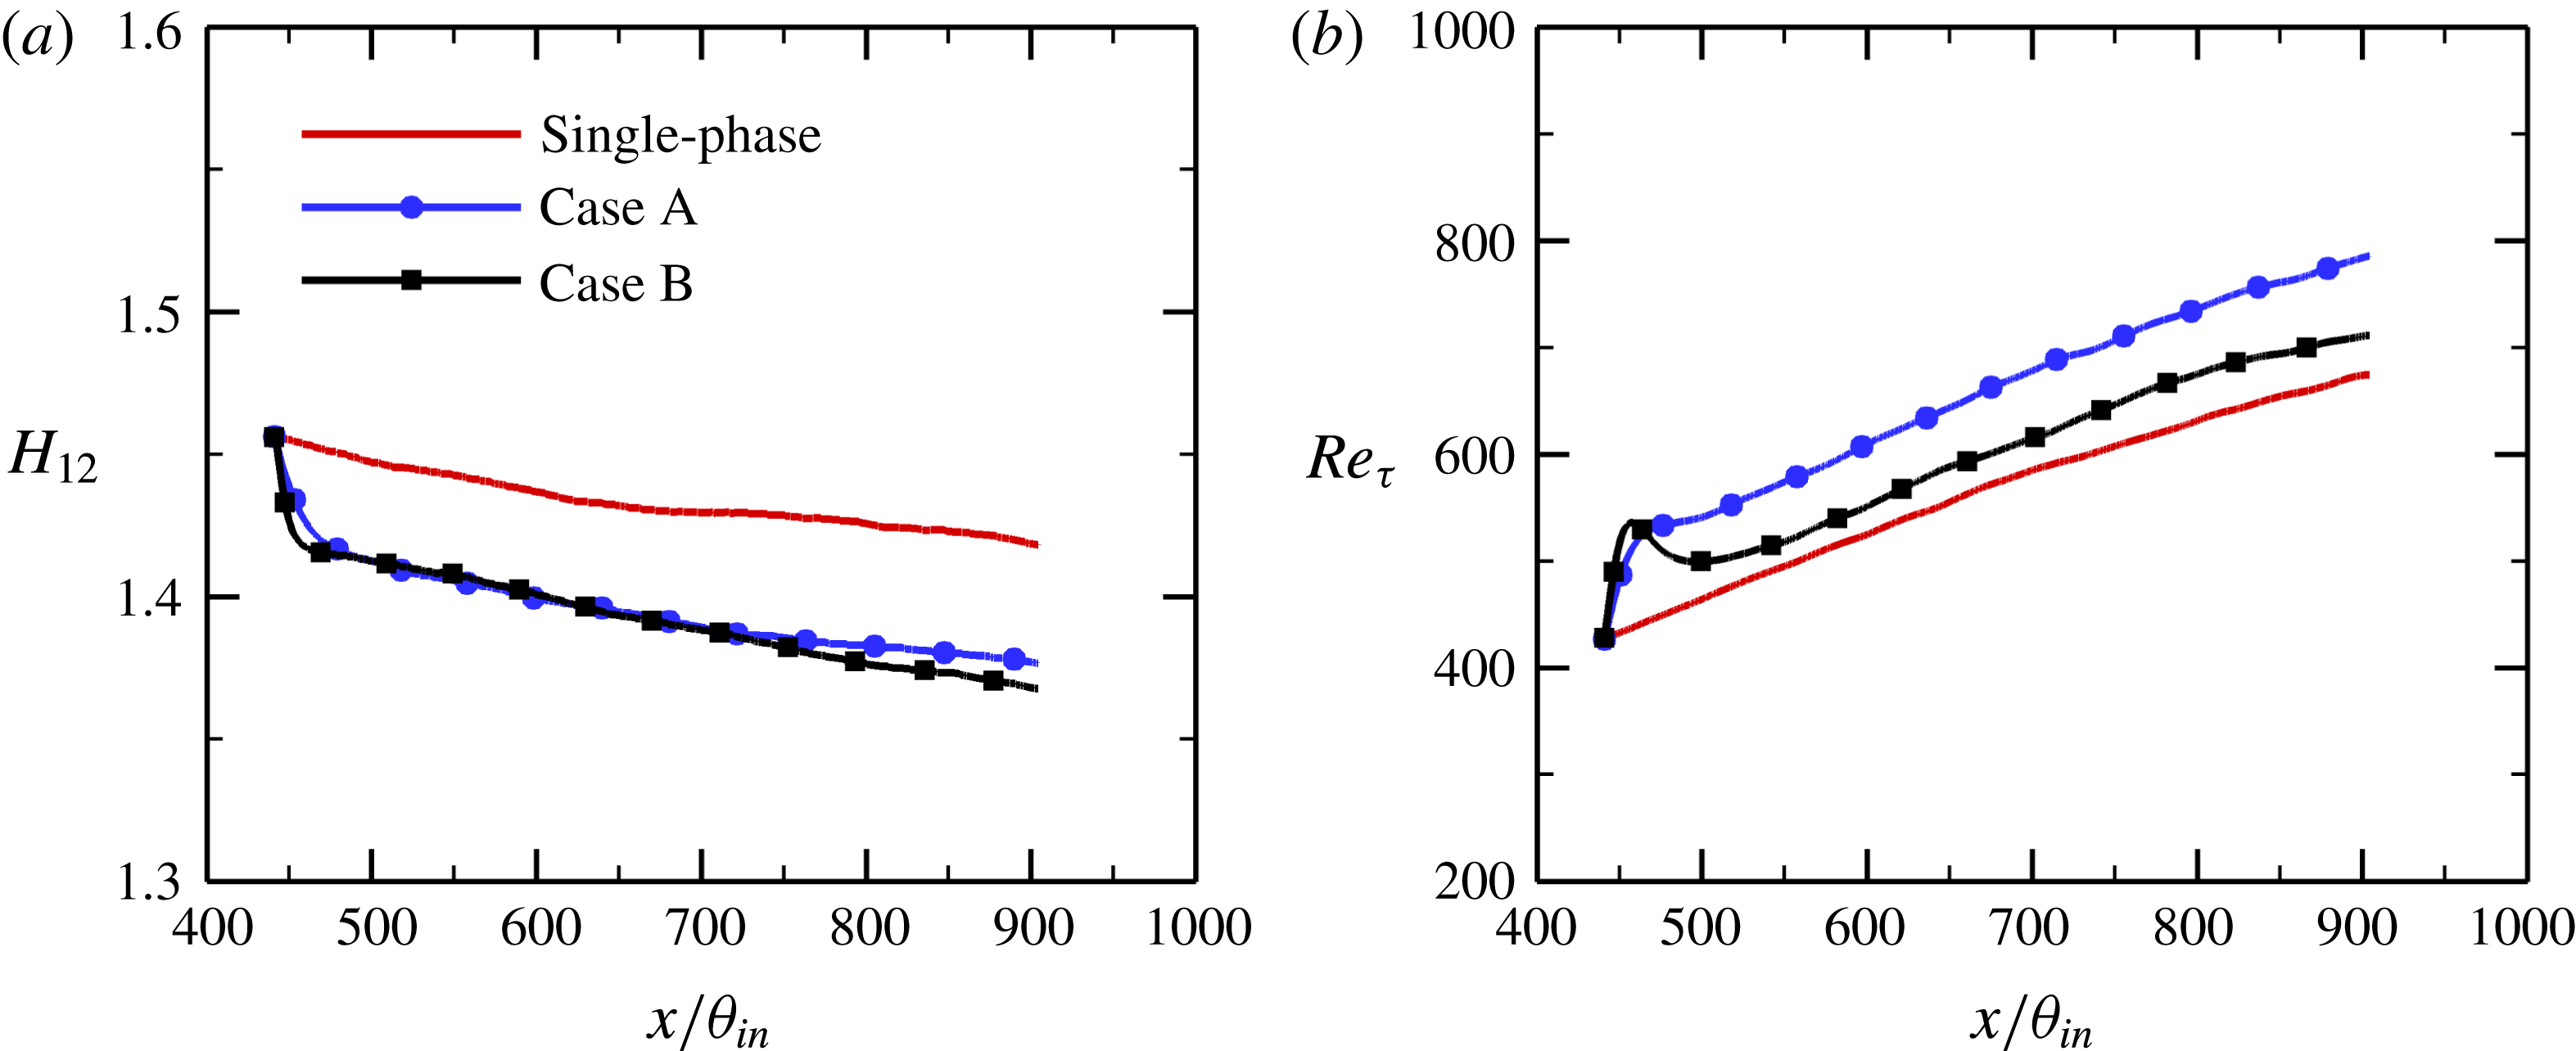
, is substantially reduced under the effect of particles, as shown in figure 5(a), indicates that the inertial solid particles have a more pronounced effect on the displacement thickness than on the momentum thickness. Figure 5(b) shows the streamwise development of the friction Reynolds number,
 $Re_{\unicode[STIX]{x1D70F}}=u_{\unicode[STIX]{x1D70F}}\unicode[STIX]{x1D6FF}/\unicode[STIX]{x1D708}$
, the ratio of the boundary layer thickness
 $\unicode[STIX]{x1D6FF}$
to the viscous length scale
 $\unicode[STIX]{x1D708}/u_{\unicode[STIX]{x1D70F}}$
. It can be observed that the presence of particles increases the friction Reynolds number across the entire streamwise extent of the computational domain. Considering that the boundary layer thickness is slightly increased in the particle-laden flows (figure 4
a), the increase in
 $Re_{\unicode[STIX]{x1D70F}}$
can be explained in terms of the increase in the wall-friction velocity
 $u_{\unicode[STIX]{x1D70F}}$
, as shown in figure 3(a). In other words, the addition of small particles leads to a reduction in the inner length scale of the boundary layer
 $\unicode[STIX]{x1D708}/u_{\unicode[STIX]{x1D70F}}$
. In accordance with the variation of the wall-friction velocity
 $u_{\unicode[STIX]{x1D70F}}$
(or
 $C_{f}$
), the smaller particles with
 $St=1$
have a greater effect on the friction Reynolds number than the larger ones with
 $St=5$
in the fully developed turbulent region.
3.2 Mean and fluctuating statistics
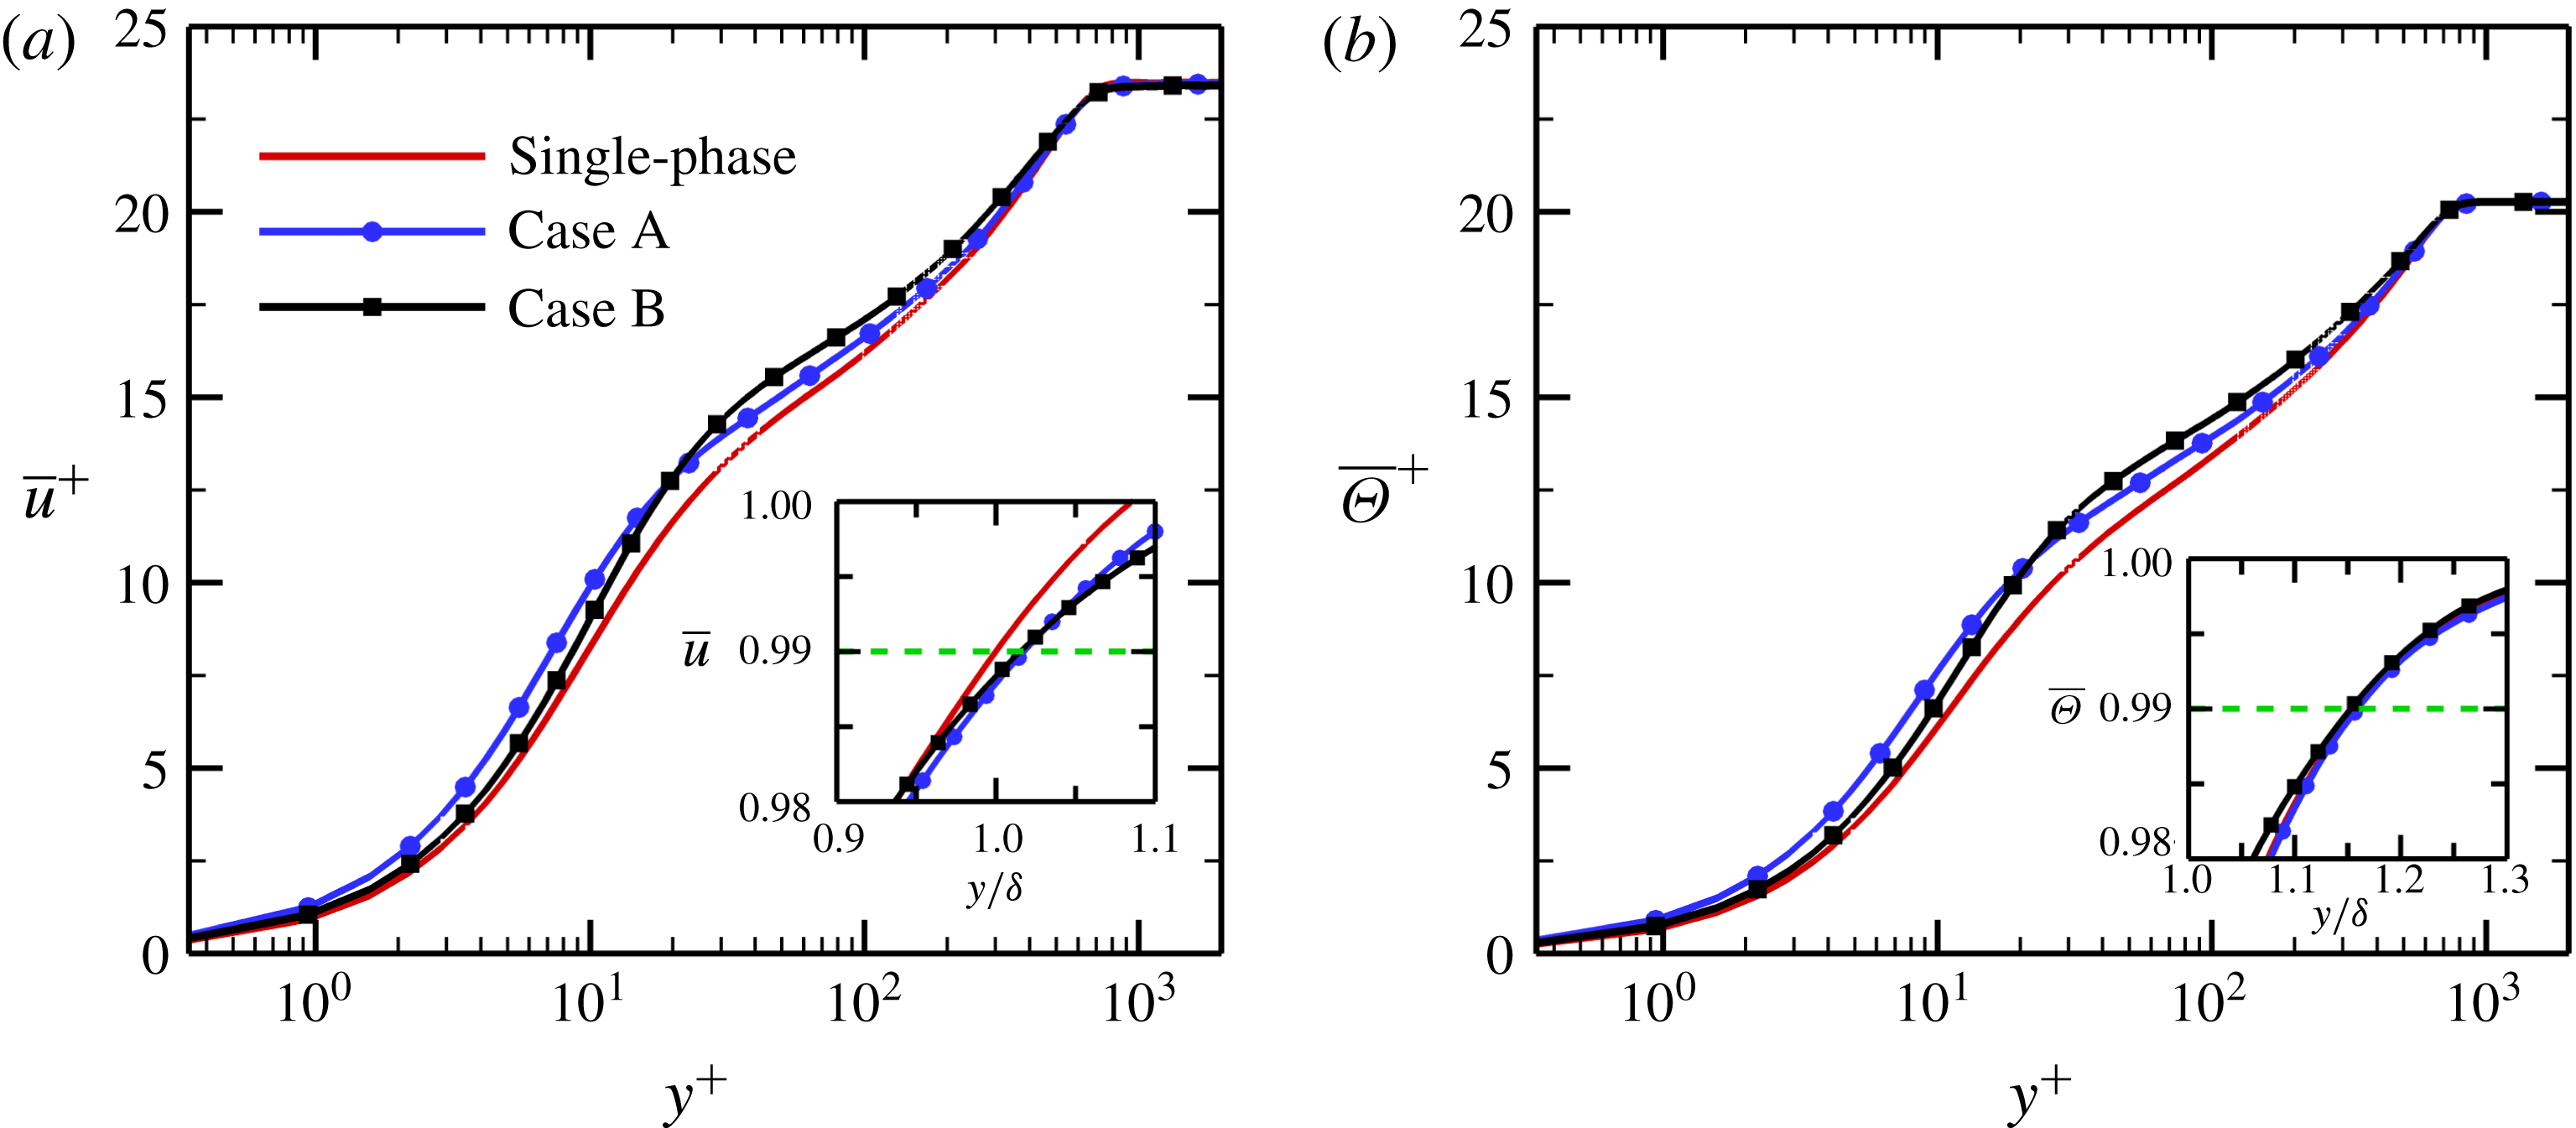
Figure 6 shows the mean streamwise fluid velocity
 $\bar{u}^{+}$
and the mean fluid temperature
 $\bar{\unicode[STIX]{x1D6E9}}^{+}$
versus the inner wall coordinate
 $y^{+}$
at the streamwise location
 $x=828\unicode[STIX]{x1D703}_{in}$
. Here,
 $\bar{u}^{+}$
and
 $\bar{\unicode[STIX]{x1D6E9}}^{+}$
are normalized by the friction velocity
 $u_{\unicode[STIX]{x1D70F}}$
and the friction temperature
 $\unicode[STIX]{x1D6E9}_{\unicode[STIX]{x1D70F}}=q_{w}/(\unicode[STIX]{x1D70C}_{f}c_{f}u_{\unicode[STIX]{x1D70F}})$
, where
 $q_{w}=-k_{f}\unicode[STIX]{x2202}\bar{\unicode[STIX]{x1D6E9}}/\unicode[STIX]{x2202}y|_{w}$
is the wall heat flux. With respect to the single-phase flow, the mean streamwise velocity
 $\bar{u}^{+}$
and the mean temperature
 $\bar{\unicode[STIX]{x1D6E9}}^{+}$
are obviously increased in the particle-laden flows. In the near-wall region with
 $y^{+}<20$
, these effects become more pronounced for smaller particles with
 $St=1$
. However, the reverse is true in the outer layer; that is,
 $\bar{u}^{+}$
and
 $\bar{\unicode[STIX]{x1D6E9}}^{+}$
increase monotonically with increasing particle Stokes number. It is important to point out that in this study, the higher the dimensionless temperature
 $\unicode[STIX]{x1D6E9}$
is, the lower the real temperature
 $T$
is, due to the fact that the wall temperature
 $T_{w}$
is larger than the free-stream temperature
 $T_{\infty }$
. Thus, the mean temperature of the real fluid
 $\bar{T}$
is reduced in the presence of particles. The increase in the mean streamwise velocity leads to significant reductions in the displacement and momentum thicknesses, as shown in figure 4(c,d). One may ask why the velocity and thermal boundary layer thicknesses are not reduced under the effect of the particles. In fact, the presence of particles produces a slight decrease in the mean streamwise velocity
 $\bar{u}$
near the edge of the boundary layer, as shown in the inset of figure 6(a) where
 $\bar{u}$
is plotted using the outer wall coordinate
 $y/\unicode[STIX]{x1D6FF}$
. As a result, the velocity boundary layer thickness
 $\unicode[STIX]{x1D6FF}$
is slightly increased in the particle-laden flows.
Variations of (a) the shape factor
 $H_{12}$
and (b) the friction Reynolds number
 $Re_{\unicode[STIX]{x1D70F}}$
with
 $x/\unicode[STIX]{x1D703}_{in}$
.

(a) Mean streamwise velocity
 $\bar{u}^{+}$
and (b) mean temperature
 $\bar{\unicode[STIX]{x1D6E9}}^{+}$
of the fluid phase versus the inner wall coordinate
 $y^{+}$
at the streamwise location
 $x=828\unicode[STIX]{x1D703}_{in}$
.

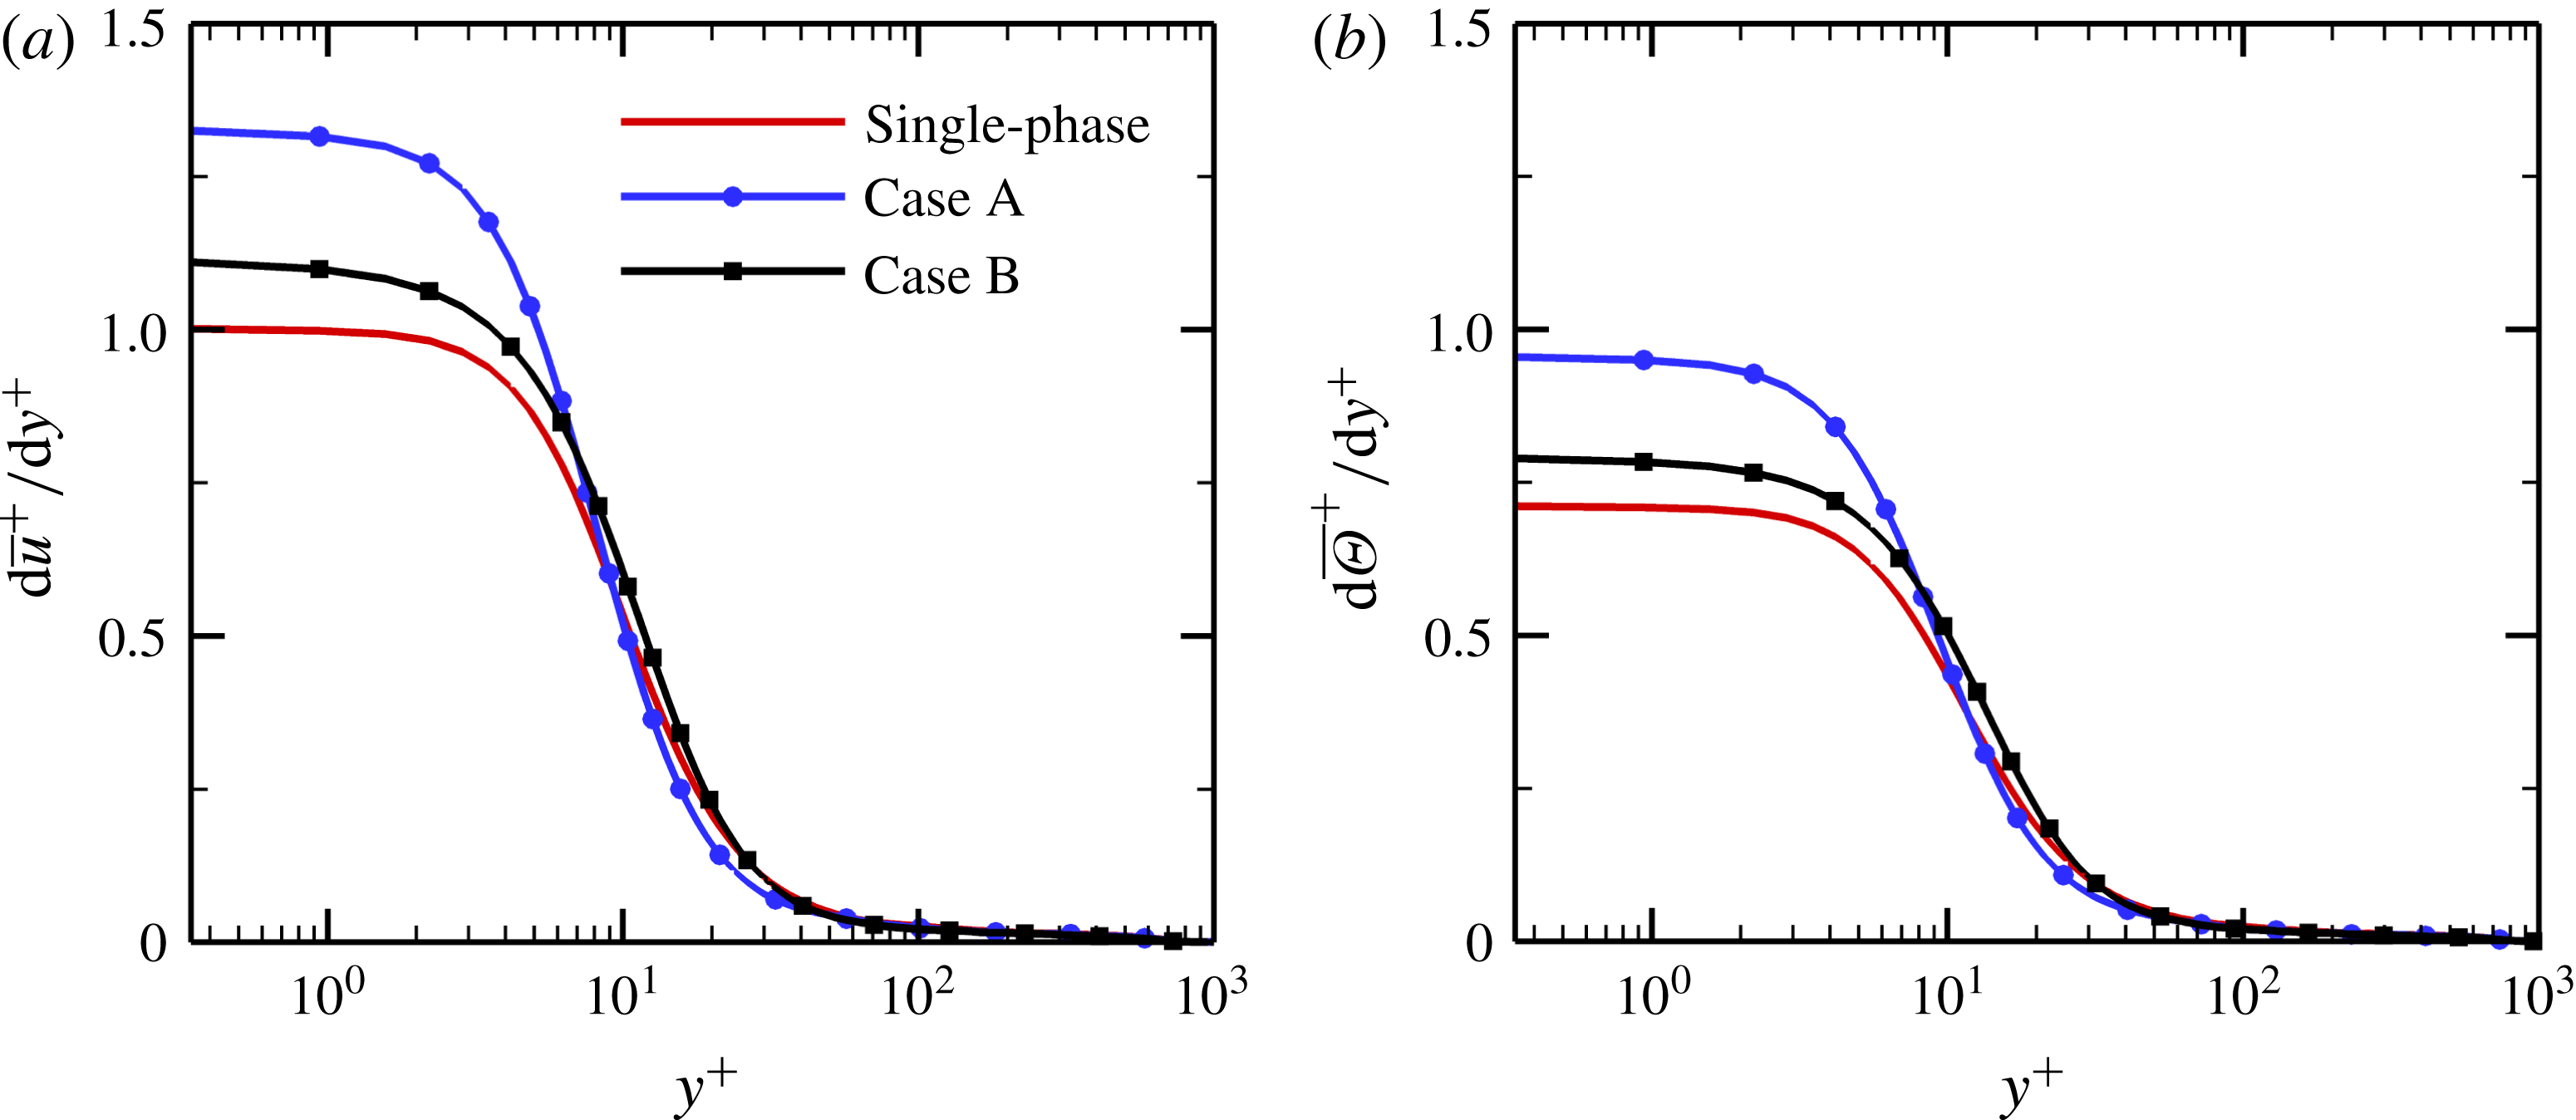
In order to explain the reason for the increases in the mean skin-friction coefficient and Nusselt number in the particle-laden flows, we firstly examine the effects of inertial particles on the mean fluid velocity and temperature gradients in figure 7. As expected, both the velocity gradient
 $\text{d}\bar{u}^{+}/\text{d}y^{+}$
and the temperature gradient
 $\text{d}\bar{\unicode[STIX]{x1D6E9}}^{+}/\text{d}y^{+}$
are substantially increased in the vicinity of the wall, which leads to large increases in
 $C_{f}$
and
 $Nu$
(figure 3). It should be pointed out that although the near-wall temperature gradient is increased in the particle-laden flows, the fluid temperature gradient is reduced in the outer region of the boundary layer. As a result, the thermal boundary layer thickness is nearly unchanged under the effect of the particles (figure 4
b). The physical mechanisms responsible for the enhancements of the skin-friction drag and heat transfer will be investigated in detail in § 5.
(a) Mean streamwise velocity gradient
 $\text{d}\bar{u}^{+}/\text{d}y^{+}$
and (b) mean temperature gradient
 $\text{d}\bar{\unicode[STIX]{x1D6E9}}^{+}/\text{d}y^{+}$
versus the inner wall coordinate
 $y^{+}$
at
 $x=828\unicode[STIX]{x1D703}_{in}$
.

Turbulence intensities and temperature fluctuations for the fluid phase in inner wall units at
 $x=828\unicode[STIX]{x1D703}_{in}$
: (a) streamwise turbulence intensity
 $u_{rms}^{\prime +}$
; (b) temperature fluctuations
 $\unicode[STIX]{x1D6E9}_{rms}^{\prime +}$
; (c) wall-normal turbulence intensity
 $v_{rms}^{\prime +}$
; (d) spanwise turbulence intensity
 $w_{rms}^{\prime +}$
.

Wall-normal distributions of (a) the streamwise heat flux
 $\overline{u^{\prime }\unicode[STIX]{x1D6E9}^{\prime }}^{+}$
; (b) the wall-normal heat flux
 $-\overline{v^{\prime }\unicode[STIX]{x1D6E9}^{\prime }}^{+}$
; (c) the Reynolds shear stress
 $-\overline{u^{\prime }v^{\prime }}^{+}$
and (d) the turbulent Prandtl number
 $Pr_{t}$
in inner wall units at
 $x=828\unicode[STIX]{x1D703}_{in}$
.

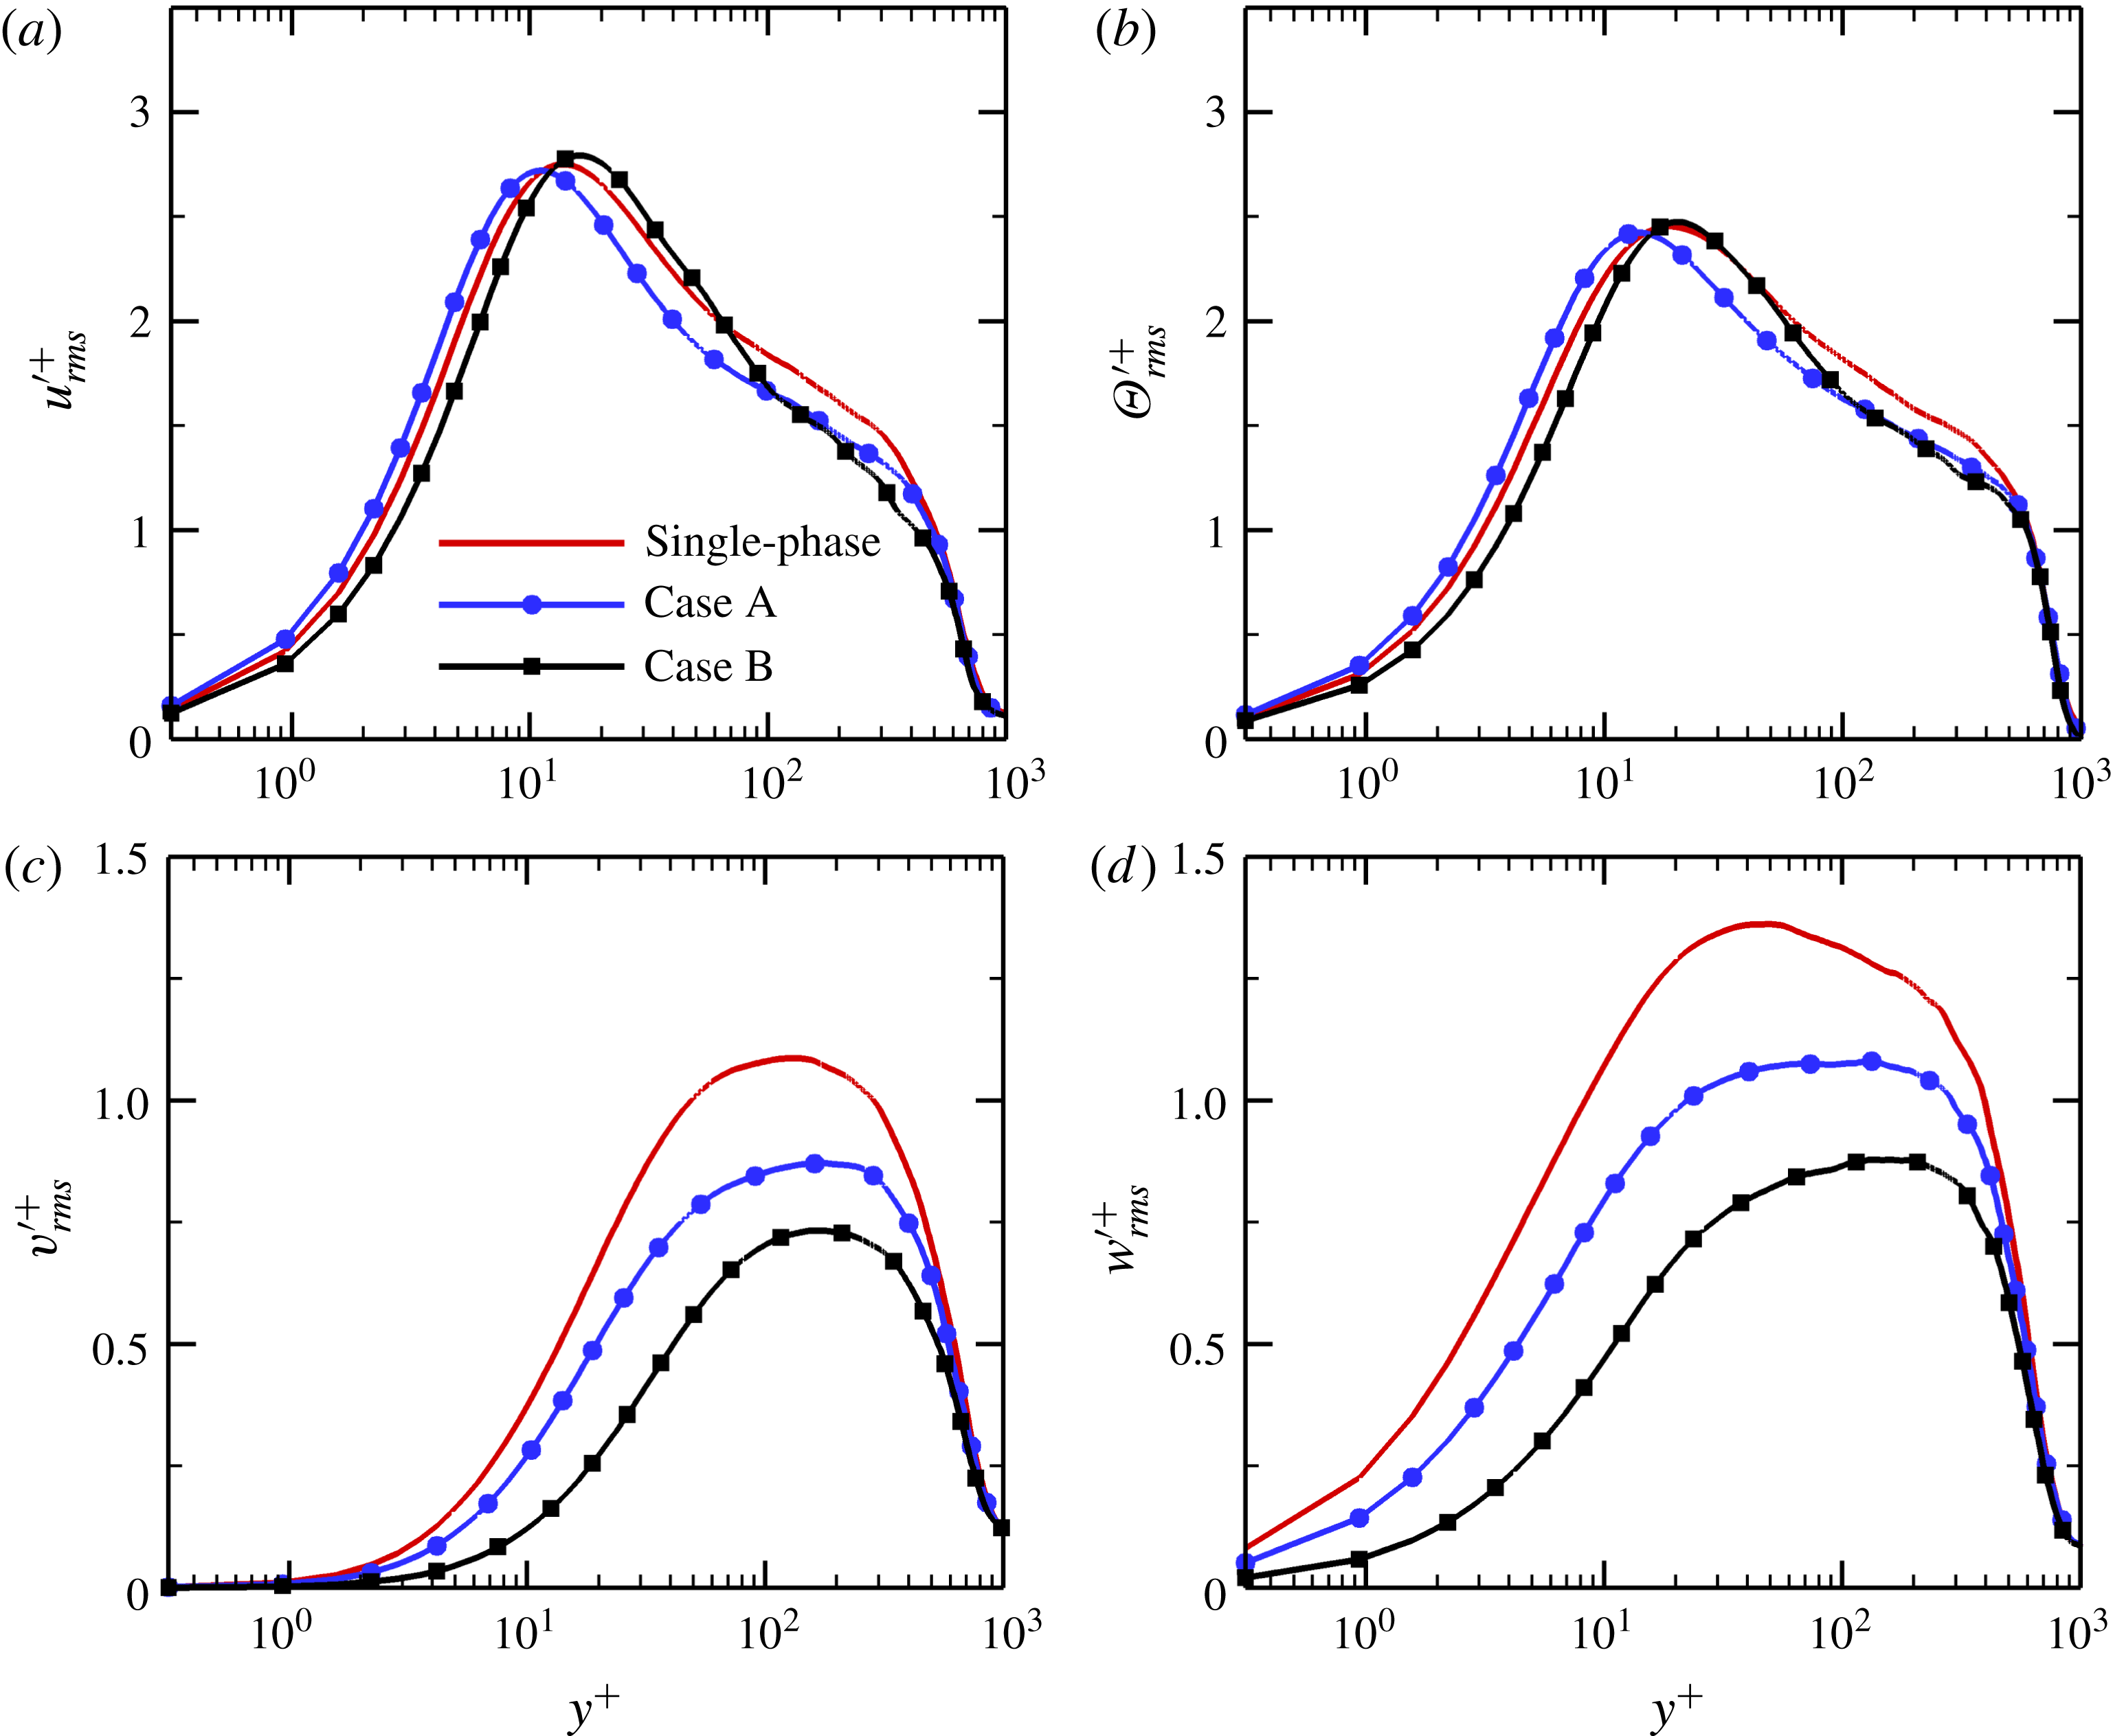
Figure 8 reports the root-mean-square (rms) values of the turbulence intensities and temperature fluctuations for the fluid phase in the turbulent region at
 $x=828\unicode[STIX]{x1D703}_{in}$
. For case A with smaller inertial particles
 $St=1$
, the streamwise turbulence intensity
 $u_{rms}^{\prime +}$
is slightly enhanced in the near-wall region with
 $y^{+}<10$
, whereas it is suppressed in the region far away from the wall. On the other hand, the particles in case B with larger inertia
 $St=5$
tend to attenuate the streamwise velocity fluctuations, except in the vicinity of the peak location of
 $u_{rms}^{\prime +}$
, where turbulence enhancement is observed. The profiles of the temperature fluctuations
 $\unicode[STIX]{x1D6E9}_{rms}^{\prime +}$
, shown in figure 8(b), exhibit similar characteristics to those of the streamwise velocity fluctuations
 $u_{rms}^{\prime +}$
. Compared with the single-phase flow, the profile of
 $u_{rms}^{\prime +}$
in case A is displaced towards the wall, while the peak position of
 $u_{rms}^{\prime +}$
in case B is slightly shifted away from the wall. This is strongly associated with near-wall turbulent coherent structures and will be discussed below.
In the wall-normal and spanwise directions, the turbulence intensities are significantly suppressed throughout the whole boundary layer, and the levels of suppression increase monotonically with particle Stokes number. This is consistent with the experimental and numerical results of Kulick, Fessler & Eaton (Reference Kulick, Fessler and Eaton1994) and Zhao, Andersson & Gillissen (Reference Zhao, Andersson and Gillissen2013) in turbulent channel flows laden with particles smaller than the Kolmogorov length scale
 $\unicode[STIX]{x1D702}$
, but contrary to the conclusions made by Pan & Banerjee (Reference Pan and Banerjee1997) and Shao, Wu & Yu (Reference Shao, Wu and Yu2012) in particle-laden channel flows with
 $d_{p}>\unicode[STIX]{x1D702}$
.
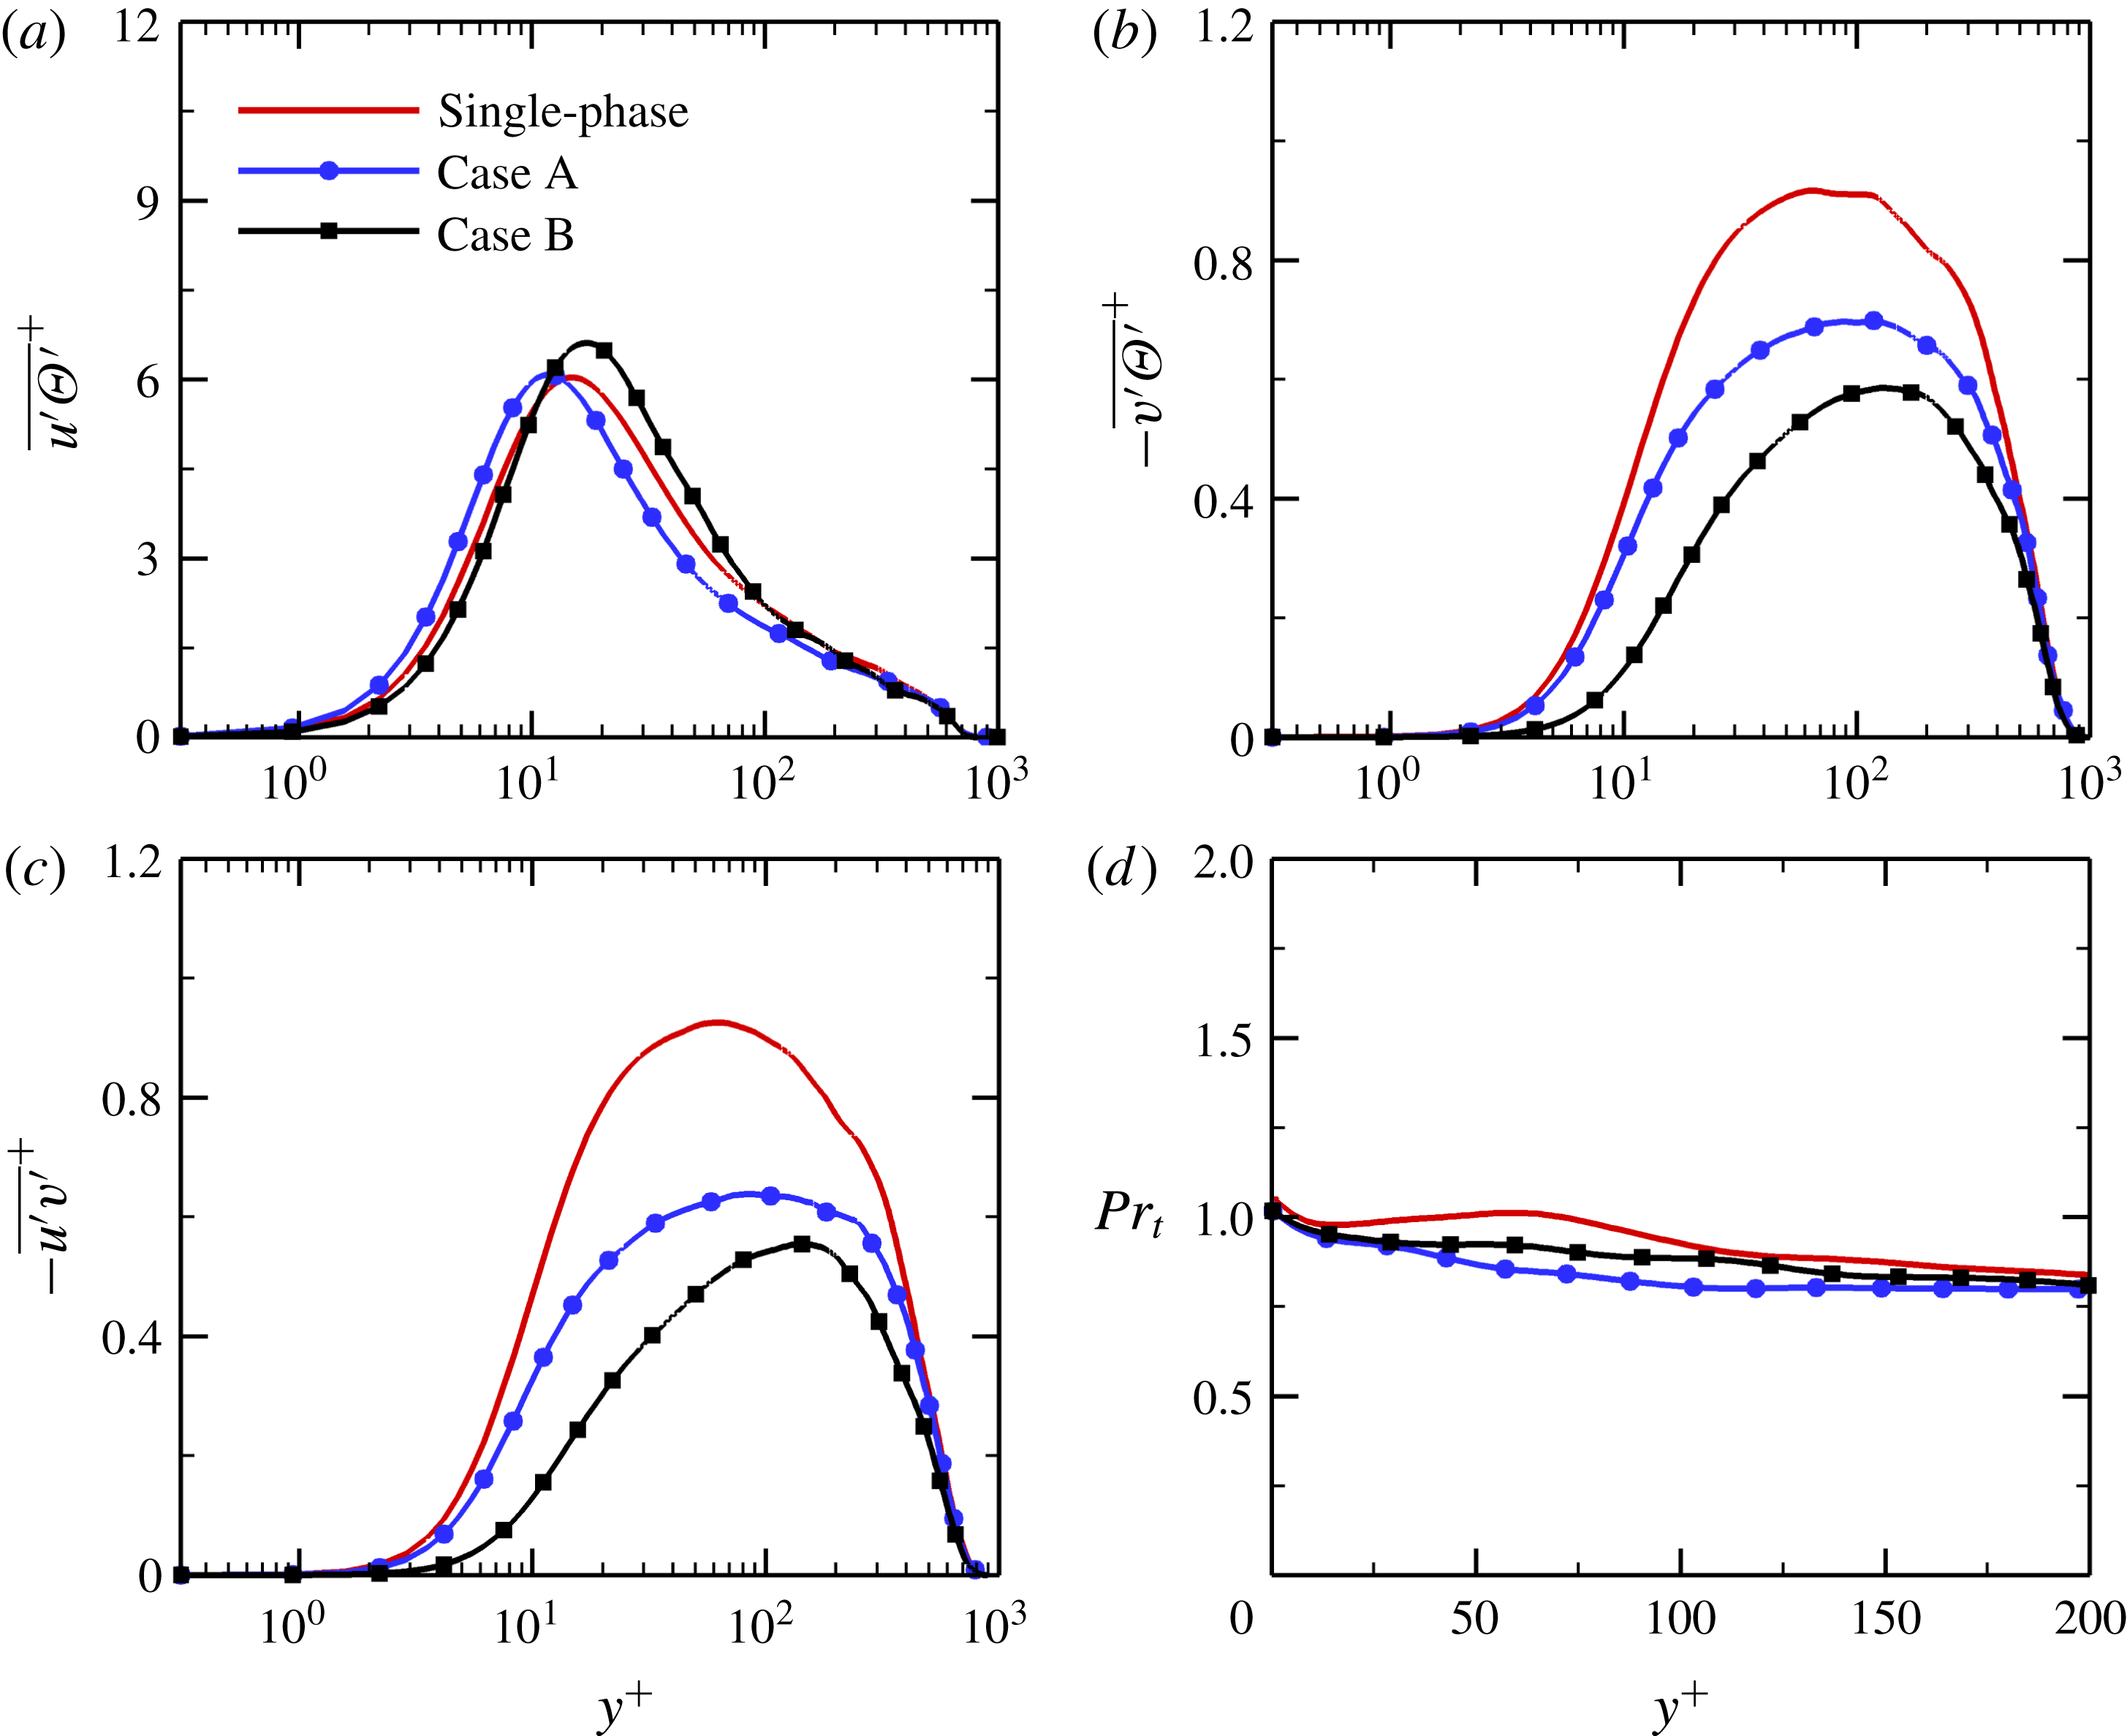
Figure 9(a) shows the wall-normal distribution of the streamwise turbulent heat flux
 $\overline{u^{\prime }\unicode[STIX]{x1D6E9}^{\prime }}^{+}$
at
 $x=828\unicode[STIX]{x1D703}_{in}$
. With the addition of smaller particles
 $St=1$
, the streamwise heat flux is augmented in the near-wall region whereas it is attenuated in the outer layer. The particles with larger inertia
 $St=5$
, however, have an opposite effect on
 $\overline{u^{\prime }\unicode[STIX]{x1D6E9}^{\prime }}^{+}$
. The wall-normal heat flux
 $-\overline{v^{\prime }\unicode[STIX]{x1D6E9}^{\prime }}^{+}$
and the Reynolds shear stress
 $-\overline{u^{\prime }v^{\prime }}^{+}$
, as shown in figure 9(b,c), decrease monotonically with increasing particle Stokes number. Figure 9(d) reports the wall-normal profile of the turbulent Prandtl number
 $Pr_{t}$
in the near-wall region, where
 $Pr_{t}$
is defined as the ratio between the turbulent eddy viscosity
 $\unicode[STIX]{x1D708}_{t}$
and the eddy diffusivity
 $\unicode[STIX]{x1D6FC}_{t}$
,
 $$\begin{eqnarray}\displaystyle & \displaystyle \unicode[STIX]{x1D708}_{t}=-{\displaystyle \frac{\overline{u^{\prime }v^{\prime }}}{\text{d}\bar{u}/\text{d}y}}, & \displaystyle\end{eqnarray}$$
 $$\begin{eqnarray}\displaystyle & \displaystyle \unicode[STIX]{x1D6FC}_{t}=-{\displaystyle \frac{\overline{v^{\prime }\unicode[STIX]{x1D6E9}^{\prime }}}{\text{d}\bar{\unicode[STIX]{x1D6E9}}/\text{d}y}}. & \displaystyle\end{eqnarray}$$
In the single-phase flow, the turbulent Prandtl number is assumed to be constant and close to one in the vicinity of the wall, which is in agreement with other previous results in boundary layer flows (Kong et al.
Reference Kong, Choi and Lee2000; Li et al.
Reference Li, Schlatter, Brandt and Henningson2009; Araya & Castillo Reference Araya and Castillo2012). In the particle-laden flows, it is evident that the presence of particles causes a decrease in the turbulent Prandtl number, with the effect being greater for particles with small inertia
 $St=1$
. According to the definition of
 $Pr_{t}$
, the variation of
 $Pr_{t}$
is probably related to the Reynolds shear stress, the wall-normal heat flux and the velocity and temperature gradients.
Wall-normal profiles of (a) the ratio between Reynolds shear stress and wall-normal heat flux and (b) the ratio between mean velocity and temperature gradients at
 $x=828\unicode[STIX]{x1D703}_{in}$
.

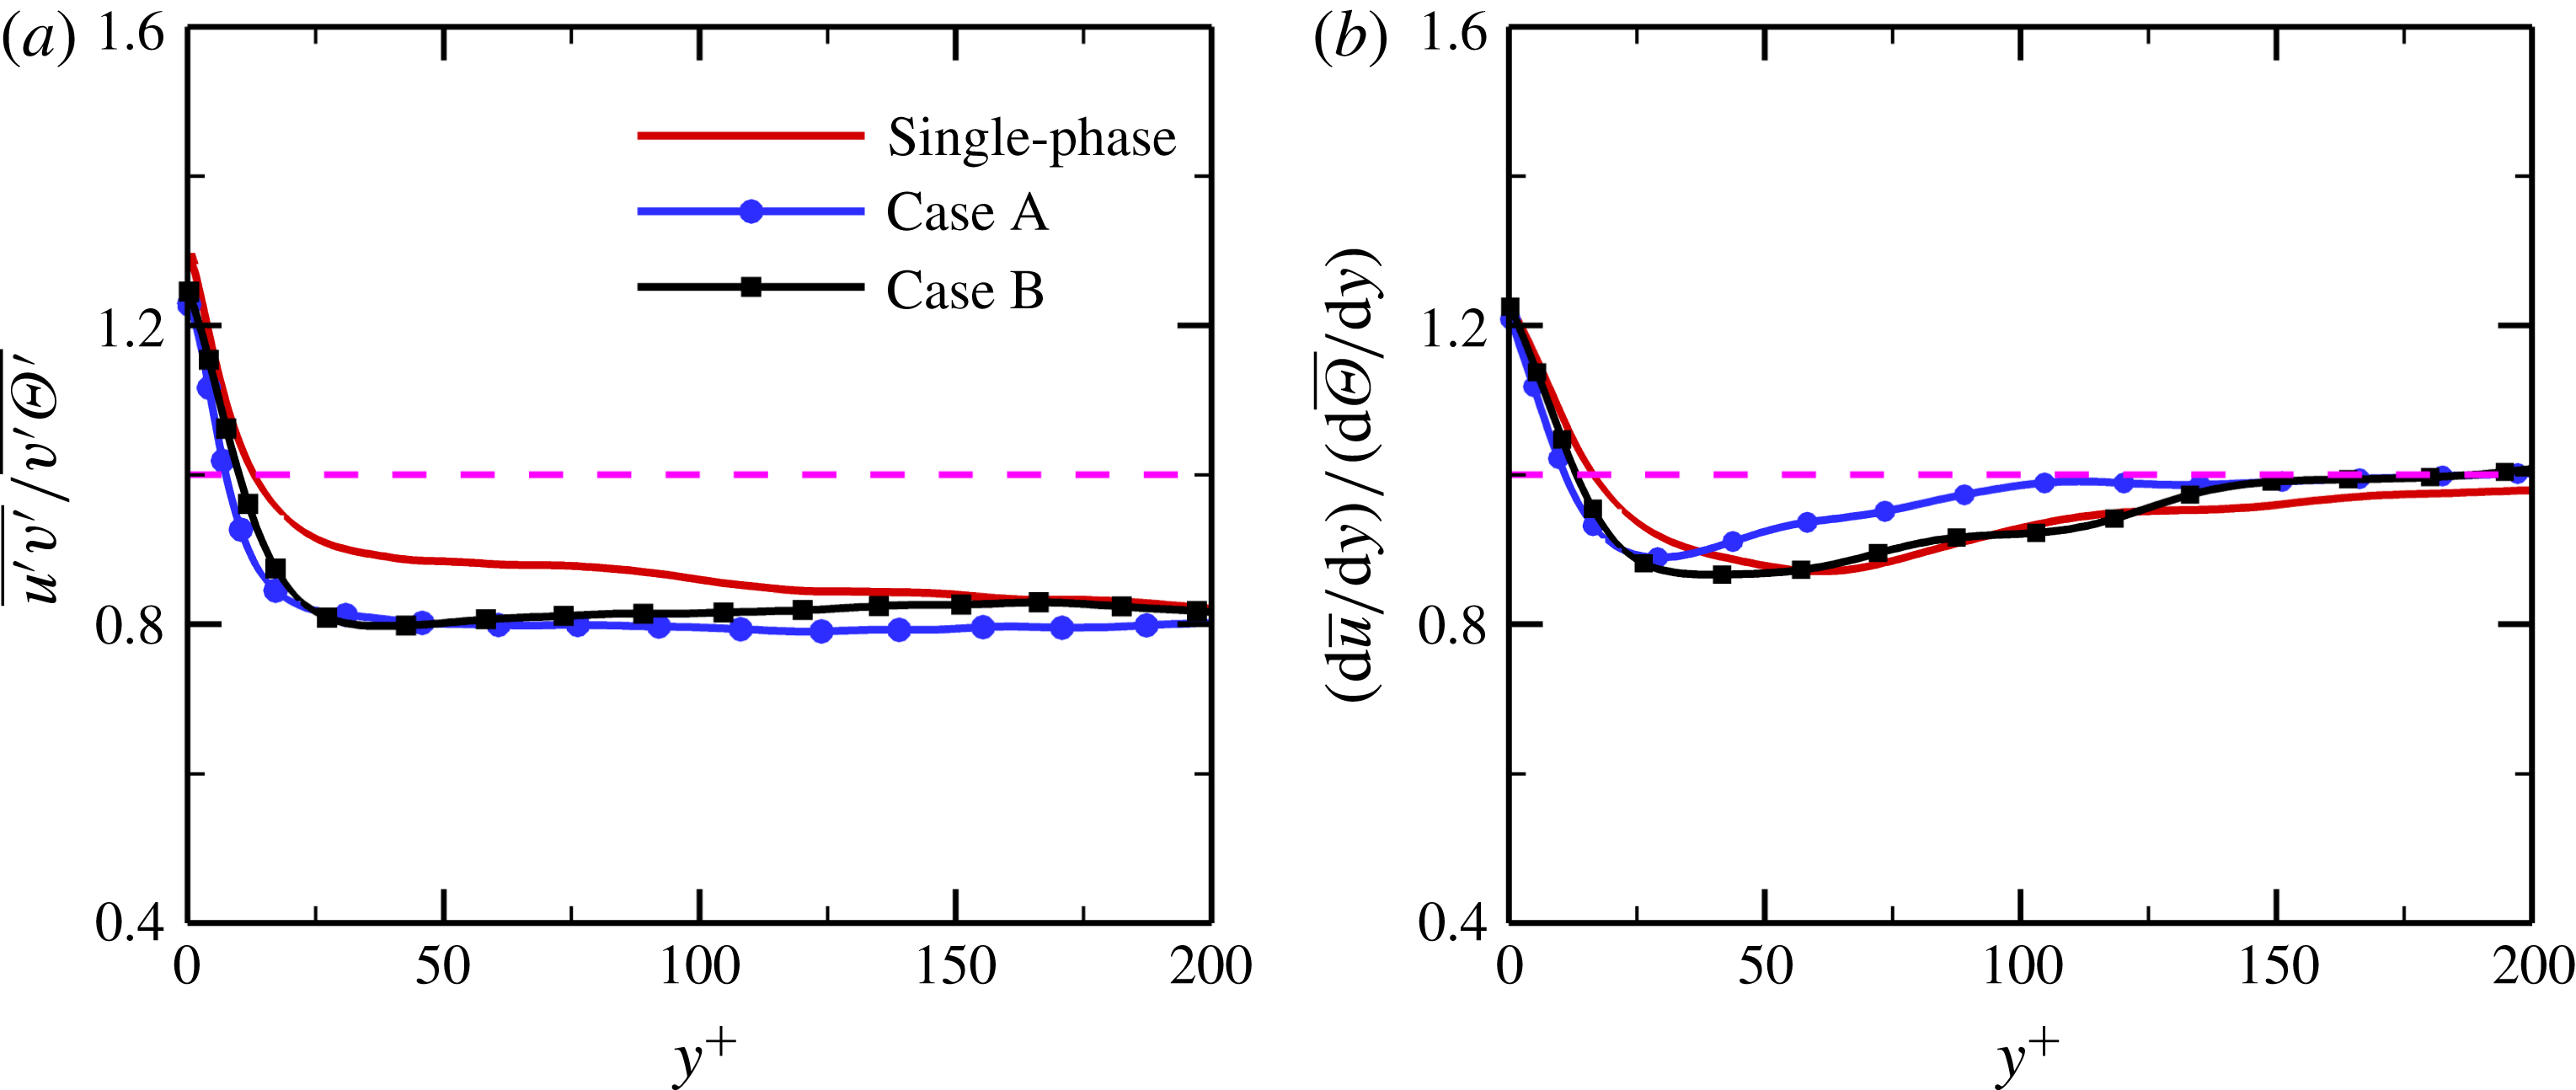
To analyse the reason for the suppression of
 $Pr_{t}$
, figure 10(a,b) respectively displays the wall-normal profiles of the ratio between Reynolds shear stress and wall-normal heat flux,
 $\overline{u^{\prime }v^{\prime }}/\overline{v^{\prime }\unicode[STIX]{x1D6E9}^{\prime }}$
, and the ratio between mean velocity and temperature gradients,
 $(\text{d}\bar{u}/\text{d}y)/(\text{d}\bar{\unicode[STIX]{x1D6E9}}/\text{d}y)$
. In the region very close to the wall, the Reynolds stress
 $-\overline{u^{\prime }v^{\prime }}$
is greater than the wall-normal heat flux
 $-\overline{v^{\prime }\unicode[STIX]{x1D6E9}^{\prime }}$
in both the single-phase and particle-laden flows; while the reverse is true in the buffer and logarithmic layers, i.e.
 $-\overline{u^{\prime }v^{\prime }}<-\overline{v^{\prime }\unicode[STIX]{x1D6E9}^{\prime }}$
. With respect to the single-phase flow, the value of the ratio
 $\overline{u^{\prime }v^{\prime }}/\overline{v^{\prime }\unicode[STIX]{x1D6E9}^{\prime }}$
is reduced in the particle-laden flows, and the effect becomes more intense for case A with smaller particles. Given that both the Reynolds stress and the wall-normal heat flux are attenuated under the effect of the particles, we can thus infer that the inertial particles have a greater effect on the Reynolds shear stress than on the wall-normal turbulent heat flux. In other words, the damping of turbulent momentum transport caused by particles is greater than that of heat transport. In fact, the solid particles obviously weaken the intensity of the streamwise vortices, as will be discussed below, which results in large suppressions of the exchanges of momentum and heat between near-wall low-speed fluid and outer high-speed fluid.
As indicated in figure 10(b), the mean streamwise velocity gradient
 $\text{d}\bar{u}/\text{d}y$
is larger than the mean temperature gradient
 $\text{d}\bar{\unicode[STIX]{x1D6E9}}/\text{d}y$
in the near-wall region, while
 $\text{d}\bar{u}/\text{d}y<\text{d}\bar{\unicode[STIX]{x1D6E9}}/\text{d}y$
is true in the region far away from the wall. In the present particle-laden simulations, the ratio of
 $\text{d}\bar{u}/\text{d}y$
to
 $\text{d}\bar{\unicode[STIX]{x1D6E9}}/\text{d}y$
is slightly decreased in the viscous sublayer and buffer layer whereas it is generally increased in the logarithmic region. Therefore, it can be concluded that the reduction of the turbulent Prandtl number in figure 9(d) can be attributed to the decrease in
 $\overline{u^{\prime }v^{\prime }}/\overline{v^{\prime }\unicode[STIX]{x1D6E9}^{\prime }}$
and the increase in
 $(\text{d}\bar{u}/\text{d}y)/(\text{d}\bar{\unicode[STIX]{x1D6E9}}/\text{d}y)$
.
3.3 Correlation coefficients
As is well known, the degree of correlation between the velocity and temperature fluctuations can be characterized by the correlation coefficients, which have been studied previously in a single-phase turbulent boundary layer (Pirozzoli, Grasso & Gatski Reference Pirozzoli, Grasso and Gatski2004; Li et al.
Reference Li, Luo and Fan2016a
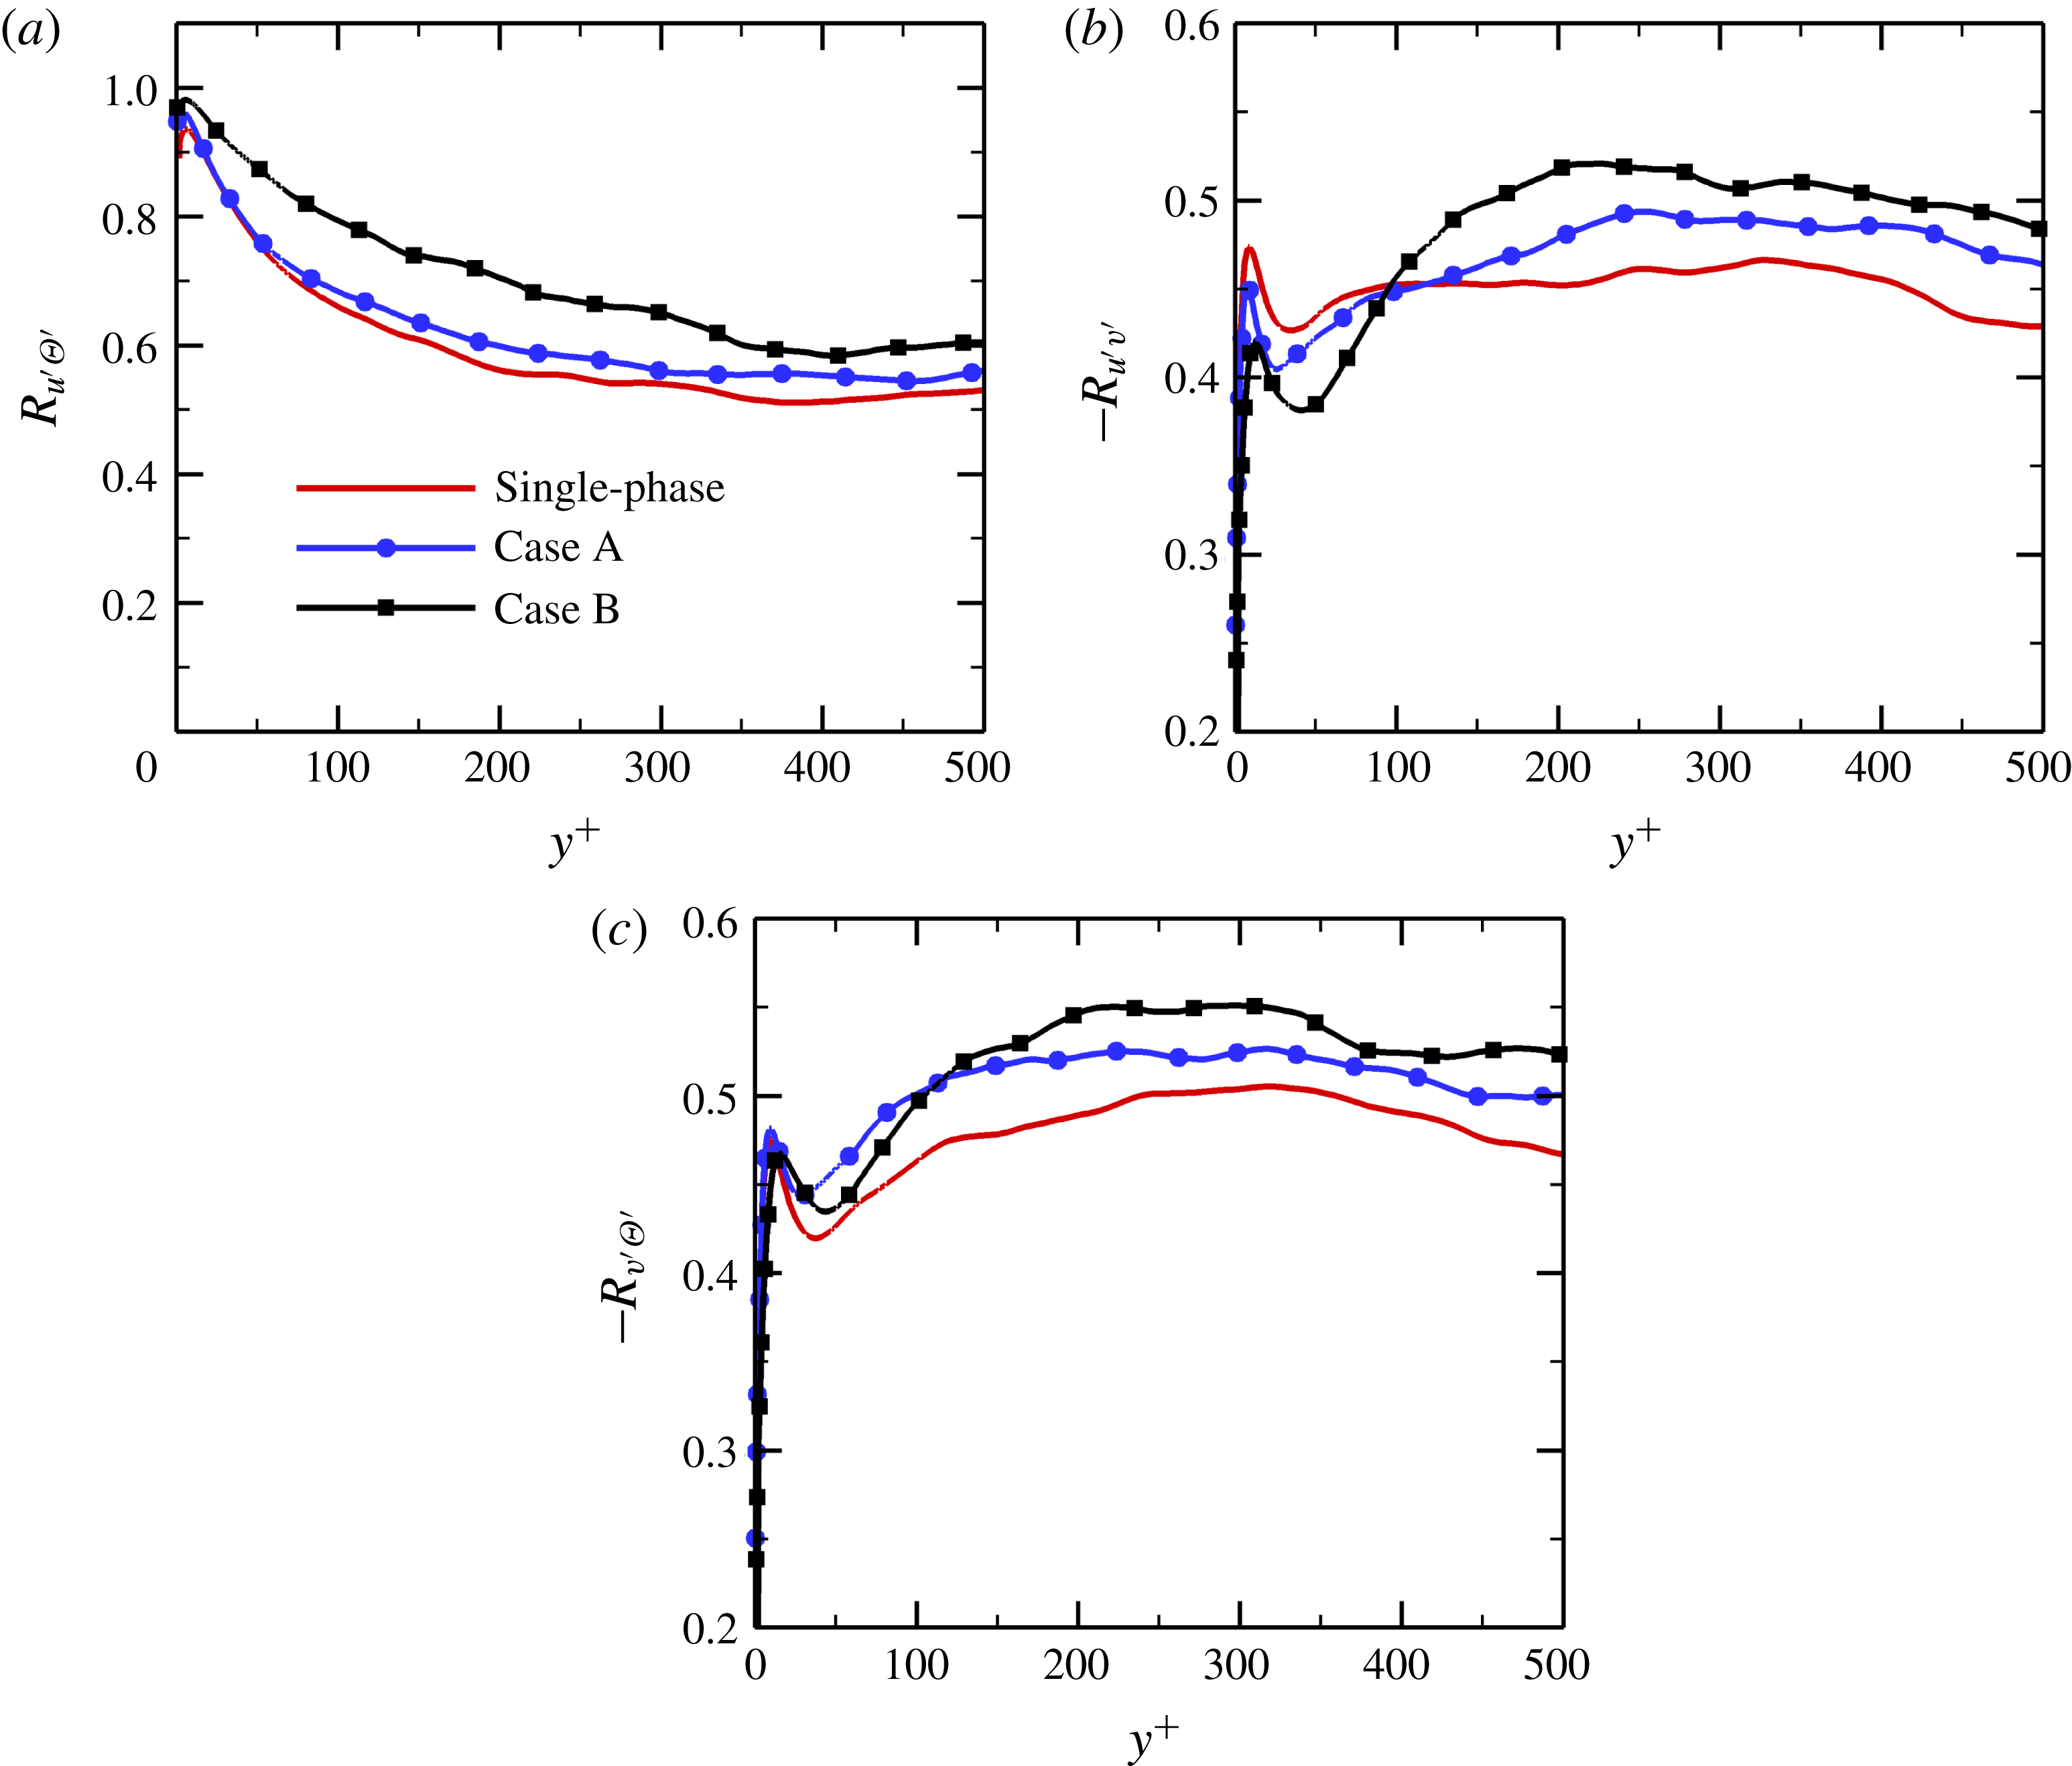
). In this subsection, we examine the effect of inertial particles on the temperature–velocity correlations in particle-laden flows. The correlation coefficients between
 $u^{\prime }$
,
 $v^{\prime }$
and
 $\unicode[STIX]{x1D6E9}^{\prime }$
, depicted in figure 11, are expressed as
 $$\begin{eqnarray}R_{u^{\prime }\unicode[STIX]{x1D6E9}^{\prime }}=\overline{u^{\prime }\unicode[STIX]{x1D6E9}^{\prime }}/(u_{rms}^{\prime }\unicode[STIX]{x1D6E9}_{rms}^{\prime }),\quad R_{u^{\prime }v^{\prime }}=\overline{u^{\prime }v^{\prime }}/(u_{rms}^{\prime }v_{rms}^{\prime }),\quad R_{v^{\prime }\unicode[STIX]{x1D6E9}^{\prime }}=\overline{v^{\prime }\unicode[STIX]{x1D6E9}^{\prime }}/(v_{rms}^{\prime }\unicode[STIX]{x1D6E9}_{rms}^{\prime }).\end{eqnarray}$$
As shown in figure 11(a), the
 $u^{\prime }-\unicode[STIX]{x1D6E9}^{\prime }$
correlation coefficient,
 $R_{u^{\prime }\unicode[STIX]{x1D6E9}^{\prime }}$
, increases monotonically with increasing particle Stokes number, indicating that the level of correlation between
 $u^{\prime }$
and
 $\unicode[STIX]{x1D6E9}^{\prime }$
is enhanced in the particle-laden flows with respect to the single-phase flow.
Temperature–velocity correlations versus the inner wall coordinate
 $y^{+}$
at
 $x=828\unicode[STIX]{x1D703}_{in}$
: (a)
 $R_{u^{\prime }\unicode[STIX]{x1D6E9}^{\prime }}$
; (b)
 $-R_{u^{\prime }v^{\prime }}$
; (c)
 $-R_{v^{\prime }\unicode[STIX]{x1D6E9}^{\prime }}$
.

As far as the
 $u^{\prime }-v^{\prime }$
correlation coefficient,
 $-R_{u^{\prime }v^{\prime }}$
, is concerned, it can be seen that the presence of particles substantially weakens the degree of correlation between the streamwise and wall-normal velocity fluctuations in the near-wall region, whereas the reverse is true in the outer layer. Moreover, these effects become more pronounced as the particle Stokes number
 $St$
increases.
In the outer region of the boundary layer (
 $y^{+}>110$
), the effect of particles on the
 $v^{\prime }-\unicode[STIX]{x1D6E9}^{\prime }$
correlation is similar to that on the
 $u^{\prime }-v^{\prime }$
correlation; that is, the degree of correlation between
 $v^{\prime }$
and
 $\unicode[STIX]{x1D6E9}^{\prime }$
increases with particle Stokes number. In the vicinity of the wall, however, the magnitude of
 $-R_{v^{\prime }\unicode[STIX]{x1D6E9}^{\prime }}$
in case A with smaller particles is larger than that in case B with larger particles. Therefore, we can conclude that the inertial solid particles tend to enhance the degrees of correlation between
 $u^{\prime }$
,
 $v^{\prime }$
and
 $\unicode[STIX]{x1D6E9}^{\prime }$
in the region further away from the wall.
3.4 Effect of inter-particle collisions on particle motion
In wall-bounded flows, the inertial particles tend to accumulate in the near-wall region due to turbophoresis, and the particle concentration is significantly higher than the average value in the vicinity of the wall, as shown in figure 2(a). Therefore, inter-particle collisions may have significant effects on the particle dynamics and particle concentration. In this subsection, we examine the effect of particle–particle collisions on the motion of particles.
Particle concentration versus the inner wall coordinate
 $y^{+}$
at
 $x=828\unicode[STIX]{x1D703}_{in}$
: (a) case A; (b) case B.

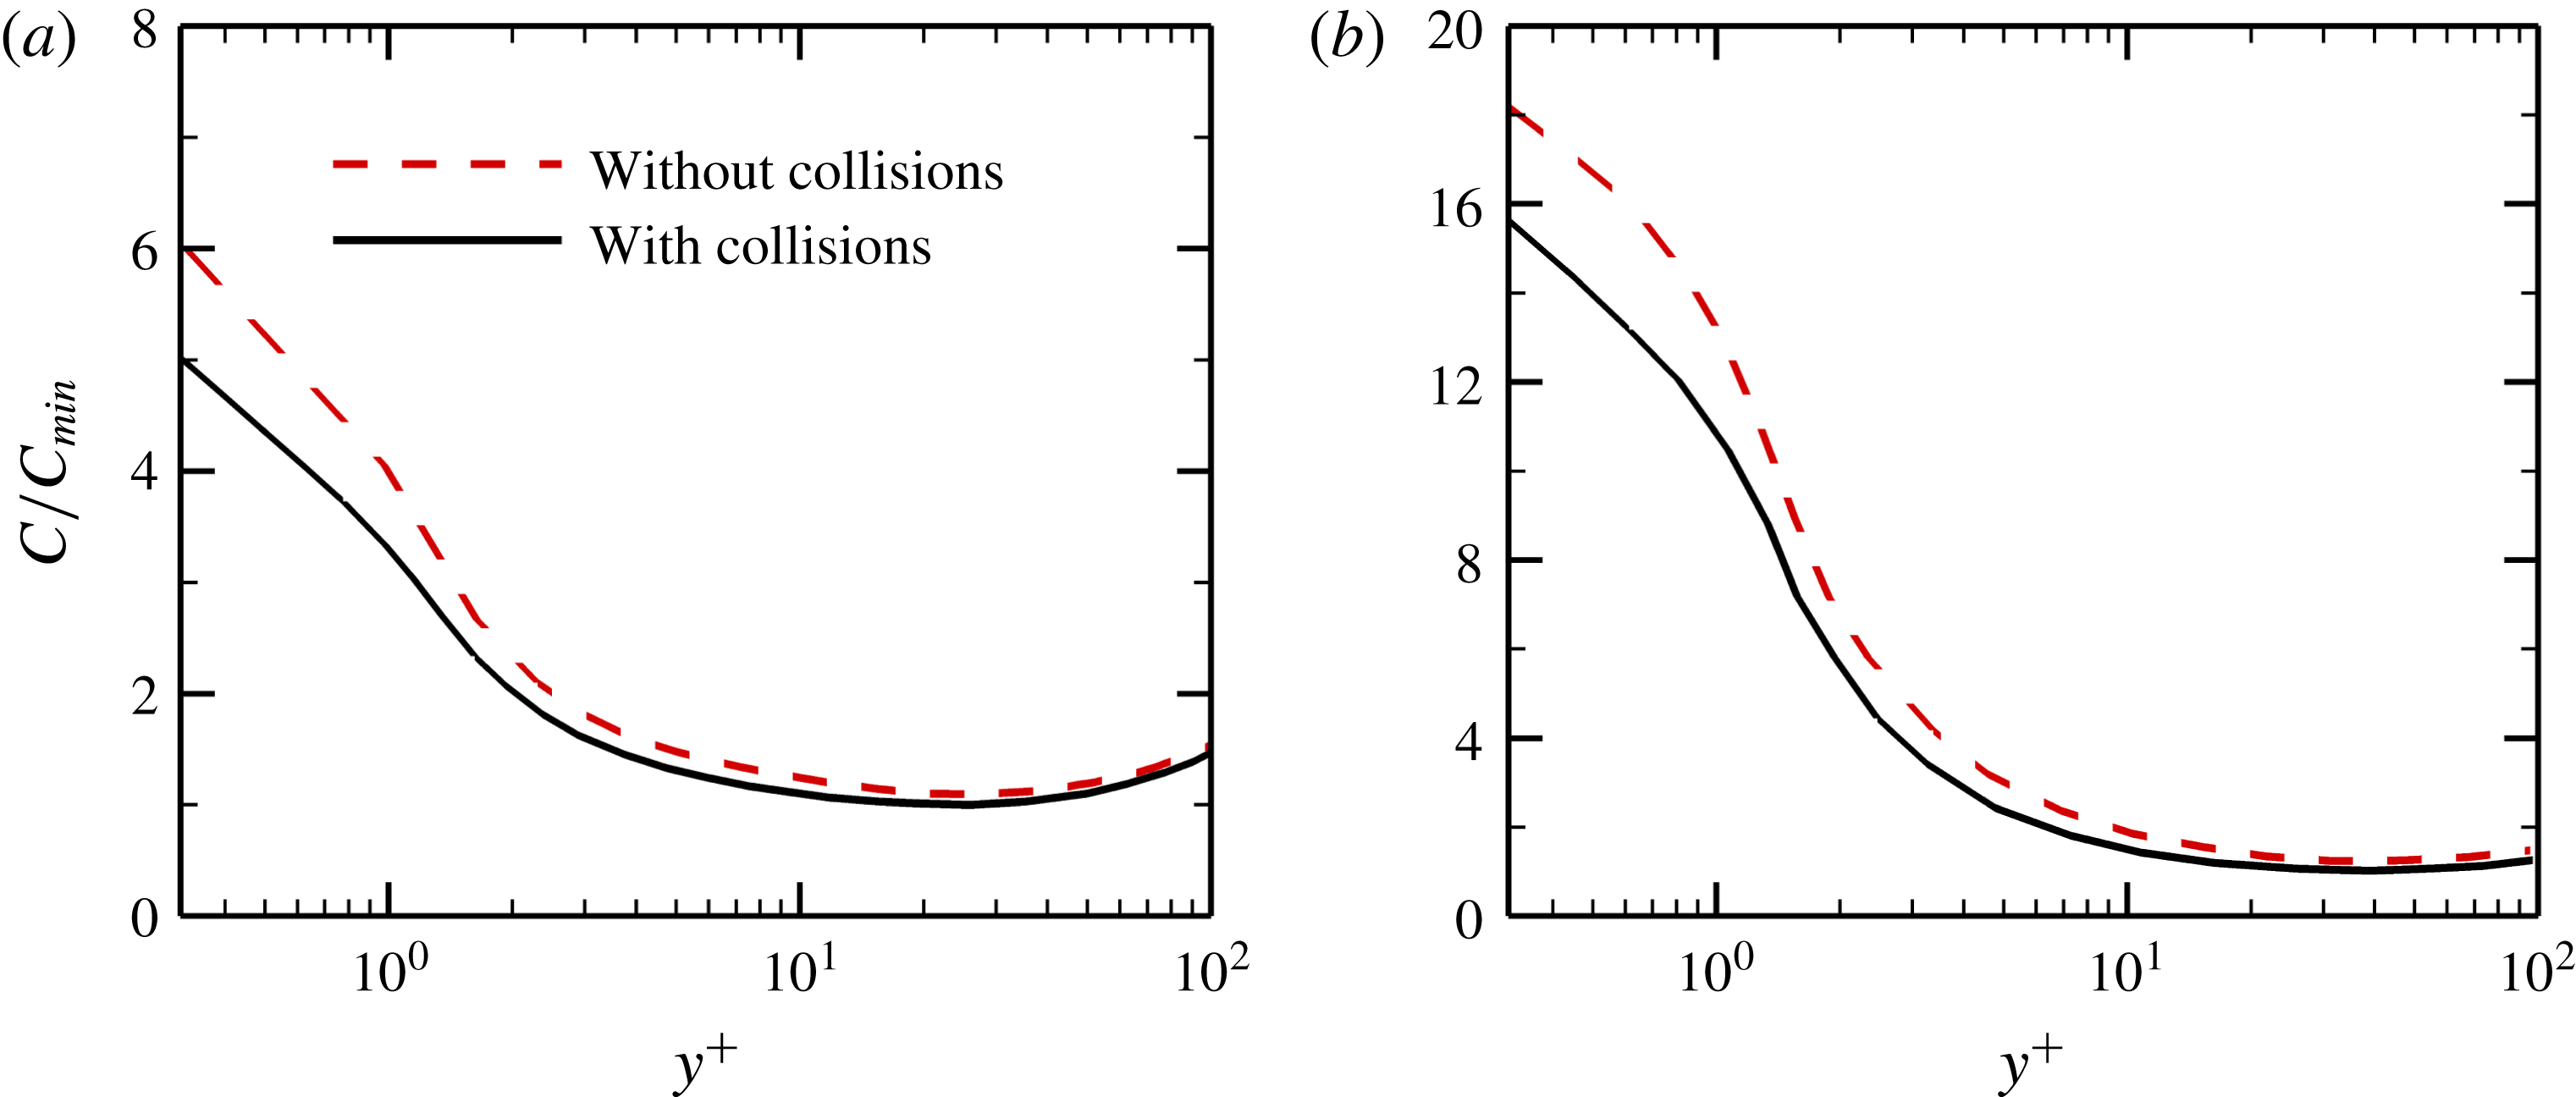
Figure 12 reports the wall-normal profiles of the particle concentration versus the inner wall coordinate
 $y^{+}$
at
 $x=828\unicode[STIX]{x1D703}_{in}$
. It is clear that inter-particle collisions weaken the preferential distribution of particles in the turbulent boundary layer, which is in agreement with previous numerical results in turbulent pipe and channel flows (Li et al.
Reference Li, McLaughlin, Kontomaris and Portela2001; Yamamoto et al.
Reference Yamamoto, Potthoff, Tanaka, Kajishima and Tsuji2001; Vreman Reference Vreman2007; Nasr, Ahmadi & McLaughlin Reference Nasr, Ahmadi and McLaughlin2009). It should be noted that the inter-particle collisions have no significant impacts on the mean velocity and temperature profiles for both the dispersed and fluid phases (not shown). This is due to the fact that in the dilute two-phase flows, the motion of particles is mainly dominated by the aerodynamic forces. Although inter-particle collisions may take place in the dilute suspension, the particle–particle collisions have a relatively small effect on the particle dynamics, which in turn leads to an insignificant influence on the fluid phase.
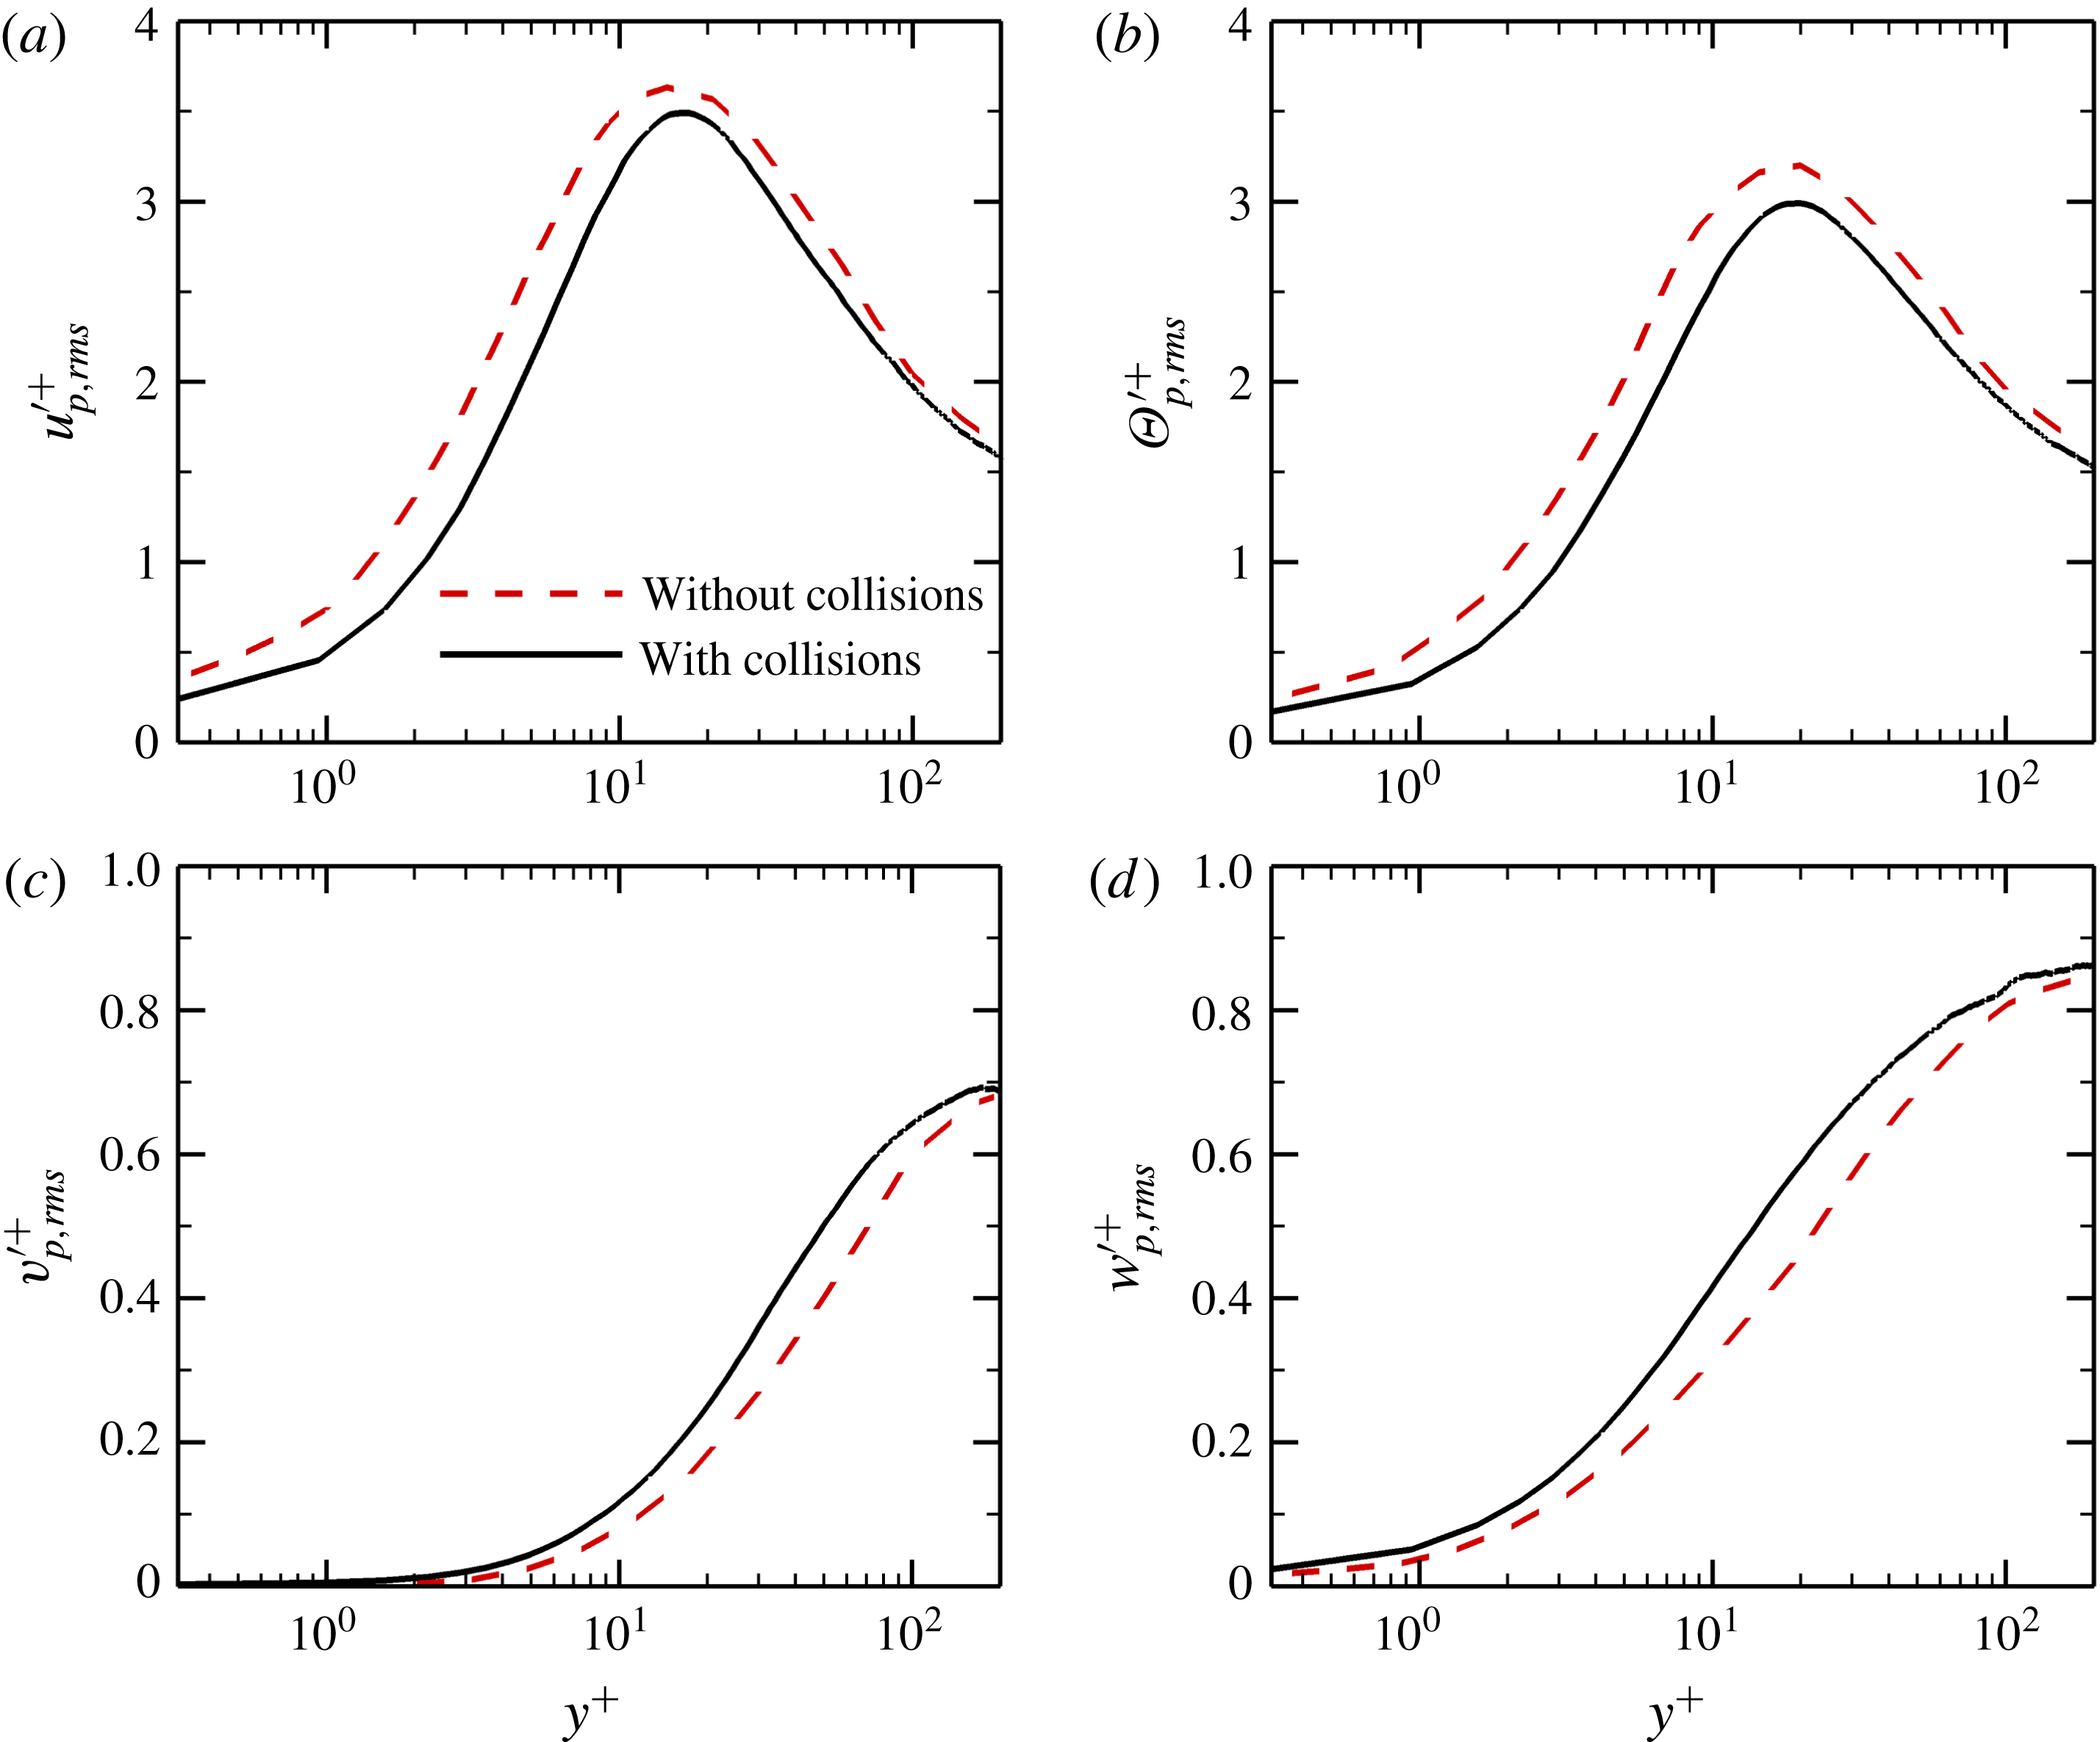
Figure 13 shows the particle velocity and temperature fluctuations in inner wall units at
 $x=828\unicode[STIX]{x1D703}_{in}$
for case B. It can be seen that when the particle collision effects are included in the simulations, the particle streamwise velocity fluctuations
 $u_{p,rms}^{\prime +}$
are reduced near the wall. This is consistent with the numerical results of Yamamoto et al. (Reference Yamamoto, Potthoff, Tanaka, Kajishima and Tsuji2001) in a vertical channel flow, but contrary to the conclusions made by Nasr et al. (Reference Nasr, Ahmadi and McLaughlin2009) in which inter-particle collisions slightly increased the value of
 $u_{p,rms}^{\prime +}$
in the near-wall region. The temperature fluctuations of the particles are also decreased under the effect of inter-particle collisions. On the other hand, the inter-particle collisions significantly increase the particle velocity fluctuations in the wall-normal and spanwise directions, which is in agreement with previous numerical results in wall-bounded turbulent flows (Yamamoto et al.
Reference Yamamoto, Potthoff, Tanaka, Kajishima and Tsuji2001; Nasr et al.
Reference Nasr, Ahmadi and McLaughlin2009). This means that more turbulent kinetic energy of the particles is transferred from the streamwise component to the other components under the effect of inter-particle collisions.
Particle velocity and temperature fluctuations in inner wall units at
 $x=828\unicode[STIX]{x1D703}_{in}$
for case B: (a) streamwise velocity fluctuations
 $u_{p,rms}^{\prime +}$
; (b) temperature fluctuations
 $\unicode[STIX]{x1D6E9}_{p,rms}^{\prime +}$
; (c) wall-normal velocity fluctuations
 $v_{p,rms}^{\prime +}$
; (d) spanwise velocity fluctuations
 $w_{p,rms}^{\prime +}$
.

4 Turbulent coherent structures
During the past few decades, a great number of experimental and numerical studies indicated that the turbulent coherent structures, namely the alternating high- and low-speed streaks, quasi-streamwise vortices, hairpin vortices and sweep and ejection events, were responsible for the motion of particles in wall-bounded turbulent flows (Kaftori, Hetsroni & Banerjee Reference Kaftori, Hetsroni and Banerjee1995; Rouson & Eaton Reference Rouson and Eaton2001; Marchioli & Soldati Reference Marchioli and Soldati2002). However, very little research has been reported about the modification of turbulent coherent structures by particles in the literature. Furthermore, there is still no general consensus on this topic among these few studies (Rashidi, Hetsroni & Banerjee Reference Rashidi, Hetsroni and Banerjee1990; Portela & Oliemans Reference Portela and Oliemans2003; Dritselis & Vlachos Reference Dritselis and Vlachos2008). This motivates an investigation of the effect of particles on these turbulent structures in this section.
4.1 Turbulent vortical structures
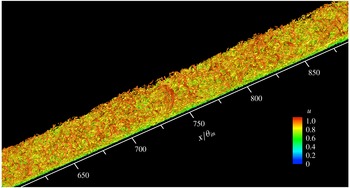
Figure 14 exhibits instantaneous three-dimensional snapshots of the turbulent vortical structures coloured by the local streamwise velocity in the single-phase flow. It should be pointed out that the definition of vortical structures has long been a controversial topic during the past few decades (Liu et al. Reference Liu, Wang, Yang and Duan2016; Wu Reference Wu2018). In this study, the vortical structures are identified by the isosurfaces of the second invariant of the velocity gradient tensor (Hunt, Wray & Moin Reference Hunt, Wray and Moin1988). It is interesting to observe that in the spatially developing turbulent boundary layer over a wide range of Reynolds numbers, the coherence of the vortical structures tends to be gradually weakened as the flow moves downstream.
Instantaneous snapshots of the three-dimensional vortical structures coloured by local streamwise velocity in the single-phase flow.

Isosurfaces of the second invariant of the instantaneous velocity gradient tensor coloured by
 $y/\unicode[STIX]{x1D6FF}$
, where
 $\unicode[STIX]{x1D6FF}$
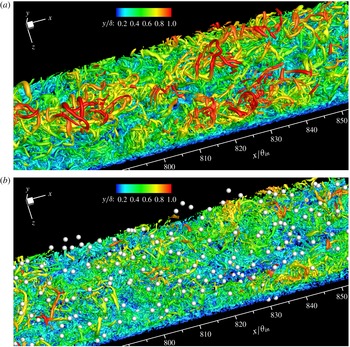
is the local boundary layer thickness: (a) single-phase flow; (b) particle-laden flow (case A). It should be noted that the particles are drawn as small white spheres, larger than their real scale for better visualization.

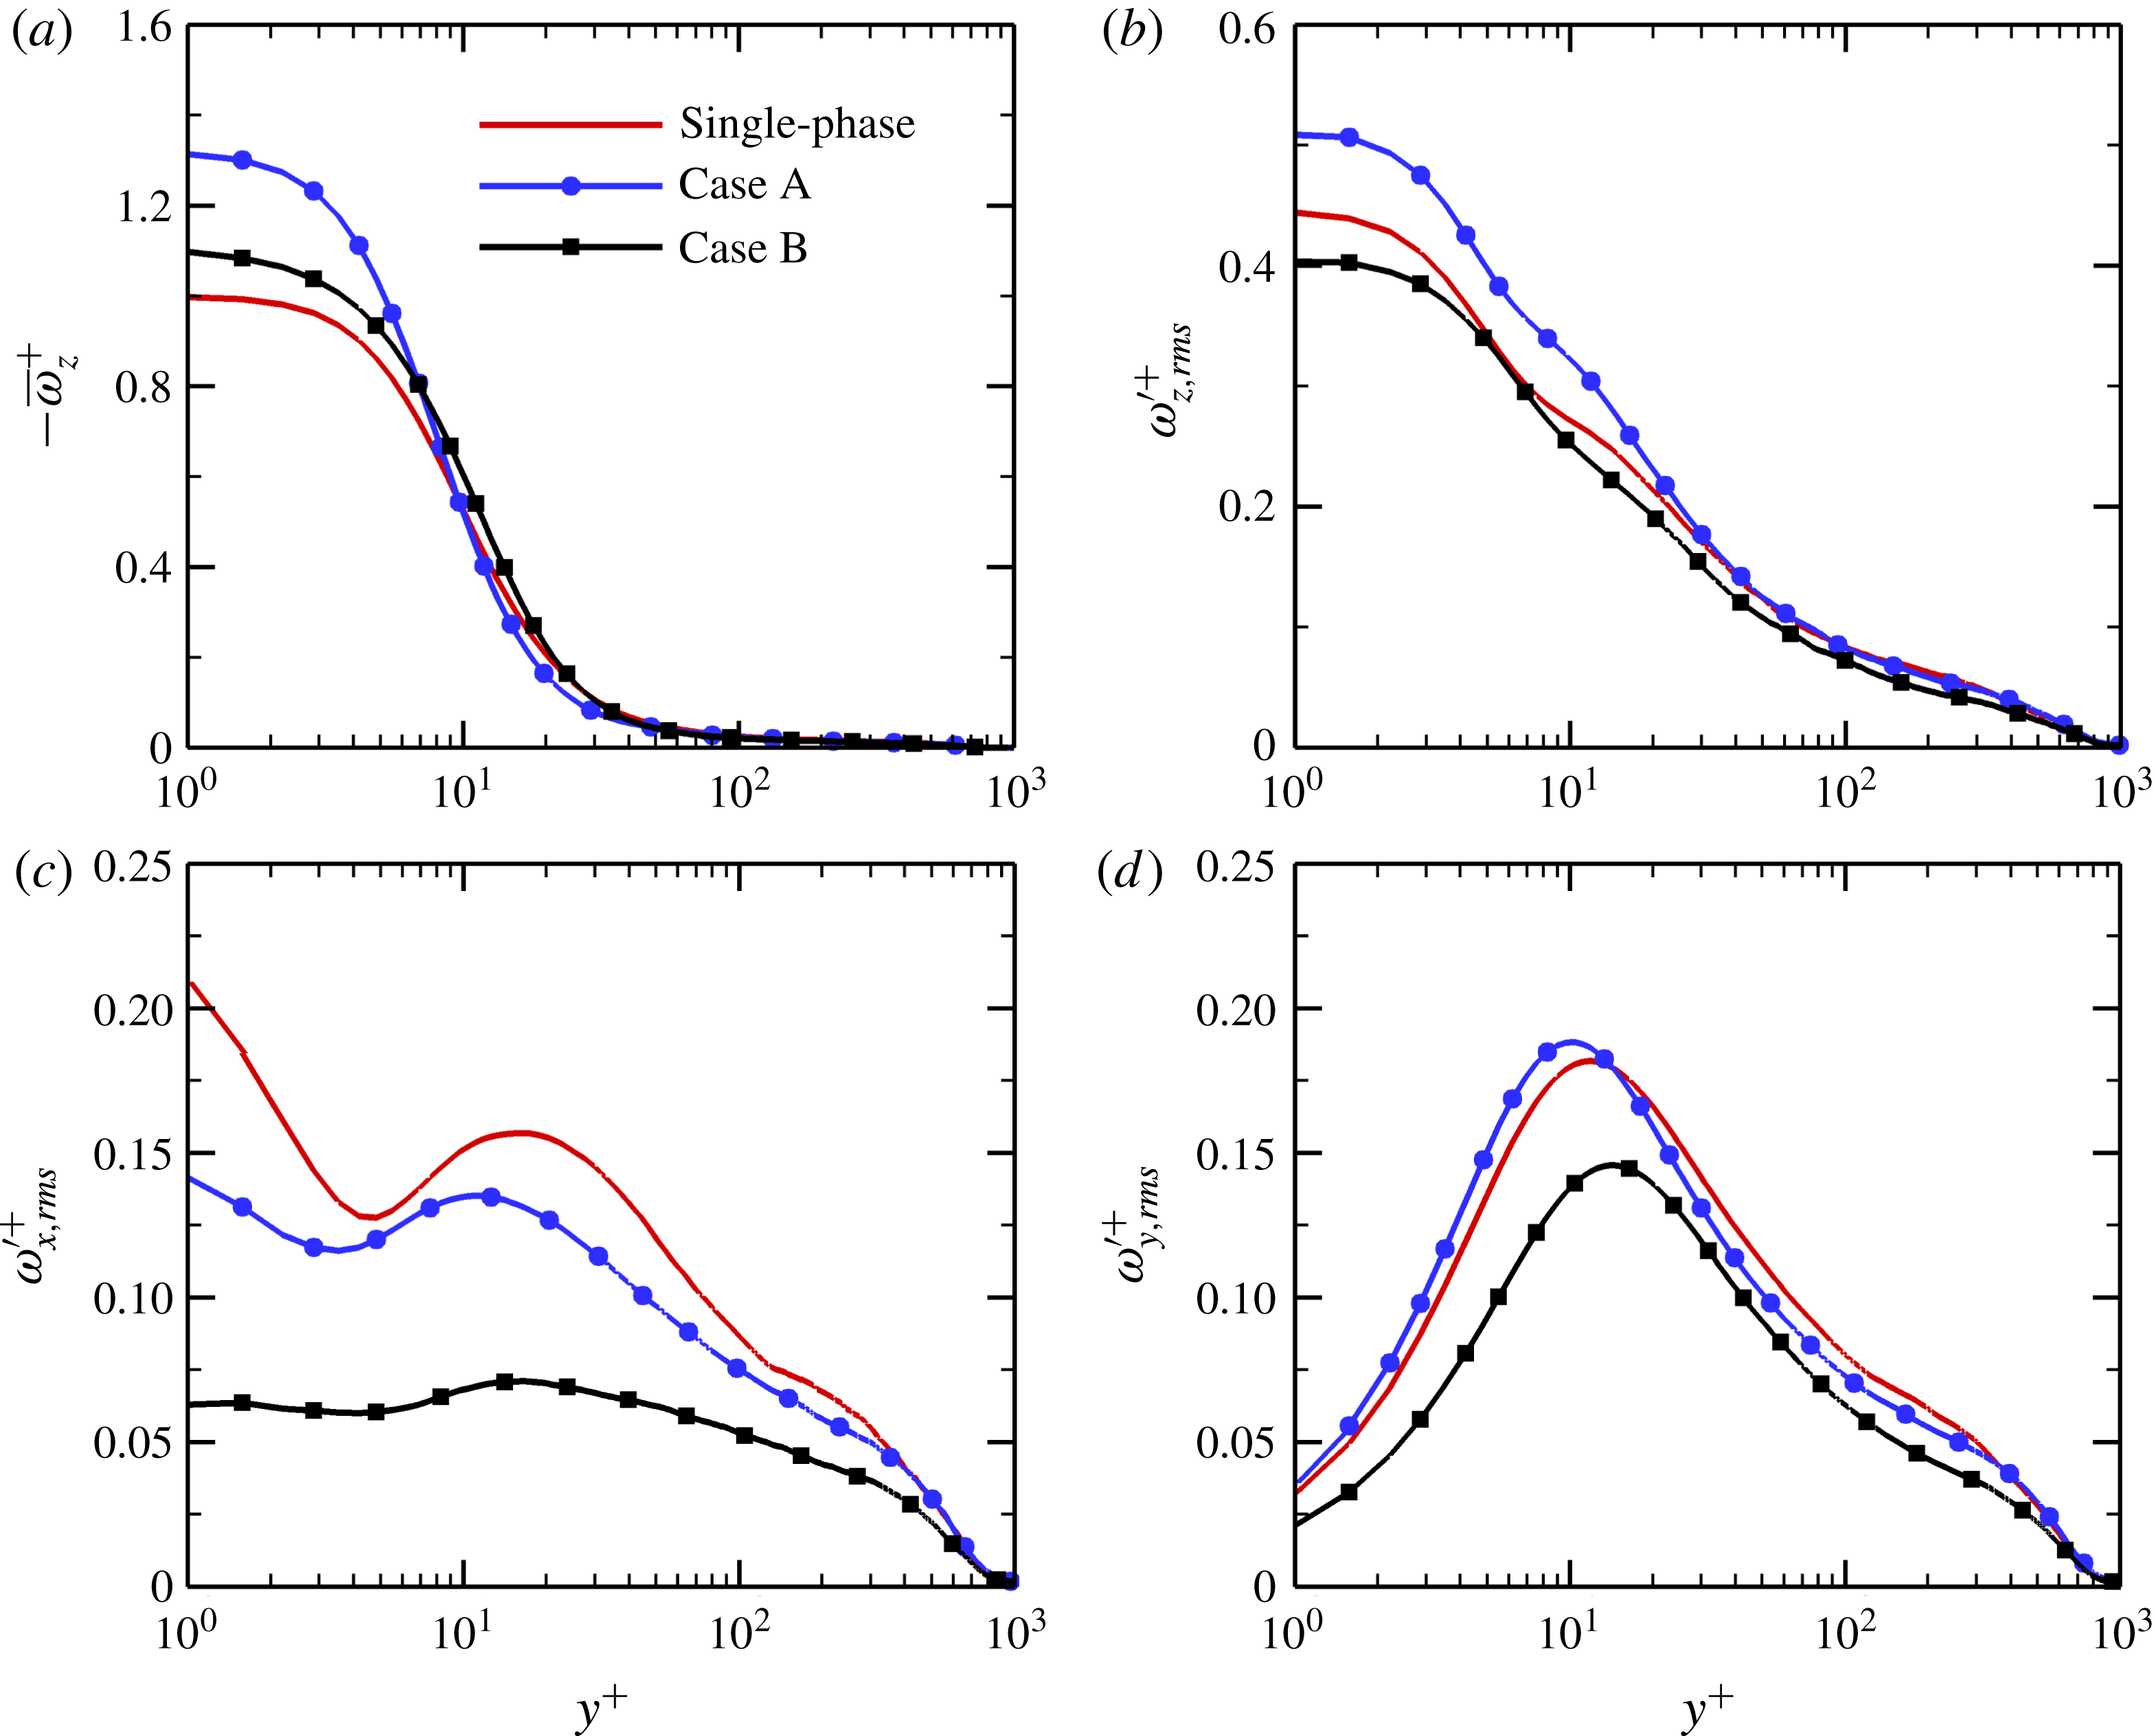
Mean and fluctuating vorticities in inner wall units at
 $x=828\unicode[STIX]{x1D703}_{in}$
: (a) mean spanwise vorticity
 $-\bar{\unicode[STIX]{x1D714}}_{z}^{+}$
; (b) spanwise vorticity fluctuations
 $\unicode[STIX]{x1D714}_{z,rms}^{\prime +}$
; (c) streamwise vorticity fluctuations
 $\unicode[STIX]{x1D714}_{x,rms}^{\prime +}$
; (d) wall-normal vorticity fluctuations
 $\unicode[STIX]{x1D714}_{y,rms}^{\prime +}$
.

In order to examine the effect of inertial particles on coherent structures, figure 15 shows a comparison of turbulent vortical structures between single-phase and particle-laden flows at the same instant. Here, the vortical structures are coloured by local values of
 $y/\unicode[STIX]{x1D6FF}$
, where
 $\unicode[STIX]{x1D6FF}$
is the local velocity boundary layer thickness. Red isosurfaces indicate that some of outer vortical structures reach the local boundary layer edge. It is evident that the height of the vortical structures is significantly reduced in the particle-laden flow compared with the single-phase flow. In other words, the solid particles displace the vortical structures towards the wall. In addition, it is expected that the turbulent vortical structures become disorganized due to the perturbations caused by the dispersion of inertial particles.
To further investigate the modification of turbulent coherent structures by particles, figure 16 shows the wall-normal profiles of the mean and fluctuating vorticities in inner wall units at
 $x=828\unicode[STIX]{x1D703}_{in}$
. Since the mean spanwise and wall-normal fluid velocities and the spanwise gradient of the mean streamwise velocity are vanishingly small, the mean vorticities in the streamwise and wall-normal directions are almost zero and thus not presented here. On the other hand, the profile of the mean spanwise vorticity
 $\bar{\unicode[STIX]{x1D714}}_{z}^{+}$
shows almost the same variation as the velocity gradient profile
 $\text{d}\bar{u}^{+}/\text{d}y^{+}$
in figure 7(a), due to
 $\bar{\unicode[STIX]{x1D714}}_{z}^{+}=\unicode[STIX]{x2202}\bar{v}^{+}/\unicode[STIX]{x2202}x^{+}-\unicode[STIX]{x2202}\bar{u}^{+}/\unicode[STIX]{x2202}y^{+}\approx -\unicode[STIX]{x2202}\bar{u}^{+}/\unicode[STIX]{x2202}y^{+}$
. That is,
 $\bar{\unicode[STIX]{x1D714}}_{z}^{+}$
is increased in the near-wall region but decreased in the outer layer under the effect of particles. The spanwise vorticity fluctuations of the fluid
 $\unicode[STIX]{x1D714}_{z,rms}^{\prime +}$
are plotted in figure 16(b). In the viscous sublayer and buffer layer, the particles with smaller inertia
 $St=1$
enhance the vorticity fluctuations
 $\unicode[STIX]{x1D714}_{z,rms}^{\prime +}$
, whereas the larger particles with
 $St=5$
attenuate it.
As far as the streamwise vorticity fluctuations
 $\unicode[STIX]{x1D714}_{x,rms}^{\prime +}$
are concerned, it can be seen from figure 16(c) that the profile of
 $\unicode[STIX]{x1D714}_{x,rms}^{\prime +}$
displays two peaks: one is obtained in the buffer layer and another is attained at the wall with larger magnitude. In addition, there also exists a local minimum between the two peaks. According to Moser & Moin (Reference Moser and Moin1984), the locations of the local minimum and maximum of
 $\unicode[STIX]{x1D714}_{x,rms}^{\prime +}$
respectively correspond to the average locations of the edge and centre of the streamwise vortices in the near-wall region. The first peak at the wall is caused by the opposite-signed streamwise vortices created in the close vicinity of the wall due to the no-slip condition. In the single-phase flow, on average, the centre of the streamwise vortices is located at
 $y^{+}\approx 17$
with a strength of approximately
 $0.16u_{\unicode[STIX]{x1D70F}}^{2}/\unicode[STIX]{x1D708}$
and the edge is located at
 $y^{+}\approx 4.5$
. It can thus be estimated that the near-wall streamwise vortical structures have a mean diameter of approximately 25 in wall units, which is consistent with previous numerical results in wall-bounded turbulent flows (Kim, Moin & Moser Reference Kim, Moin and Moser1987; Sayadi, Hamman & Moin Reference Sayadi, Hamman and Moin2013).
In the particle-laden flows, the presence of particles has remarkable effects on the size and strength of the vortical structures in the wall region. For case A with smaller particles, the second peak of the
 $\unicode[STIX]{x1D714}_{x,rms}^{\prime +}$
profile is substantially shifted towards the wall, indicating that the streamwise vortices are moved close to the wall under the effect of particles. This is in agreement with the qualitative observation in figure 15. The sweep and ejection events, generated by the rotating streamwise vortical structures, are thus displaced closer the wall compared to those in the single-phase flow. As a result, higher velocity fluid from the outer layer is transported towards the wall, which leads to the enhancement of the streamwise velocity fluctuations in the near-wall region, as shown in figure 8(a). Considering that the minimum position of
 $\unicode[STIX]{x1D714}_{x,rms}^{\prime +}$
is not significantly affected by particles, it can be inferred that the presence of particles causes a reduction in the diameter of the near-wall streamwise vortices. Moreover, the intensity of the streamwise vortices decreases monotonically with increasing particle Stokes number. In particular, the near-wall peak of
 $\unicode[STIX]{x1D714}_{x,rms}^{\prime +}$
in case B almost disappears completely. Zhao & Andersson (Reference Zhao and Andersson2011) observed a similar phenomenon in a particle-laden turbulent channel flow. In addition, the magnitude of the
 $\unicode[STIX]{x1D714}_{x,rms}^{\prime +}$
peak observed at the wall is also reduced, and the level of reduction increases with particle inertia. It should be remarked that the decrease in the value of
 $\unicode[STIX]{x1D714}_{x,rms}^{\prime +}$
in the particle-laden flows can be mainly attributed to the suppression of the fluid velocity fluctuations in the wall-normal and spanwise directions, as shown in figure 8(c,d).
Schoppa & Hussain (Reference Schoppa and Hussain2002) suggested that the wall-normal vorticity fluctuations
 $\unicode[STIX]{x1D714}_{y,rms}^{\prime +}$
attained a local maximum value at the flanks of the high- and low-speed streaks. As indicated in figure 16(d), the solid particles in case A with smaller inertia augment the wall-normal vorticity fluctuations in the near-wall region with
 $y^{+}<14$
, while the reverse is true in the region far away from the wall (
 $y^{+}>14$
). However, the vorticity fluctuations
 $\unicode[STIX]{x1D714}_{y,rms}^{\prime +}$
in case B are significantly attenuated across the entire boundary layer. For case A, the smaller particles displace the profile of
 $\unicode[STIX]{x1D714}_{y,rms}^{\prime +}$
towards the wall and increase its peak magnitude, indicating that the near-wall streaks are displaced towards the wall and the intensity of the streaks is increased, which is consistent with the displacement of the streamwise vortices, due to the fact that the near-wall streaky structures are generally created by the streamwise vortices in wall-bounded turbulent flows. On the other hand, the
 $\unicode[STIX]{x1D714}_{y,rms}^{\prime +}$
profile is slightly moved away from the wall and its peak value is reduced under the effect of particles with larger inertia
 $St=5$
. Therefore, the wall-layer streaks in case B are shifted away from the wall and their strength is reduced with respect to the single-phase flow, which results in the suppression of the near-wall streamwise turbulence intensity. It should be noted that the shifting of the coherent streaky structures in the presence of particles can explain the displacement of the
 $u_{rms}^{\prime +}$
profiles described in figure 8(a).
4.2 Streaky structures
Figure 17 presents the instantaneous contours of the streamwise velocity fluctuations
 $u^{\prime }$
in the near-wall region at
 $y^{+}=15$
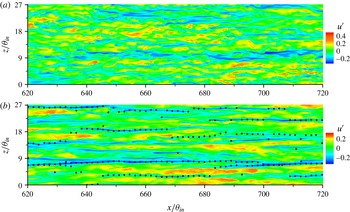
for the single-phase flow and the particle-laden flow of case B. It is apparent that the inertial solid particles tend to accumulate along the streamwise-elongated low-speed streaks, which is consistent with previous numerical and experimental results in wall-bounded flows (Ninto & Garcia Reference Ninto and Garcia1996; Rouson & Eaton Reference Rouson and Eaton2001; Marchioli & Soldati Reference Marchioli and Soldati2002). Although the alternating streaks of high- and low-speed fluid clearly exist in both the single-phase and particle-laden flows, the coherence of the streaky structures is significantly increased under the effect of particles. Furthermore, the streak spacing seems to be wider in the particle-laden flow with respect to the single-phase flow. Zhao, Andersson & Gillissen (Reference Zhao, Andersson and Gillissen2010) also observed this behaviour in a DNS of turbulent channel flow laden with spherical particles and considered it as a typical feature of drag-reduced flows, irrespective of the actual cause of drag reduction. In the pressure-driven turbulent channel flows, an increase in the mean streamwise velocity is equivalent to a reduction in the drag force. In the turbulent boundary layer flow over a flat plate, however, the increase in the mean streamwise velocity, or rather in the near-wall streamwise velocity gradient, leads to the enhancement of the skin-friction drag. This means that the increases in the coherence and spacing of the velocity streaky structures appear to be obvious features of wall-bounded flows with increased mean streamwise velocity. In fact, the addition of particles increases the streamwise extent of the near-wall low-speed streaky structures. Moreover, the high-speed streaks become wider whereas the low-speed streaks become narrower due to the presence of particles. In other words, the regions of low-speed fluid tend to be reduced while the zones of high-speed fluid seem to be increased along the spanwise direction. As a result, the mean streamwise fluid velocity is significantly increased in the particle-laden flows. In addition, it is observed from figure 17 that the particles with larger inertia
 $St=5$
produce strong damping of the intensity of the near-wall streaks, which is especially appreciable for the high-speed streaks. This is in agreement with the quantitative results reported in figure 16(d).
Instantaneous distributions of streamwise velocity fluctuations
 $u^{\prime }$
in the near-wall region at
 $y^{+}=15$
: (a) single-phase flow; (b) particle-laden flow (case B).

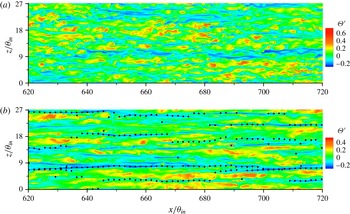
The instantaneous distributions of the temperature fluctuations
 $\unicode[STIX]{x1D6E9}^{\prime }$
are depicted in figure 18. Since the wall temperature
 $T_{w}$
is higher than the free-stream temperature
 $T_{\infty }$
, red colour represents low-temperature streaks and blue colour represents high-temperature streaks, which is exactly opposite to the velocity streaks in figure 17. With the addition of particles, the temperature streaky structures become wider and more organized, same as the velocity streaks. That is, the low-temperature regions (
 $\unicode[STIX]{x1D6E9}^{\prime }>0$
) are increased whereas the high-temperature regions (
 $\unicode[STIX]{x1D6E9}^{\prime }<0$
) are reduced, resulting in an increase in the mean dimensionless fluid temperature
 $\bar{\unicode[STIX]{x1D6E9}}$
(real temperature
 $\bar{T}$
is decreased), as shown in figure 6(b). As a consequence, the presence of small solid particles increases the near-wall temperature gradient and thus enhances the heat transfer. We can conclude here that the increases in the coherence and spacing of the streaky structures are typical features of drag and heat transfer enhancements in a spatially developing turbulent boundary layer.
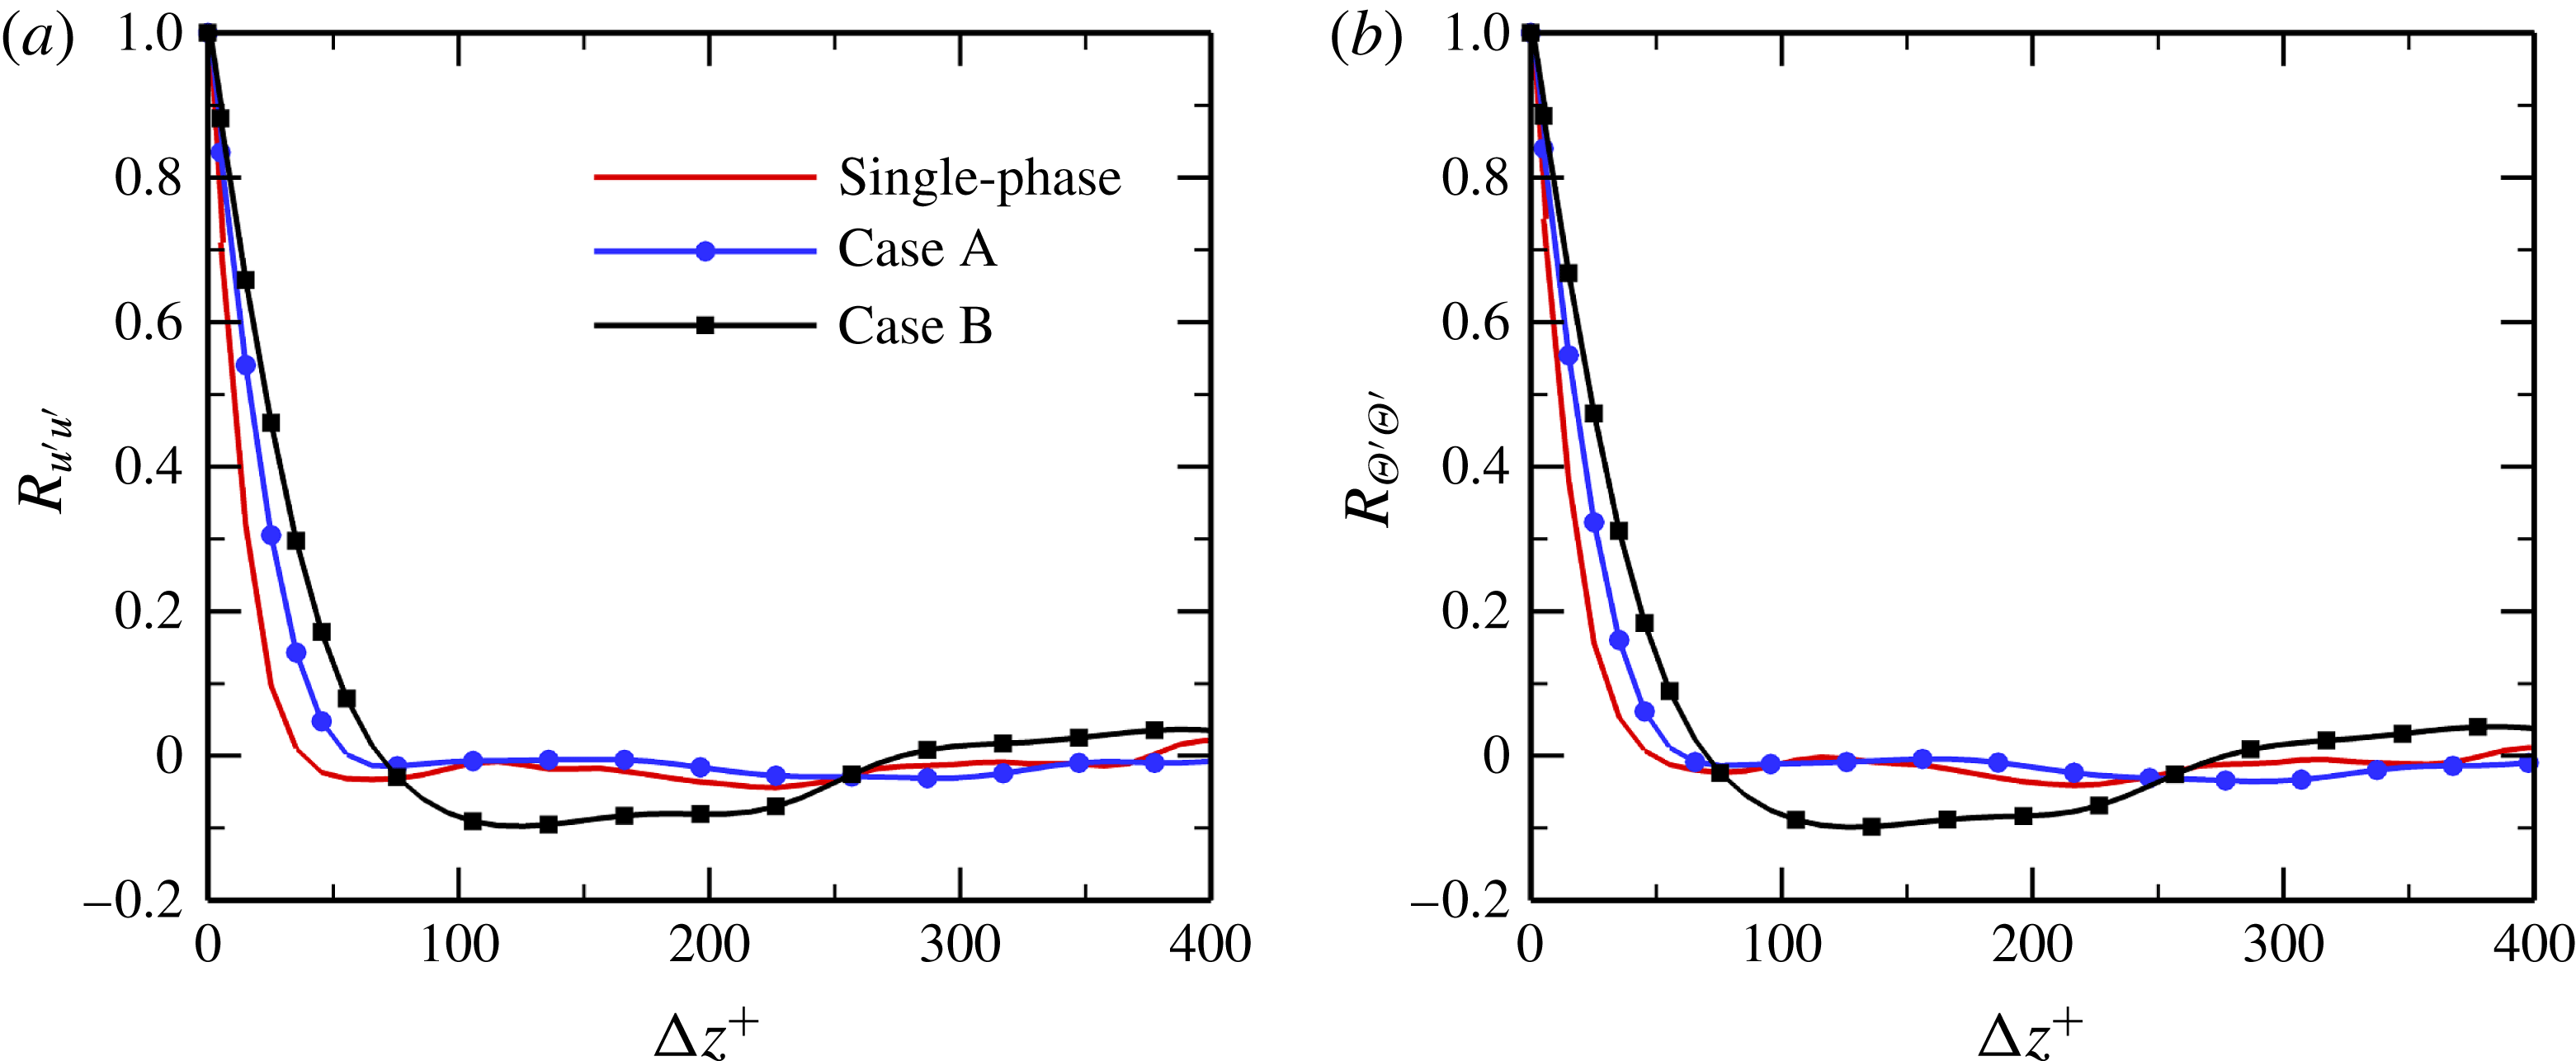
In order to investigate, from a quantitative perspective, the effect of particles on near-wall streaky structures, figure 19 respectively reports the spanwise two-point correlations of the streamwise velocity and temperature fluctuations, i.e.
 $R_{u^{\prime }u^{\prime }}$
and
 $R_{\unicode[STIX]{x1D6E9}^{\prime }\unicode[STIX]{x1D6E9}^{\prime }}$
, in the very near-wall region at
 $y^{+}=5$
. It is known that the profiles of
 $R_{u^{\prime }u^{\prime }}$
and
 $R_{\unicode[STIX]{x1D6E9}^{\prime }\unicode[STIX]{x1D6E9}^{\prime }}$
can be used to estimate the mean spacing of the streaky structures. In general, the spanwise separation at which the local minimum occurs corresponds to half the mean streak spacing in wall-bounded turbulent flows. As indicated in figure 19, both the velocity and temperature streak spacings are significantly increased under the effect of particles. Furthermore, these effects become more intense as the particle Stokes number increases. This is in agreement with the qualitative observations in figures 17 and 18. In addition, it is interesting to observe that the mean spacing of the streamwise velocity streaks is nearly the same as that of the temperature streaks in both the single-phase and particle-laden flows.
Instantaneous distributions of temperature fluctuations
 $\unicode[STIX]{x1D6E9}^{\prime }$
in the near-wall region at
 $y^{+}=15$
: (a) single-phase flow; (b) particle-laden flow (case B).

Spanwise two-point correlations of (a) streamwise velocity fluctuations and (b) temperature fluctuations in the near-wall region with
 $y^{+}=5$
at the streamwise coordinate
 $x=828\unicode[STIX]{x1D703}_{in}$
.

5 Mechanisms of turbulent heat transfer modulation by particles
As stated above, both the turbulent velocity and temperature fields and the turbulent coherent structures are significantly affected by the small solid particles in the spatially developing turbulent thermal boundary layer. In the final part of this paper, we try to explain the physical mechanisms of turbulence modulation in detail from various aspects.
5.1 Turbulent transport of heat and momentum
For the zero-pressure-gradient particle-laden turbulent thermal boundary layer, the mean streamwise momentum and heat transport equations for the continuous phase can be written in dimensionless form as
 $$\begin{eqnarray}\displaystyle & \displaystyle \underbrace{-\left(\bar{u}{\displaystyle \frac{\unicode[STIX]{x2202}\bar{u}}{\unicode[STIX]{x2202}x}}+\bar{v}{\displaystyle \frac{\unicode[STIX]{x2202}\bar{u}}{\unicode[STIX]{x2202}y}}\right)}_{A_{m}}\underbrace{+{\displaystyle \frac{1}{Re_{\unicode[STIX]{x1D703}_{in}}}}{\displaystyle \frac{\unicode[STIX]{x2202}^{2}\bar{u}}{\unicode[STIX]{x2202}y^{2}}}}_{B_{m}}\underbrace{-{\displaystyle \frac{\unicode[STIX]{x2202}\overline{u^{\prime }u^{\prime }}}{\unicode[STIX]{x2202}x}}-{\displaystyle \frac{\unicode[STIX]{x2202}\overline{u^{\prime }v^{\prime }}}{\unicode[STIX]{x2202}y}}}_{C_{m}}\underbrace{+\bar{f}_{x}}_{D_{m}}=0, & \displaystyle\end{eqnarray}$$
 $$\begin{eqnarray}\displaystyle & \displaystyle \underbrace{-\left(\bar{u}{\displaystyle \frac{\unicode[STIX]{x2202}\bar{\unicode[STIX]{x1D6E9}}}{\unicode[STIX]{x2202}x}}+\bar{v}{\displaystyle \frac{\unicode[STIX]{x2202}\bar{\unicode[STIX]{x1D6E9}}}{\unicode[STIX]{x2202}y}}\right)}_{A_{h}}\underbrace{+{\displaystyle \frac{1}{Re_{\unicode[STIX]{x1D703}_{in}}Pr}}{\displaystyle \frac{\unicode[STIX]{x2202}^{2}\bar{\unicode[STIX]{x1D6E9}}}{\unicode[STIX]{x2202}y^{2}}}}_{B_{h}}\underbrace{-{\displaystyle \frac{\unicode[STIX]{x2202}\overline{u^{\prime }\unicode[STIX]{x1D6E9}^{\prime }}}{\unicode[STIX]{x2202}x}}-{\displaystyle \frac{\unicode[STIX]{x2202}\overline{v^{\prime }\unicode[STIX]{x1D6E9}^{\prime }}}{\unicode[STIX]{x2202}y}}}_{C_{h}}\underbrace{+\bar{q}}_{D_{h}}=0, & \displaystyle\end{eqnarray}$$
where the terms on the left-hand side of (5.1) represent the negative mean advection (
 $A_{m}$
), the mean viscous force (
 $B_{m}$
), the mean effect of turbulent inertia (
 $C_{m}$
) and the mean streamwise feedback force exerted by the particles on the fluid (
 $D_{m}$
), respectively. The terms in (5.2) can be interpreted in a similar manner. It should be noted that the streamwise variations of
 $\overline{u^{\prime }u^{\prime }}$
and
 $\overline{u^{\prime }\unicode[STIX]{x1D6E9}^{\prime }}$
, i.e. the terms
 $\unicode[STIX]{x2202}\overline{u^{\prime }u^{\prime }}/\unicode[STIX]{x2202}x$
and
 $\unicode[STIX]{x2202}\overline{u^{\prime }\unicode[STIX]{x1D6E9}^{\prime }}/\unicode[STIX]{x2202}x$
, are vanishingly small and can thus be neglected in the momentum and heat transport equations. In fact, the term
 $\unicode[STIX]{x2202}\overline{u^{\prime }u^{\prime }}/\unicode[STIX]{x2202}x$
is usually omitted in previous studies (Pope Reference Pope2001; Wei et al.
Reference Wei, Fife, Klewicki and McMurtry2005; Klewicki, Ebner & Wu Reference Klewicki, Ebner and Wu2011; Sayadi et al.
Reference Sayadi, Hamman and Moin2013). The mean advection is also negligible in the fully developed turbulent region.
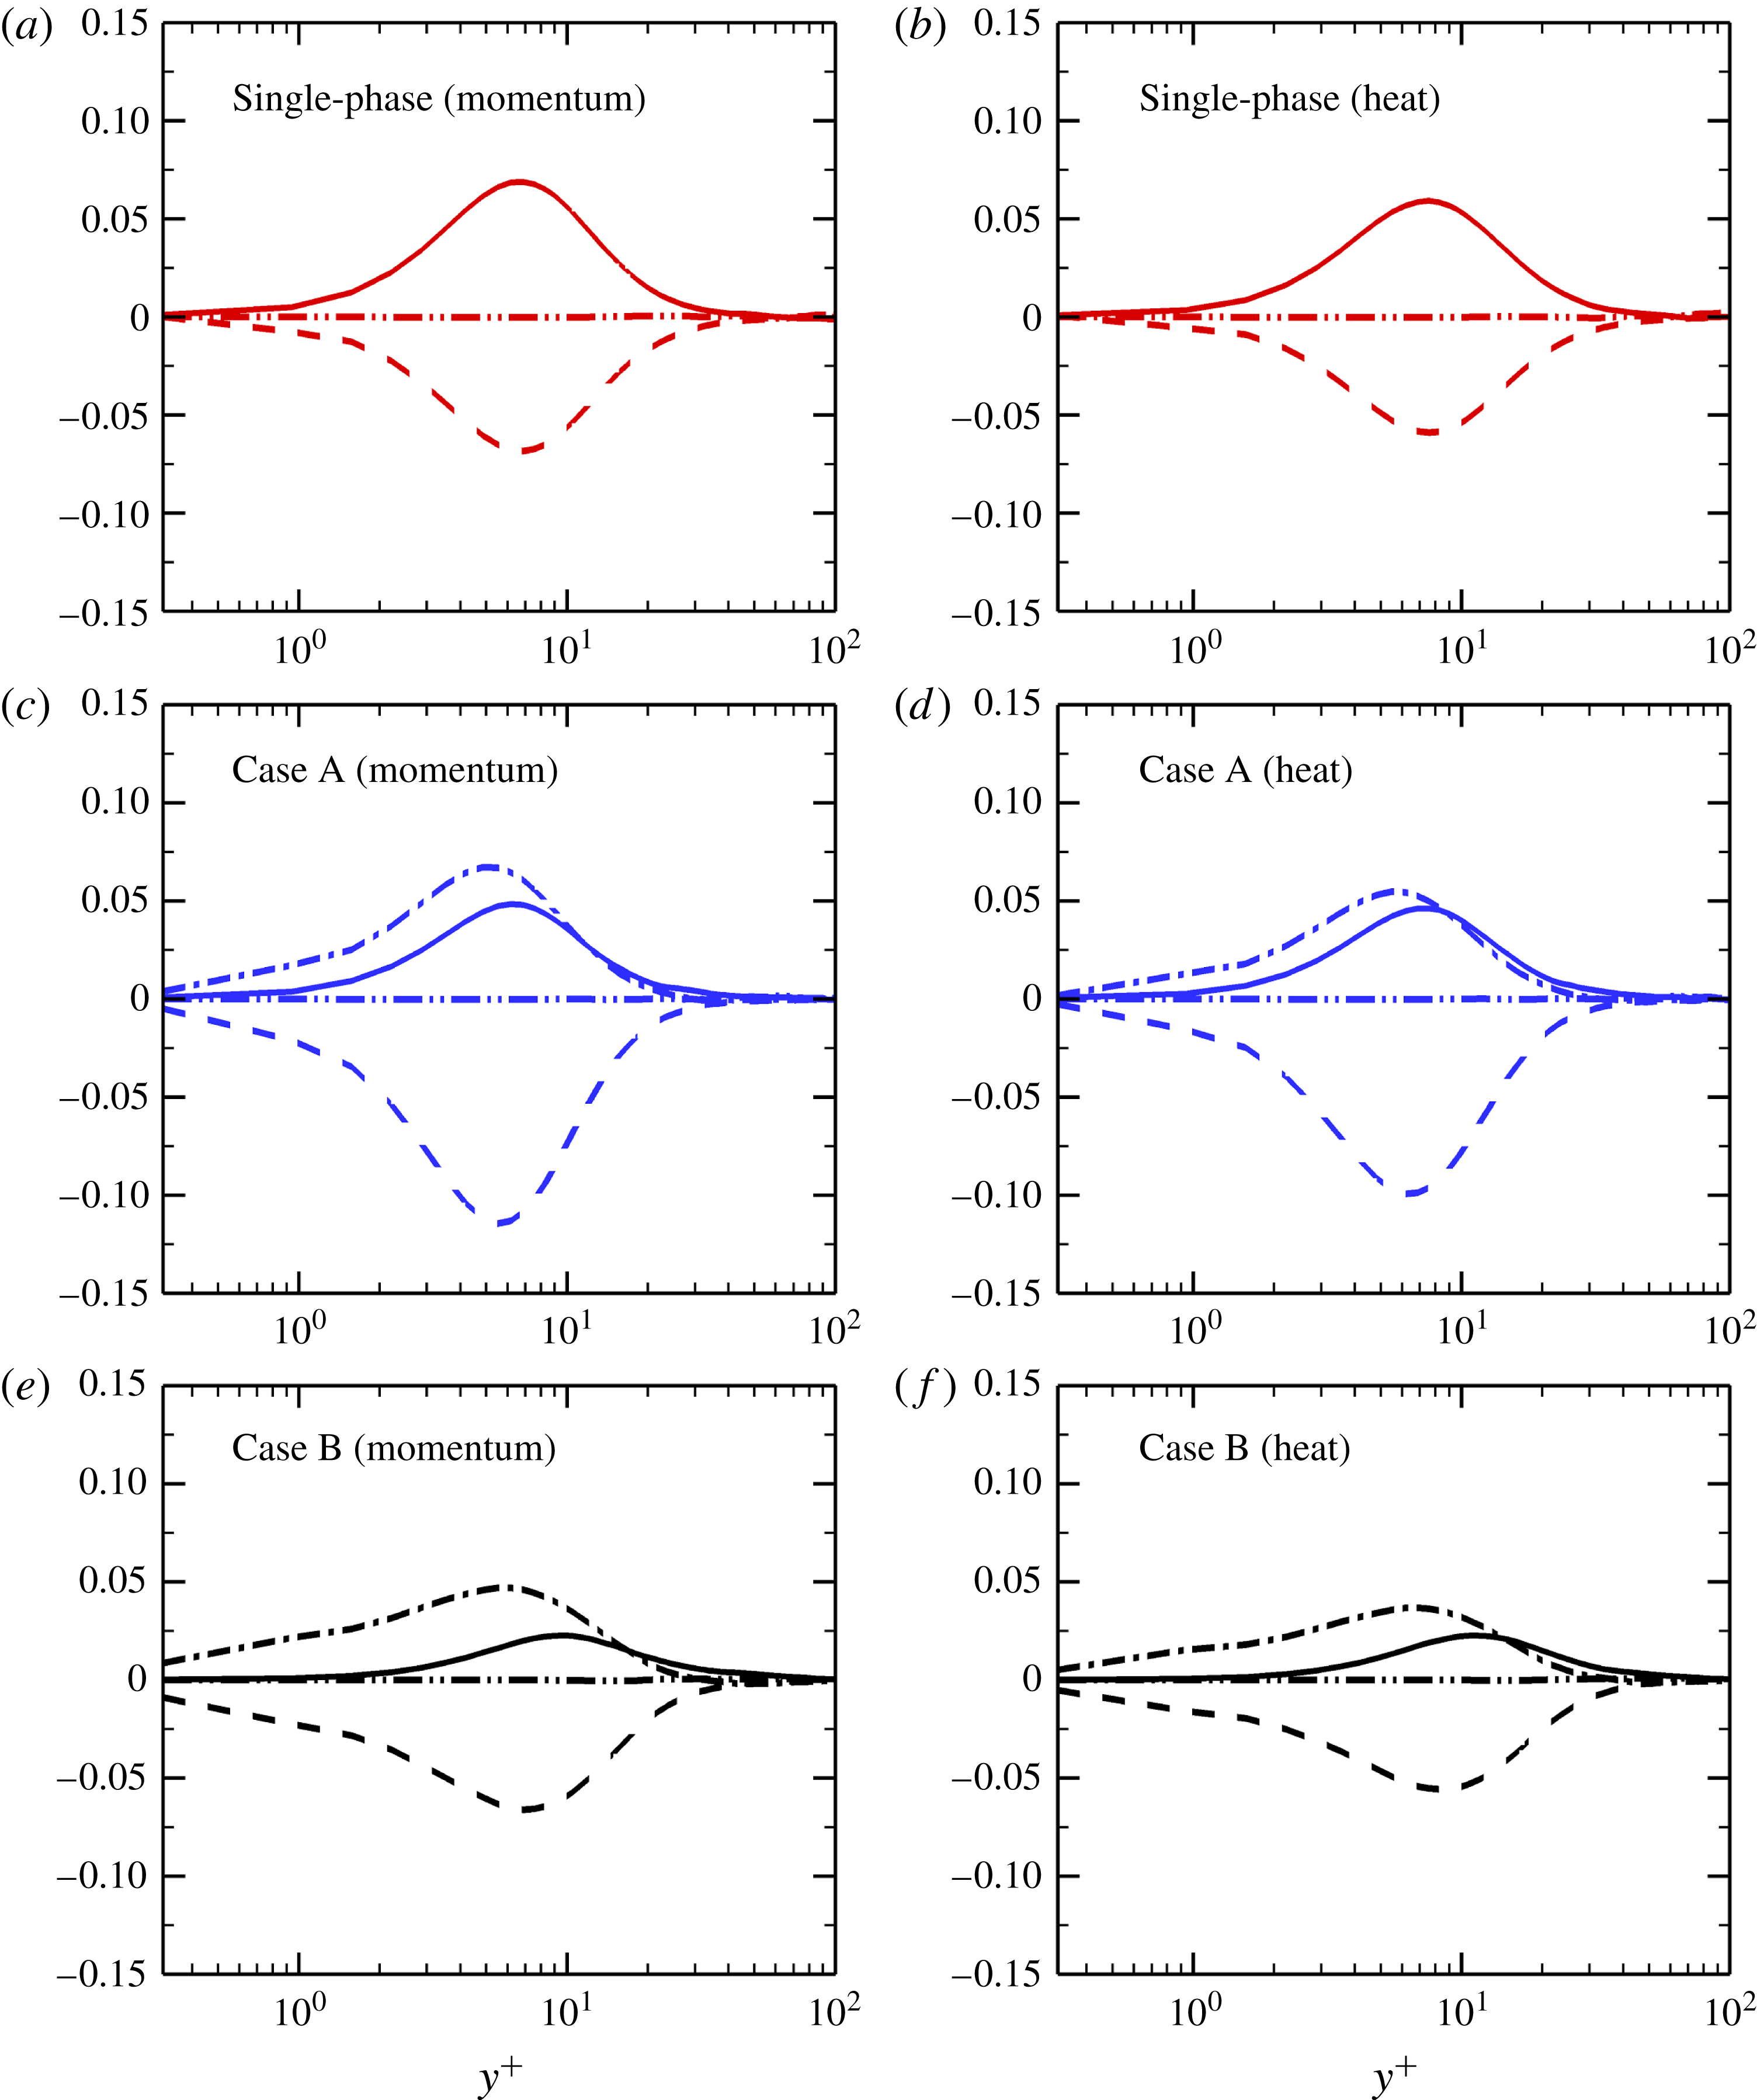
Figure 20 shows the budget terms in the mean momentum and heat transport equations for both the single-phase and particle-laden flows. For the single-phase flow, the mean viscous force
 $B_{m}$
is balanced by the mean Reynolds stress gradient
 $C_{m}$
in the momentum balance equation, while the diffusive heat flux gradient
 $B_{h}$
is balanced by the turbulent heat flux gradient
 $C_{h}$
in the heat transport equation. For the particle-laden flows, however, the gradients of the Reynolds stress and turbulent heat flux are attenuated, while the gradients of the viscous stress and diffusive heat flux are enhanced. In other words, the Reynolds stress gradient and the streamwise feedback force dominate the viscous stress gradient (viscous force), while the terms
 $C_{h}$
and
 $D_{h}$
positively sum to balance the term
 $B_{h}$
in the particle-laden flows.
Budget terms in the mean momentum (a,c,e) and (b,d,f) heat transport equations at
 $x=828\unicode[STIX]{x1D703}_{in}$
: dashed-double-dotted lines,
 $A_{m}(A_{h})$
; dashed lines,
 $B_{m}(B_{h})$
; solid lines,
 $C_{m}(C_{h})$
; dashed-single-dotted lines,
 $D_{m}(D_{h})$
.

For the dispersed phase, the mean momentum and heat transport equations can be derived based on the governing equations of the particles in § 2.2. The mean transport equations without considering collisions can be expressed in dimensionless form as
 $$\begin{eqnarray}\displaystyle & \displaystyle {\displaystyle \frac{\text{d}\bar{u}_{p}}{\text{d}t}}=\bar{F}_{x}={\displaystyle \frac{\bar{u}_{f}-\bar{u}_{p}}{St}}(1+0.15\overline{Re_{p}}^{0.687}), & \displaystyle\end{eqnarray}$$
 $$\begin{eqnarray}\displaystyle & \displaystyle {\displaystyle \frac{\text{d}\bar{\unicode[STIX]{x1D6E9}}_{p}}{\text{d}t}}=\bar{Q}={\displaystyle \frac{\overline{Nu_{p}}}{2}}{\displaystyle \frac{(\bar{\unicode[STIX]{x1D6E9}}_{f}-\bar{\unicode[STIX]{x1D6E9}}_{p})}{St_{T}}}, & \displaystyle\end{eqnarray}$$
where
 $\overline{Re_{p}}$
is the mean particle Reynolds number and
 $\overline{Nu_{p}}$
is the mean particle Nusselt number. In the two-way coupled simulations, the turbulent momentum and heat transfer are modulated by particles through the momentum coupling
 $\boldsymbol{f}$
in (2.2) and the energy-coupling term
 $q$
in (2.3), respectively. Therefore, it is meaningful to investigate the coupling terms in the particle-laden flows.
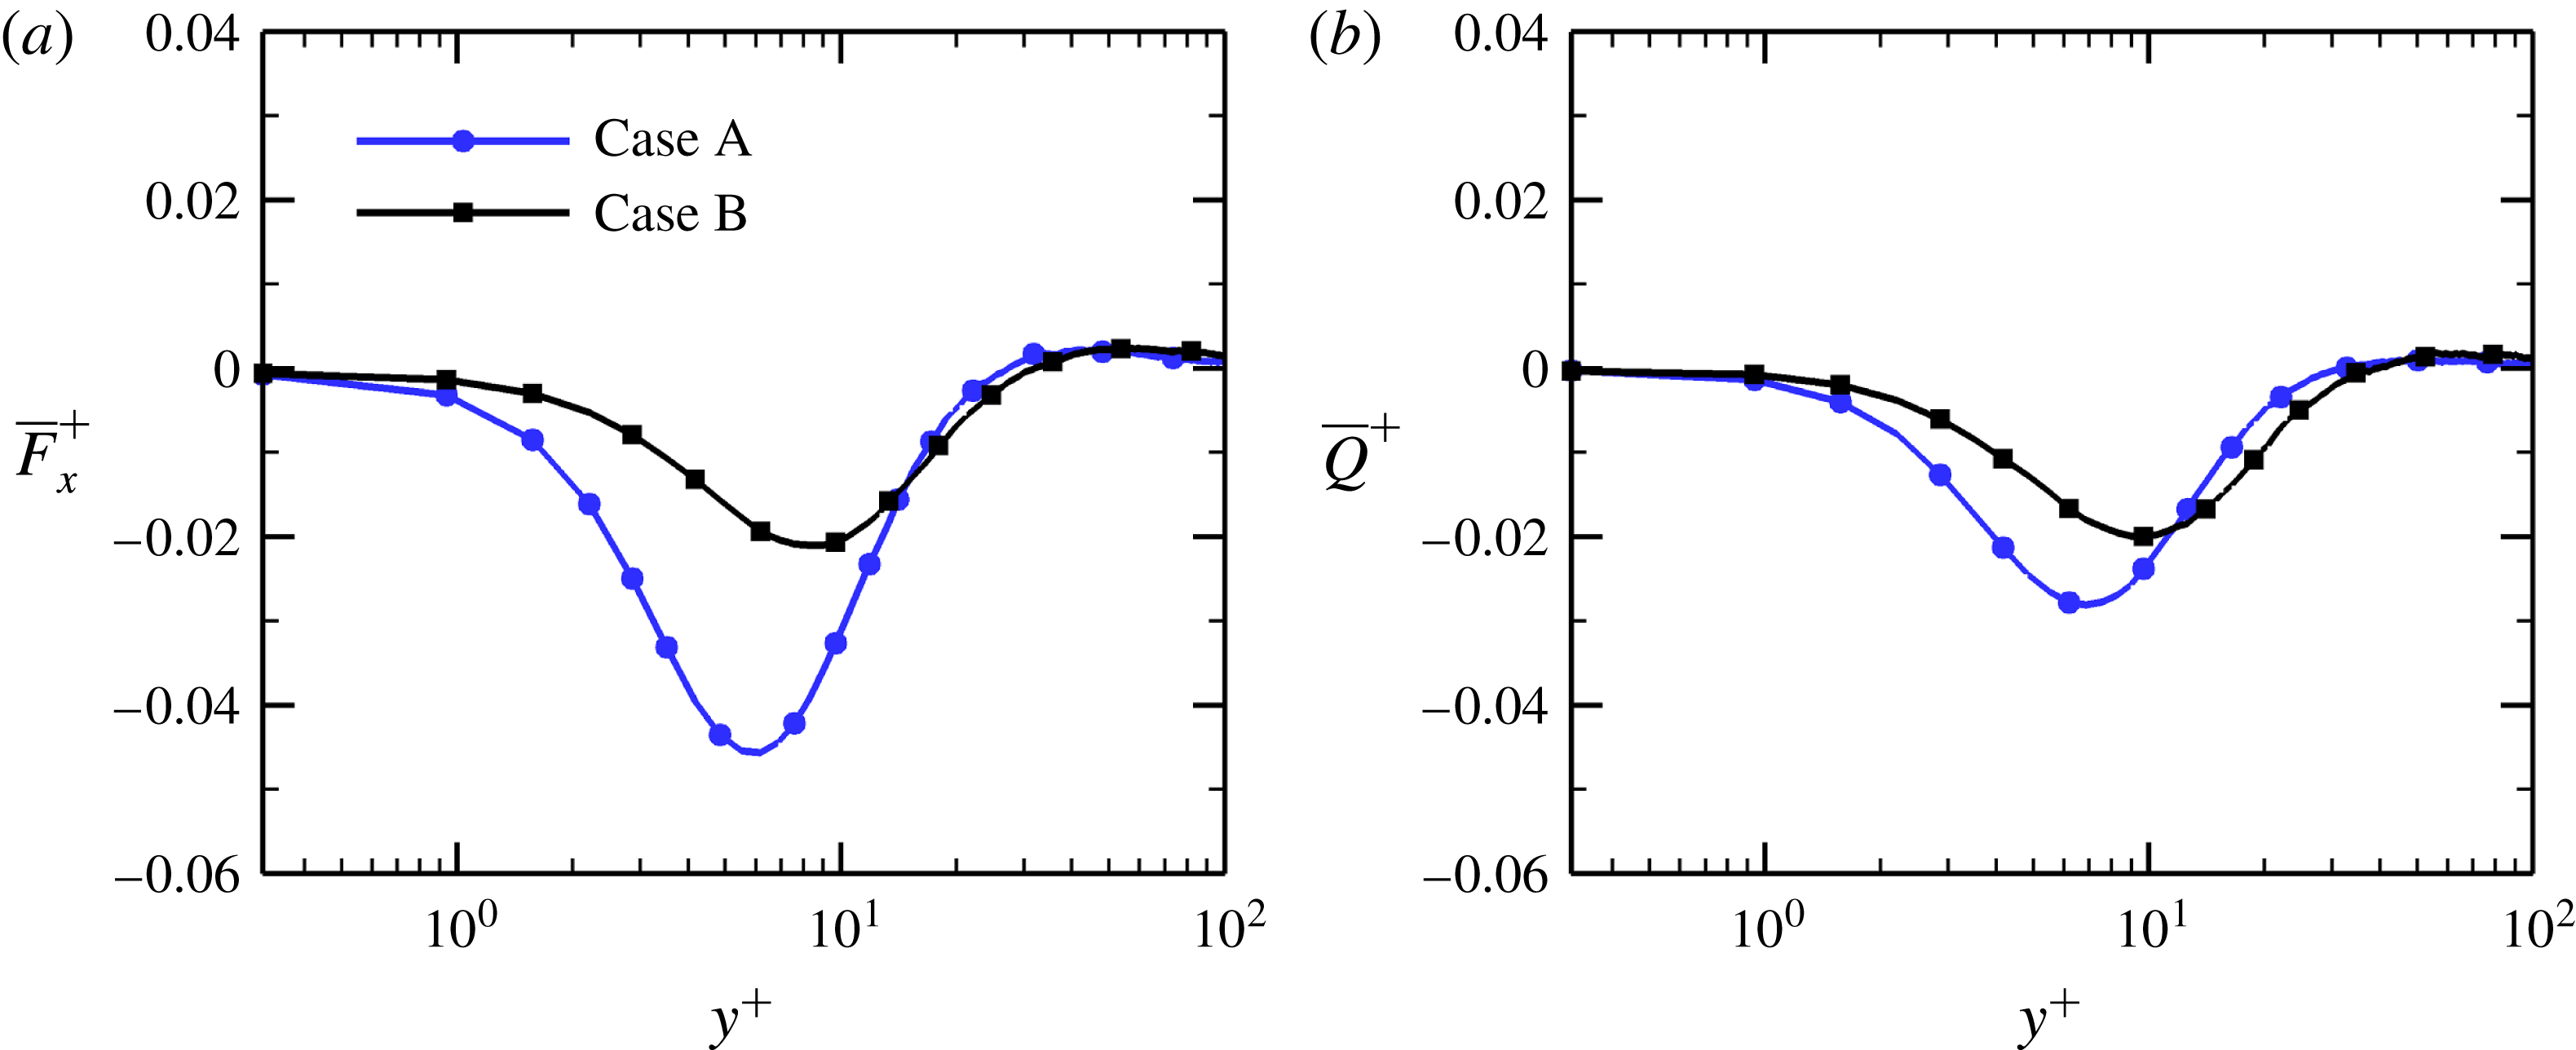
Figure 21(a) reports the streamwise component of the mean drag force acting on the particles versus the inner wall coordinate
 $y^{+}$
at
 $x=828\unicode[STIX]{x1D703}_{in}$
. Although the mean streamwise particle velocity
 $\bar{u}_{p}$
is smaller than the mean fluid velocity
 $\bar{u}$
in the near-wall region due to the particle preferential concentration in regions of low-speed fluid, pronounced negative values of the mean drag force
 $\bar{F}_{x}^{+}$
are observed in the vicinity of the wall. In fact, the inertial particles move, on average, faster than the local fluid in the viscous sublayer and buffer layer, as seen in figure 22(a). According to Newton’s third law, the mean back-reaction force on the fluid from the particles
 $\bar{f}_{x}$
should be positive (figure 20
c,e) and, consequently, the mean streamwise fluid velocity is expected to be increased in the particle-laden flows with respect to the unladen flow. Furthermore, the peak magnitude of
 $\bar{F}_{x}^{+}$
in case A is larger than that in case B. As a result, the smaller particles have a stronger effect on the near-wall streamwise fluid velocity than the larger ones (figure 6
a).
Wall-normal profiles of (a) the mean streamwise drag force acting on the particles
 $\bar{F}_{x}^{+}$
and (b) the mean heat transfer rate from fluid to particles
 $\bar{Q}^{+}$
versus the inner wall coordinate
 $y^{+}$
at
 $x=828\unicode[STIX]{x1D703}_{in}$
.

Wall-normal profiles of (a) the relative streamwise velocity and (b) the relative temperature between the particles and the local fluid at the particle position versus the inner wall coordinate
 $y^{+}$
at
 $x=828\unicode[STIX]{x1D703}_{in}$
.

As shown in figure 21(b), the mean values of the heat transfer rate from fluid to particles
 $\bar{Q}^{+}$
are negative near the wall. As a consequence, the energy-coupling term
 $\bar{q}$
attains large positive values (figure 20
d,f), since the mean particle temperature
 $\bar{\unicode[STIX]{x1D6E9}}_{p}$
is higher than the mean fluid temperature at the particle position
 $\bar{\unicode[STIX]{x1D6E9}}_{f}$
in the vicinity of the wall (figure 22
b), which can probably explain the significant increase in the dimensionless fluid temperature in the particle-laden flows (figure 6
b). As mentioned above, a higher dimensionless temperature
 $\unicode[STIX]{x1D6E9}$
represents a lower real temperature
 $T$
in the present simulations. It can be inferred that the heat is, on average, transferred from the continuous fluid to the dispersed particles in the real physical cases (
 $T_{\infty }<T_{w}$
). With respect to case B, the interphase heat transfer between particles and fluid is more significant in case A and thus the smaller particles have a more pronounced effect on the near-wall fluid temperature than the larger ones, while the opposite is true in the region far away from the wall.
In the logarithmic layer, the mean streamwise fluid velocity at the particle position
 $\bar{u}_{f}$
(conditionally averaged) is lower than the mean fluid velocity
 $\bar{u}$
(Reynolds averaged), as shown in figure 23(a), indicating that the inertial particles still tend to accumulate in the low-speed region. However, the solid particles move slower than the local fluid in the logarithmic region, i.e.
 $\bar{u}_{p}<\bar{u}_{f}$
, especially for the larger particles with
 $St=5$
, which is quite different from that in the viscous sublayer and buffer layer. This is due to the fact that the particle preferential concentration is gradually weakened as the wall-normal distance increases and a considerable number of particles tend to move towards the regions of high-speed fluid, giving rise to the increase in the local fluid velocity
 $\bar{u}_{f}$
. As a result, slightly positive values of
 $\bar{F}_{x}^{+}$
are observed in the logarithmic layer. Strictly speaking, the negative feedback force exerted by the particles on the fluid could not directly result in the decrease of the streamwise fluid velocity, but just tend to reduce the rate of change of the fluid velocity. The accumulation effect ultimately leads to the reduction of the mean streamwise velocity near the boundary layer edge, as shown in figure 6(a). The velocity boundary layer thickness is thus increased in the particle-laden flows.
Wall-normal profiles of (a) the relative streamwise velocity and (b) the relative temperature between the fluid and the local fluid at the particle position versus the inner wall coordinate
 $y^{+}$
at
 $x=828\unicode[STIX]{x1D703}_{in}$
.

5.2 Contributions to the skin-friction coefficient and Nusselt number
In order to elucidate the physical mechanisms responsible for the enhancements of the skin-friction drag and heat transfer in the particle-laden flows, it is useful to examine the various contributions to
 $C_{f}$
and
 $Nu$
according to the analytical expression firstly derived by Fukagata, Iwamoto & Kasagi (Reference Fukagata, Iwamoto and Kasagi2002) for wall-bounded turbulent flows (referred to as the FIK identity in the following). The FIK identity can quantify each dynamical contribution to the mean skin-friction drag based on the physical mechanisms of its generation and it can be obtained from the triple integration of the streamwise component of the Reynolds-averaged Navier–Stokes (RANS) equations over the wall-normal direction. Although the FIK identity has been used to analyse the mean wall shear stress in single-phase wall-bounded turbulent flows (Lee et al.
Reference Lee, Jung, Sung and Zaki2013; Deck et al.
Reference Deck, Renard, Laraufie and Weiss2014; de Giovanetti, Hwang & Choi Reference de Giovanetti, Hwang and Choi2016), there is very little research reported on the use of the FIK identity to investigate the mechanism of drag reduction/enhancement by particles in turbulent boundary layer flow.
Instead of the RANS equations, the FIK identity is modified in this study by directly applying a triple integration to the mean momentum and heat transport equations (5.1) and (5.2), since other terms in the RANS equations are negligible for turbulent boundary layer flow. Accordingly, the local skin-friction coefficient
 $C_{f}$
and the Nusselt number
 $Nu$
can be mathematically decomposed into four contributing terms as follows:
 $$\begin{eqnarray}\displaystyle C_{f} & = & \displaystyle \underbrace{{\displaystyle \frac{4}{\unicode[STIX]{x1D6FF}^{2}Re_{\unicode[STIX]{x1D703}_{in}}}}\int _{0}^{\unicode[STIX]{x1D6FF}}\bar{u}\,\text{d}y}_{C_{f,1}}\underbrace{-{\displaystyle \frac{4}{\unicode[STIX]{x1D6FF}^{2}}}\int _{0}^{\unicode[STIX]{x1D6FF}}(\unicode[STIX]{x1D6FF}-y)\overline{u^{\prime }v^{\prime }}\,\text{d}y}_{C_{f,2}}\nonumber\\ \displaystyle & & \displaystyle \times \,\underbrace{-{\displaystyle \frac{2}{\unicode[STIX]{x1D6FF}^{2}}}\int _{0}^{\unicode[STIX]{x1D6FF}}(\unicode[STIX]{x1D6FF}-y)^{2}\left(\bar{u}{\displaystyle \frac{\unicode[STIX]{x2202}\bar{u}}{\unicode[STIX]{x2202}x}}+\bar{v}{\displaystyle \frac{\unicode[STIX]{x2202}\bar{u}}{\unicode[STIX]{x2202}y}}\right)\text{d}y}_{C_{f,3}}\underbrace{+{\displaystyle \frac{2}{\unicode[STIX]{x1D6FF}^{2}}}\int _{0}^{\unicode[STIX]{x1D6FF}}(\unicode[STIX]{x1D6FF}-y)^{2}\bar{f}_{x}\,\text{d}y}_{C_{f,4}},\end{eqnarray}$$
 $$\begin{eqnarray}\displaystyle Nu & = & \displaystyle \underbrace{{\displaystyle \frac{2}{\unicode[STIX]{x1D6FF}^{t2}}}\int _{0}^{\unicode[STIX]{x1D6FF}^{t}}\bar{\unicode[STIX]{x1D6E9}}\,\text{d}y}_{Nu_{1}}\underbrace{-{\displaystyle \frac{2Re_{\unicode[STIX]{x1D703}_{in}}Pr}{\unicode[STIX]{x1D6FF}^{t2}}}\int _{0}^{\unicode[STIX]{x1D6FF}^{t}}(\unicode[STIX]{x1D6FF}-y)\overline{v^{\prime }\unicode[STIX]{x1D6E9}^{\prime }}\,\text{d}y}_{Nu_{2}}\nonumber\\ \displaystyle & & \displaystyle \underbrace{-{\displaystyle \frac{Re_{\unicode[STIX]{x1D703}_{in}}Pr}{\unicode[STIX]{x1D6FF}^{t2}}}\int _{0}^{\unicode[STIX]{x1D6FF}^{t}}(\unicode[STIX]{x1D6FF}-y)^{2}\left(\bar{u}{\displaystyle \frac{\unicode[STIX]{x2202}\bar{\unicode[STIX]{x1D6E9}}}{\unicode[STIX]{x2202}x}}+\bar{v}{\displaystyle \frac{\unicode[STIX]{x2202}\bar{\unicode[STIX]{x1D6E9}}}{\unicode[STIX]{x2202}y}}\right)\,\text{d}y}_{Nu_{3}}\underbrace{+{\displaystyle \frac{Re_{\unicode[STIX]{x1D703}_{in}}Pr}{\unicode[STIX]{x1D6FF}^{t2}}}\int _{0}^{\unicode[STIX]{x1D6FF}^{t}}(\unicode[STIX]{x1D6FF}-y)^{2}\bar{q}\,\text{d}y}_{Nu_{4}},\qquad\end{eqnarray}$$
where the terms on the right-hand side of (5.5) represent the laminar contribution (
 $C_{f,1}$
), the turbulent contribution (
 $C_{f,2}$
), the inhomogeneous contribution (
 $C_{f,3}$
) and the particle contribution (
 $C_{f,4}$
) to the mean skin-friction coefficient
 $C_{f}$
, respectively. The terms in (5.6) can be interpreted in a similar manner.
The various contributions to
 $C_{f}$
obtained from the FIK identity are reported in figure 24. It is shown that the laminar contribution
 $C_{f,1}$
remains almost unchanged under the effect of particles, irrespective of particle inertia. However, the turbulent contribution
 $C_{f,2}$
, which is a weighted integral of the Reynolds shear stress, is significantly reduced in the particle-laden flows with respect to the single-phase flow, and the level of reduction increases with particle Stokes number. This can be explained in terms of the reduction in the Reynolds shear stress
 $-\overline{u^{\prime }v^{\prime }}$
, as shown in figure 9(c). Although the contribution of the mean convection, i.e. the first term in (5.1), to the fluid momentum balance can almost be ignored in the turbulent region of the boundary layer flow (figure 20), it is interesting to observe that the integration of the mean convection, i.e. the
 $C_{f,3}$
term, plays a non-negligible role in the FIK identity. This is due to the fact that the convective term is not exactly equal to zero. In this case, the integration of the convective term can no longer be neglected. As shown in figure 24(b),
 $C_{f,3}$
decreases monotonically with increasing particle inertia. This means that the FIK terms
 $C_{f,2}$
and
 $C_{f,3}$
contribute to the drag reduction in the particle-laden flows. In the two-way coupled particle-laden flows, it is found that the presence of particles contributes largely to the enhancement of the mean skin-friction coefficient
 $C_{f}$
due to the positive feedback force
 $\bar{f}_{x}$
(figure 20
c,e). Furthermore, the particles with smaller inertia
 $St=1$
appear to make a greater contribution to
 $C_{f}$
than the larger ones with
 $St=5$
. The increase in
 $C_{f}$
due to the particle contribution
 $C_{f,4}$
exceeds the decrease due to
 $C_{f,2}$
and
 $C_{f,3}$
, which leads to the enhancement of the skin-friction drag in the particle-laden flows (figure 3
a).
Contributions to the mean skin-friction coefficient
 $C_{f}$
for the single-phase case (lines without symbols) and the particle-laden cases: A (lines with circles) and B (lines with squares). (a) Dashed lines,
 $C_{f,1}$
, solid lines,
 $C_{f,2}$
; (b) dashed lines,
 $C_{f,3}$
, solid lines,
 $C_{f,4}$
. It should be noted that all of the terms are multiplied by
 $10^{3}$
.

Figure 25 shows the componential contributions to the Nusselt number
 $Nu$
for both the single-phase and particle-laden flows. It is evident that the presence of particles significantly reduces the second and third terms
 $Nu_{2}$
and
 $Nu_{3}$
, while the first term
 $Nu_{1}$
is not obviously affected by the particles. On the other hand, the heat transfer between particles and fluid makes a large positive contribution to the Nusselt number
 $Nu$
, as shown in figure 25(b), which is responsible for the increase in
 $Nu$
reported in figure 3(b). Kuerten et al. (Reference Kuerten, van der Geld and Geurts2011) observed a similar phenomenon in a turbulent channel flow by integrating the Reynolds-averaged energy equation twice over the wall-normal coordinate. It should be pointed out that in the case of a channel flow, the third term
 $Nu_{3}$
is equal to zero due to the spatial homogeneity of the parallel flow. More importantly, our DNS results show that the triple integration of the RANS equations can yield more accurate solutions for
 $C_{f}$
and
 $Nu$
compared with the double integration (not shown).
Contributions to the Nusselt number
 $Nu$
for the single-phase case (lines without symbols) and the particle-laden cases: A (lines with circles) and B (lines with squares). (a) Dashed lines,
 $Nu_{1}$
, solid lines,
 $Nu_{2}$
; (b) dashed lines,
 $Nu_{3}$
, solid lines,
 $Nu_{4}$
. It should be noted that all of the terms are multiplied by
 $10^{3}$
.

5.3 Quadrant analysis
It is known that the generation of turbulence is strongly related to the Reynolds shear stress. Quadrant analysis of Reynolds shear stress can not only determine the relative contributions to the turbulent energy production from various events occurring in the flows, but can also provide some quantitative information on the flow events associated with these contributions, like sweep and ejection motions (Willmarth & Lu Reference Willmarth and Lu1972; Brodkey, Wallace & Eckelmann Reference Brodkey, Wallace and Eckelmann1974). The quadrant analysis classifies the Reynolds shear stress into four categories based on the signs of
 $u^{\prime }$
and
 $v^{\prime }$
: the first quadrant
 $Q_{1}$
(
 $u^{\prime }>0$
,
 $v^{\prime }>0$
); the second quadrant
 $Q_{2}$
(
 $u^{\prime }<0$
,
 $v^{\prime }>0$
), also known as ejection event; the third quadrant
 $Q_{3}$
(
 $u^{\prime }<0$
,
 $v^{\prime }<0$
); and the fourth quadrant
 $Q_{4}$
(
 $u^{\prime }>0$
,
 $v^{\prime }<0$
), referred to as the sweep event. The first and third quadrant events contribute to positive Reynolds shear stress and thus negative turbulence production, whereas the second and fourth quadrant events contribute to negative Reynolds shear stress and hence positive production. The quadrant analysis is performed in this subsection to gain a further insight into the mechanisms responsible for the damping effects on turbulence production and on turbulent coherent structures by particles.
Figure 26 shows comparisons of the fractional contributions to the Reynolds shear stress
 $-\overline{u^{\prime }v^{\prime }}^{+}$
from each quadrant between single-phase and particle-laden flows. It is interesting to observe that all contributions to
 $-\overline{u^{\prime }v^{\prime }}^{+}$
are significantly attenuated in the particle-laden flows with respect to the single-phase flow. Moreover, the level of attenuation increases with particle Stokes number. In particular, the inertial particles appear to have more pronounced effects on the
 $Q_{2}$
and
 $Q_{4}$
events than on the
 $Q_{1}$
and
 $Q_{3}$
events. Therefore, the sweep and ejection motions are substantially dampened by the small solid particles, leading to the reduction in the Reynolds shear stress. As a consequence, the turbulence energy production is suppressed in the particle-laden flows. Given that the sweep and ejection events are generated by the near-wall streamwise vortices due to their strong rotational motion, it can be inferred that the presence of particles tends to damp the intensity of the streamwise vortical structures, which is in agreement with the quantitative results shown in figure 16(c).
Comparison of quadrant analysis of the Reynolds shear stress
 $-\overline{u^{\prime }v^{\prime }}^{+}$
between single-phase and particle-laden flows in the turbulent region at
 $x=828\unicode[STIX]{x1D703}_{in}$
: (a)
 $Q_{1}$
; (b)
 $Q_{2}$
; (c)
 $Q_{3}$
; (d)
 $Q_{4}$
. All terms are normalized by
 $u_{\unicode[STIX]{x1D70F}}^{2}$
.

Probability distributions of the Reynolds shear stress from each quadrant in the single-phase flow at
 $x=828\unicode[STIX]{x1D703}_{in}$
. (a) Dashed line,
 $P_{1}$
; solid line,
 $P_{2}$
; dashed-double-dotted line,
 $P_{3}$
; dashed-single-dotted line,
 $P_{4}$
. (b) Line with circles,
 $P_{2}+P_{4}$
; line with triangles,
 $P_{1}+P_{3}$
.

Although all of the four quadrant events contribute to the Reynolds stress, these are quite different in intensity and occurrence frequency among the quadrants. In order to further examine the effect of quadrant events on turbulence, figure 27(a) shows the probability distributions of the Reynolds shear stress from each quadrant for the single-phase flow. The probability of an event in the
 $i$
th quadrant,
 $P_{i}$
, is defined as
 $$\begin{eqnarray}P_{i}={\displaystyle \frac{N_{i}}{N}},\quad i=1,2,3,4,\end{eqnarray}$$
where
 $N_{i}$
is the number of events in the
 $i$
th quadrant and
 $N$
is the total number of events in all quadrants,
 $N=30\,000$
. In the near-wall region, the sweep event (
 $Q_{4}$
) occurs less frequently than the ejection event (
 $Q_{2}$
), i.e.
 $P_{4}<P_{2}$
, although the sweep motion is more intense than the ejection motion near the wall. Far away from the wall, however, the probability of the sweep event is almost identical to that of the ejection event. Compared with the
 $Q_{2}$
and
 $Q_{4}$
events, the
 $Q_{1}$
and
 $Q_{3}$
events occur with lower frequency and lower intensity. In addition, it is interesting to observe that the probability distributions of the
 $Q_{1}$
and
 $Q_{2}$
events tend to be symmetric about
 $P=0.25$
, as do the
 $Q_{3}$
and
 $Q_{4}$
events. Figure 27(b) further investigates the relationship between the sum of
 $P_{2}+P_{4}$
and that of
 $P_{1}+P_{3}$
. As expected, the distributions of
 $P_{2}+P_{4}$
and the profiles of
 $P_{1}+P_{3}$
are approximately symmetric with respect to
 $P=0.5$
. Furthermore, in the logarithmic layer, the total probabilities of the sweep and ejection events are approximately
 $65\,\%$
, while the
 $Q_{1}$
and
 $Q_{3}$
events occur with a nearly constant probability of
 $35\,\%$
.
Comparison of probability distributions of the Reynolds shear stress from each quadrant between single-phase and particle-laden flows in the turbulent region at
 $x=828\unicode[STIX]{x1D703}_{in}$
: (a)
 $P_{1}$
; (b)
 $P_{2}$
; (c)
 $P_{3}$
; (d)
 $P_{4}$
.

Comparison of quadrant analysis of the wall-normal heat flux
 $-\overline{v^{\prime }\unicode[STIX]{x1D6E9}^{\prime }}^{+}$
between single-phase and particle-laden flows in the turbulent region at
 $x=828\unicode[STIX]{x1D703}_{in}$
: (a)
 $Q_{1}$
; (b)
 $Q_{2}$
; (c)
 $Q_{3}$
; (d)
 $Q_{4}$
. All terms are normalized by
 $u_{\unicode[STIX]{x1D70F}}\unicode[STIX]{x1D6E9}_{\unicode[STIX]{x1D70F}}$
.

In the particle-laden flows, the presence of particles has a remarkable effect on the probability distributions of the quadrant events, as shown in figure 28. In general, as the particle Stokes number increases, the probabilities of the
 $Q_{1}$
and
 $Q_{4}$
events, i.e.
 $P_{1}$
and
 $P_{4}$
, are gradually increased; while
 $P_{2}$
and
 $P_{3}$
are progressively decreased in the vicinity of the wall. This means that the small solid particles increase the likelihood that the events associated with
 $u^{\prime }>0$
occur, whereas they reduce the probability of events with
 $u^{\prime }<0$
. We can therefore, from the perspective of probability and statistics, infer that the mean streamwise fluid velocity is enhanced in the particle-laden flows compared with unladen flow (figure 6
a). It should be pointed out that the inertial particles have an almost negligible effect on the total probabilities of the sweep and ejection events, despite the obvious change in each quadrant event.
In an analogous way, figure 29 reports the quadrant analysis of the wall-normal turbulent heat flux
 $-\overline{v^{\prime }\unicode[STIX]{x1D6E9}^{\prime }}^{+}$
in the turbulent region at
 $x=828\unicode[STIX]{x1D703}_{in}$
. At each point, the wall-normal heat flux is separated into four parts according to the signs of
 $\unicode[STIX]{x1D6E9}^{\prime }$
and
 $v^{\prime }$
. It is expected that, like the fractional contributions to
 $-\overline{u^{\prime }v^{\prime }}^{+}$
, the contributions to
 $-\overline{v^{\prime }\unicode[STIX]{x1D6E9}^{\prime }}^{+}$
from all of the four quadrants decrease monotonically with increasing particle inertia, which leads to the suppression of the wall-normal heat flux, as previously shown in figure 9(b).
Comparison of probability distributions of the wall-normal heat flux from each quadrant between single-phase and particle-laden flows in the turbulent region at
 $x=828\unicode[STIX]{x1D703}_{in}$
: (a)
 $P_{1}$
; (b)
 $P_{2}$
; (c)
 $P_{3}$
; (d)
 $P_{4}$
.

The probability distributions of the wall-normal heat flux from each quadrant are displayed in figure 30. The presence of particles increases the probabilities of the first and fourth quadrant events whereas reduces those of the second and third events, with these effects becoming more pronounced as the particle Stokes number increases. This indicates that the flow events with
 $\unicode[STIX]{x1D6E9}^{\prime }>0$
occur more frequently in the particle-laden flows with respect to the single-phase flow, while the opposite is true for the
 $\unicode[STIX]{x1D6E9}^{\prime }<0$
events. As a result, the mean fluid temperature
 $\bar{\unicode[STIX]{x1D6E9}}$
is significantly increased (figure 6
b).
5.4 Turbulence budget
As discussed above, the presence of inertial particles attenuates the Reynolds shear stress and wall-normal heat flux, which leads to reductions in the productions of the turbulent kinetic energy (TKE) and the temperature fluctuations. Nevertheless, the effect of particles on the energy dissipation remains unknown. In this subsection, we investigate the mechanisms of turbulent heat transfer modulation from an energetic viewpoint by analysing the turbulent transport process occurring within the flow. For an incompressible fluid in a zero-pressure-gradient particle-laden turbulent thermal boundary layer, the transport equations for the TKE,
 $k=\overline{u_{i}^{\prime }u_{i}^{\prime }}/2$
, and the temperature variance,
 $k_{\unicode[STIX]{x1D6E9}}=\overline{\unicode[STIX]{x1D6E9}^{\prime 2}/2}$
, can be respectively expressed in Cartesian tensor notation as
 $$\begin{eqnarray}\displaystyle {\displaystyle \frac{\unicode[STIX]{x2202}k}{\unicode[STIX]{x2202}t}}\underbrace{+\,\bar{u}_{j}{\displaystyle \frac{\unicode[STIX]{x2202}k}{\unicode[STIX]{x2202}x_{j}}}}_{C_{k}} & = & \displaystyle \underbrace{-\overline{u_{i}^{\prime }u_{j}^{\prime }}{\displaystyle \frac{\unicode[STIX]{x2202}\bar{u}_{i}}{\unicode[STIX]{x2202}x_{j}}}}_{P_{k}}\underbrace{-{\displaystyle \frac{1}{2}}{\displaystyle \frac{\unicode[STIX]{x2202}\left(\overline{u_{j}^{\prime }u_{i}^{\prime }u_{i}^{\prime }}\right)}{\unicode[STIX]{x2202}x_{j}}}}_{T_{k}}\underbrace{-{\displaystyle \frac{1}{Re_{\unicode[STIX]{x1D703}_{in}}}}\overline{{\displaystyle \frac{\unicode[STIX]{x2202}u_{i}^{\prime }}{\unicode[STIX]{x2202}x_{j}}}{\displaystyle \frac{\unicode[STIX]{x2202}u_{i}^{\prime }}{\unicode[STIX]{x2202}x_{j}}}}}_{\unicode[STIX]{x1D700}_{k}}\underbrace{-{\displaystyle \frac{\unicode[STIX]{x2202}\left(\overline{p^{\prime }u_{j}^{\prime }}\right)}{\unicode[STIX]{x2202}x_{j}}}}_{\unicode[STIX]{x1D6F1}_{k}}\underbrace{+{\displaystyle \frac{1}{Re_{\unicode[STIX]{x1D703}_{in}}}}{\displaystyle \frac{\unicode[STIX]{x2202}^{2}k}{\unicode[STIX]{x2202}x_{j}\unicode[STIX]{x2202}x_{j}}}}_{D_{k}}\nonumber\\ \displaystyle & & \displaystyle \underbrace{+\overline{u_{j}^{\prime }f_{j}^{\prime }}}_{S_{k}},\end{eqnarray}$$
 $$\begin{eqnarray}\displaystyle {\displaystyle \frac{\unicode[STIX]{x2202}k_{\unicode[STIX]{x1D6E9}}}{\unicode[STIX]{x2202}t}}\underbrace{+\bar{u}_{j}{\displaystyle \frac{\unicode[STIX]{x2202}k_{\unicode[STIX]{x1D6E9}}}{\unicode[STIX]{x2202}x_{j}}}}_{C_{\unicode[STIX]{x1D6E9}}} & = & \displaystyle \underbrace{-\overline{u_{j}^{\prime }\unicode[STIX]{x1D6E9}^{\prime }}{\displaystyle \frac{\unicode[STIX]{x2202}\bar{\unicode[STIX]{x1D6E9}}}{\unicode[STIX]{x2202}x_{j}}}}_{P_{\unicode[STIX]{x1D6E9}}}\underbrace{-{\displaystyle \frac{1}{2}}{\displaystyle \frac{\unicode[STIX]{x2202}\left(\overline{u_{j}^{\prime }{\unicode[STIX]{x1D6E9}^{\prime }}^{2}}\right)}{\unicode[STIX]{x2202}x_{j}}}}_{T_{\unicode[STIX]{x1D6E9}}}\underbrace{-{\displaystyle \frac{1}{Re_{\unicode[STIX]{x1D703}_{in}}Pr}}\overline{{\displaystyle \frac{\unicode[STIX]{x2202}\unicode[STIX]{x1D6E9}^{\prime }}{\unicode[STIX]{x2202}x_{j}}}{\displaystyle \frac{\unicode[STIX]{x2202}\unicode[STIX]{x1D6E9}^{\prime }}{\unicode[STIX]{x2202}x_{j}}}}}_{\unicode[STIX]{x1D700}_{\unicode[STIX]{x1D6E9}}}\underbrace{+{\displaystyle \frac{1}{Re_{\unicode[STIX]{x1D703}_{in}}Pr}}{\displaystyle \frac{\unicode[STIX]{x2202}^{2}k_{\unicode[STIX]{x1D6E9}}}{\unicode[STIX]{x2202}x_{j}\unicode[STIX]{x2202}x_{j}}}}_{D_{\unicode[STIX]{x1D6E9}}}\nonumber\\ \displaystyle & & \displaystyle \underbrace{+\overline{q^{\prime }\unicode[STIX]{x1D6E9}^{\prime }}}_{S_{\unicode[STIX]{x1D6E9}}},\end{eqnarray}$$
where the term on the left-hand side of (5.8) is the mean convection
 $(C_{k})$
; the terms on the right-hand side of (5.8) represent the production
 $(P_{k})$
, turbulent diffusion
 $(T_{k})$
, viscous dissipation
 $(\unicode[STIX]{x1D700}_{k})$
, pressure diffusion
 $(\unicode[STIX]{x1D6F1}_{k})$
, viscous diffusion
 $(D_{k})$
and particle-induced terms
 $(S_{k})$
, respectively. The terms in (5.9) can be interpreted in a similar manner to (5.8). The mean convection term is almost zero and can be neglected since the boundary layer flow considered in this paper is statistically steady.
The various terms in the budget of the TKE are reported in figure 31. It can be seen that all of the non-zero budget terms are strongly affected by the particles. The production term
 $P_{k}$
is significantly reduced across the entire boundary layer in the particle-laden flows with respect to the unladen flow, with the degree of reduction increasing monotonically with particle inertia. For the turbulent boundary layer flow,
 $P_{k}\approx -\overline{u^{\prime }v^{\prime }}\text{d}\bar{u}/\text{d}y$
, the damping of the energy production term can be mainly attributed to the attenuation of the Reynolds shear stress. On the other hand, the viscous dissipation term
 $\unicode[STIX]{x1D700}_{k}$
is substantially increased in the near-wall region whereas it is slightly decreased in the outer layer for case A with smaller inertial particles
 $St=1$
. Nevertheless, the particles with larger inertia
 $St=5$
obviously damp the viscous dissipation rate of the TKE throughout the whole boundary layer, as shown in figure 31(b).
Turbulent kinetic energy budget in the turbulent region at
 $x=828\unicode[STIX]{x1D703}_{in}$
: (a) production term
 $P_{k}$
; (b) viscous dissipation term
 $\unicode[STIX]{x1D700}_{k}$
; (c) turbulent diffusion term
 $T_{k}$
; (d) viscous diffusion term
 $D_{k}$
; (e) pressure diffusion term
 $\unicode[STIX]{x1D6F1}_{k}$
; (f) particle-induced term
 $S_{k}$
. All terms are normalized by
 $u_{\unicode[STIX]{x1D70F}}^{4}/\unicode[STIX]{x1D708}$
.

In wall-bounded turbulent flows, the turbulent, viscous and pressure diffusion terms are responsible for transporting the TKE from the buffer layer to the viscous sublayer. With the addition of particles, the magnitude of the turbulent diffusion
 $T_{k}$
decreases monotonically with increasing particle inertia, as a consequence of turbulence attenuation. In the close vicinity of the wall, the viscous diffusion term
 $D_{k}$
plays a much more important role in the energy transport than the turbulent diffusion
 $T_{k}$
. In order to maintain the energy balance, the increase in the viscous dissipation rate for case A means that more energy is required to be transferred to the very near-wall region from the outer layer. In other words, the smaller particles with
 $St=1$
enhance the transport of near-wall turbulent energy and thus the magnitude of
 $D_{k}$
is obviously increased in the near-wall region. The decrease in
 $D_{k}$
for case B can be explained in a similar manner. The pressure diffusion term
 $\unicode[STIX]{x1D6F1}_{k}$
, shown in figure 31(e), attains positive values in the region very close to the wall, whereas it is vanishingly small in the outer region of the boundary layer. As the particle Stokes number increases, the peak value of
 $\unicode[STIX]{x1D6F1}_{k}$
is gradually decreased.
It should be pointed out that the diffusion terms in the TKE transport equation have no effect on the enhancement or suppression of turbulence, just being responsible for turbulence transport. On the other hand, the production and energy dissipation terms play significant roles in the variation of TKE. In addition, the interactions between particles and fluid have also a significant impact on the TKE in the particle-laden flows. As shown in figure 31(f), the particle–fluid interactions produce an extra positive production of TKE, i.e. a particle-induced energy source term
 $S_{k}$
with the same order of magnitude as the production and dissipation terms in the near-wall region. This is different from the numerical results of Li et al. (Reference Li, McLaughlin, Kontomaris and Portela2001) and Vreman (Reference Vreman2015) for particle-laden channel flows, in which the particle-induced term is relatively small compared with the largest terms. In fact, the energy production term
 $P_{k}$
is caused by the interactions between the Reynolds stress components
 $\overline{u_{i}^{\prime }u_{j}^{\prime }}$
and the mean fluid velocity gradients
 $\unicode[STIX]{x2202}\bar{u}_{i}/\unicode[STIX]{x2202}x_{j}$
, while
 $S_{k}$
is produced by the interactions between the fluctuating fluid velocity and the fluctuating feedback force. The particle-induced term
 $S_{k}$
represents a local source or sink of turbulent energy. Although
 $S_{k}$
is reported to be a negative value and thus leads to turbulence attenuation in isotropic turbulence (Elghobashi & Truesdell Reference Elghobashi and Truesdell1993; Boivin, Simonin & Squires Reference Boivin, Simonin and Squires1998), the present simulation results indicate that the interactions between inertial particles and fluid turbulence lead to an additional source of the TKE and
 $S_{k}$
is therefore positive. Furthermore, it is found that the presence of particles with smaller inertia
 $St=1$
gives rise to a higher peak value of
 $S_{k}$
with respect to the larger particles
 $St=5$
.
Wall-normal profiles of the total production,
 $P_{k}+S_{k}$
, in inner wall units at
 $x=828\unicode[STIX]{x1D703}_{in}$
.

The TKE budget highlights a surprising feature regarding the production. Despite the strong turbulence attenuation in the particle-laden flows, the particle–fluid interactions induce an extra energy source. To provide further insight into the energy transport, figure 32 shows the wall-normal profiles of the total production,
 $P_{k}+S_{k}$
, in inner wall units at
 $x=828\unicode[STIX]{x1D703}_{in}$
. In the near-wall region, the total source of the TKE is significantly increased in case A compared with the single-phase flow. On the other hand, the viscous energy dissipation is also enhanced in the vicinity of the wall for case A with smaller inertial particles (figure 31
b). The combination of these two effects causes a slight increase in the near-wall TKE, as shown in figure 33. In the region far from the wall, however, the presence of particles attenuates the total production terms
 $P_{k}+S_{k}$
, which leads to strong damping of the TKE. For case B, the peak magnitude of
 $P_{k}+S_{k}$
is substantially reduced under the effect of particles with larger inertia
 $St=5$
. The combined effect of distinctly reduced energy production and damped viscous dissipation results in large suppression of the TKE throughout the whole boundary layer.
Wall-normal profiles of the fluid turbulent kinetic energy at
 $x=828\unicode[STIX]{x1D703}_{in}$
.

Similarly, the budget of the temperature variance is reported in figure 34 using the inner wall units at
 $x=828\unicode[STIX]{x1D703}_{in}$
. Since there exists a strong similarity between the velocity and temperature fields, it is expected that the distributions of the budget terms in (5.9) exhibit similar characteristics to those in (5.8). The production term of the temperature variance
 $P_{\unicode[STIX]{x1D6E9}}$
decreases monotonically with increasing particle inertia, which can be explained in terms of the attenuation of the wall-normal heat flux by particles due to
 $P_{\unicode[STIX]{x1D6E9}}\approx -\overline{v^{\prime }\unicode[STIX]{x1D6E9}^{\prime }}\text{d}\bar{\unicode[STIX]{x1D6E9}}/\text{d}y$
. As a result, the heat transport by the turbulent diffusion
 $T_{\unicode[STIX]{x1D6E9}}$
from the buffer layer to the wall region is significantly inhibited in the particle-laden flows; see figure 34(c). The smaller particles with
 $St=1$
(case A) increase the temperature variance dissipation
 $\unicode[STIX]{x1D700}_{\unicode[STIX]{x1D6E9}}$
and thus enhance the near-wall heat transport by the viscous diffusion
 $D_{\unicode[STIX]{x1D6E9}}$
, while the opposite is true for the particles with larger inertia
 $St=5$
(case B). It is interesting to observe in figure 34(e) that the particle-induced term
 $S_{\unicode[STIX]{x1D6E9}}$
is positive, like the extra energy source
 $S_{k}$
, indicating that the particle–fluid interactions give rise to an additional source of the temperature variance. The augmentation of the temperature fluctuations for case A in the near-wall region, as shown in figure 8(b), can be explained by the obvious increase in the total production terms
 $P_{\unicode[STIX]{x1D6E9}}+S_{\unicode[STIX]{x1D6E9}}$
in figure 34(f). It is worth noting that both the peaks of
 $S_{\unicode[STIX]{x1D6E9}}$
and
 $S_{k}$
are located in the buffer layer, indicating that the exchanges of turbulent momentum and heat between particles and fluid are strongest in this region.
Temperature variance budget in the turbulent region at
 $x=828\unicode[STIX]{x1D703}_{in}$
: (a) production term
 $P_{\unicode[STIX]{x1D6E9}}$
; (b) dissipation term
 $\unicode[STIX]{x1D700}_{\unicode[STIX]{x1D6E9}}$
; (c) turbulent diffusion term
 $T_{\unicode[STIX]{x1D6E9}}$
; (d) viscous diffusion term
 $D_{\unicode[STIX]{x1D6E9}}$
; (e) particle-induced term
 $S_{\unicode[STIX]{x1D6E9}}$
; (f)
 $P_{\unicode[STIX]{x1D6E9}}+S_{\unicode[STIX]{x1D6E9}}$
. All terms are normalized by
 $u_{\unicode[STIX]{x1D70F}}^{2}\unicode[STIX]{x1D6E9}_{\unicode[STIX]{x1D70F}}^{2}/\unicode[STIX]{x1D708}$
.

In order to further investigate the mechanisms of turbulence modulation in the three different directions, we consider the transport equation for the second moments of the fluid velocity fluctuations
 $\overline{u_{i}^{\prime }u_{j}^{\prime }}$
in the particle-laden turbulent boundary layer:
 $$\begin{eqnarray}P_{ij}+\unicode[STIX]{x1D700}_{ij}+D_{ij}+\unicode[STIX]{x1D6F7}_{ij}+S_{ij}=0,\end{eqnarray}$$
where
 $P_{ij}$
is the turbulence production,
 $\unicode[STIX]{x1D700}_{ij}$
is the viscous dissipation,
 $D_{ij}$
is the sum of the turbulent, pressure and viscous diffusions,
 $\unicode[STIX]{x1D6F7}_{ij}$
is the pressure–strain correlation and
 $S_{ij}$
is the additional source or sink term due to the presence of particles. The convection term
 $C_{ij}$
is vanishingly small and not considered here. In the present study, particular emphasis is put on the production term
 $P_{ij}$
and the particle-induced term
 $S_{ij}$
, which are believed to play significant roles in (5.10). They are expressed as
 $$\begin{eqnarray}\displaystyle & \displaystyle P_{ij}=-\overline{u_{i}^{\prime }u_{k}^{\prime }}{\displaystyle \frac{\unicode[STIX]{x2202}\bar{u}_{j}}{\unicode[STIX]{x2202}x_{k}}}-\overline{u_{j}^{\prime }u_{k}^{\prime }}{\displaystyle \frac{\unicode[STIX]{x2202}\bar{u}_{i}}{\unicode[STIX]{x2202}x_{k}}}, & \displaystyle\end{eqnarray}$$
 $$\begin{eqnarray}\displaystyle & \displaystyle S_{ij}=\overline{u_{i}^{\prime }f_{j}^{\prime }+u_{j}^{\prime }f_{i}^{\prime }}. & \displaystyle\end{eqnarray}$$
Wall-normal profiles of the production term
 $P_{ij}$
and the particle-induced term
 $S_{ij}$
in inner wall units at
 $x=828\unicode[STIX]{x1D703}_{in}$
: (a) streamwise component of the production
 $P_{xx}$
; (b) streamwise component of the particle-induced term
 $S_{xx}$
; (c) wall-normal component of the particle-induced term
 $S_{yy}$
; (d) spanwise component of the particle-induced term
 $S_{zz}$
. All terms are normalized by
 $u_{\unicode[STIX]{x1D70F}}^{4}/\unicode[STIX]{x1D708}$
.

The production of the streamwise velocity fluctuations
 $\overline{u^{\prime }u^{\prime }}$
,
 $P_{xx}\approx -2\overline{u^{\prime }v^{\prime }}\text{d}\bar{u}/\text{d}y$
, is approximately twice the production of the TKE. As shown in figure 35(a), the presence of particles significantly suppresses the production of
 $\overline{u^{\prime }u^{\prime }}$
, with the level of suppression increasing with particle Stokes number. On the other hand, distinctly positive values of the particle-induced term,
 $S_{xx}=2\overline{u^{\prime }f_{x}^{\prime }}$
, are observed in figure 35(b), indicating that the particle–fluid interactions produce an extra source of the turbulent velocity fluctuations in the streamwise direction. The increase in the total production
 $P_{xx}+S_{xx}$
can probably explain the slight augmentation of the near-wall streamwise turbulence intensity in case A (figure 8
a).
In the wall-normal and spanwise directions, the production terms of the velocity fluctuations are approximately zero, while the particle-induced terms are negative, which is consistent with the numerical results of Zhao et al. (Reference Zhao, Andersson and Gillissen2013) in a turbulent channel flow. This implies that the interactions between particles and fluid lead to a net dissipative effect on the velocity fluctuations in the directions perpendicular to the mean flow. As a result, the wall-normal and spanwise turbulence intensities are substantially attenuated in the particle-laden flows, as shown in figure 8(c,d). Furthermore, the peak magnitude of
 $S_{xx}$
is obviously larger than that of
 $S_{yy}$
and
 $S_{zz}$
, which results in a large particle-induced energy source
 $S_{k}$
in figure 31(f). It should be pointed out that the particle-induced term
 $S_{ij}$
in (5.10) is averaged at the fluid grid cell (Reynolds averaged), not averaged at the position of the particles (conditionally averaged). In our recently reported study (Li et al.
Reference Li, Luo and Fan2016b
), we investigated the transfer of kinetic energy between particles and fluid in a isothermal flat-plate boundary layer by analysing the particle-induced terms averaged at the position of the particles, i.e. the conditionally averaged particle-induced terms. Despite the different research perspectives, we observe similar results for the particle–fluid interactions. It can be concluded that the inertial particles with
 $d_{p}<\unicode[STIX]{x1D702}$
act as sources of turbulent energy in the streamwise direction, whereas they serve as energy sinks in the wall-normal and spanwise directions.
6 Conclusions and future developments
In this work, we have performed DNSs of particle-laden flows with heat transfer to investigate for the first time, as far as we know, the interactions between turbulence, heat transfer and particles in a spatially developing turbulent boundary layer over a flat plate with a two-way coupled Eulerian–Lagrangian point-particle method. The physical mechanisms of turbulent heat transfer modulation caused by particles are analysed in detail. It is found that the local skin-friction coefficient and Nusselt number can be decomposed into four contributions, namely the laminar, turbulent, inhomogeneous and particle contributions. The presence of particles causes decreases in the turbulent and inhomogeneous contributions, while induces a large positive particle contribution. The combination of these two counteracting effects results in the enhancements of the skin-friction drag and heat transfer.
The quadrant analysis shows that the sweep and ejection motions are dampened by the small solid particles, which in turn leads to reductions in the Reynolds shear stress and wall-normal turbulent heat flux. As a consequence, the productions of the TKE and temperature fluctuations are significantly suppressed in the particle-laden flows. The budget of the TKE indicates that the particle–fluid interactions produce an extra energy source in spite of the strong turbulence attenuation in most regions of the boundary layer, as is that of the temperature variance. On the other hand, the interactions between particles and fluid give rise to a net dissipative effect on the turbulent velocity fluctuations in the wall-normal and spanwise directions, which can explain the attenuation of these turbulence intensities observed in the present simulations. In other words, the inertial particles with diameter smaller than the Kolmogorov length scale act as a source of turbulent energy in the streamwise direction, whereas they serve as an energy sink in the directions perpendicular to the mean flow.
The modification of turbulent coherent structures by particles is also investigated and a strong damping of the intensity of streamwise vortices is observed in the particle-laden flows. Moreover, the level of suppression increases with particle inertia. The turbulent vortical structures become less organized, while the near-wall velocity and temperature streaky structures appear to be more regular. The increases in the coherence and spacing of the streaky structures are typical features of drag and heat transfer enhancements in a spatially developing turbulent boundary layer.
The present study represents the first effort to investigate the effects of inertial particles on turbulent flow and heat transfer in a spatially evolving turbulent boundary layer by means of DNS. These new findings are of great significance to enhance the understanding of the physical mechanisms of turbulent heat transfer modulation by particles. The DNS database can also be used to develop and improve the models of turbulent multiphase flows. It should be pointed out that the thermophysical fluid properties, such as viscosity and density, are assumed to be constant in this study. However, this assumption is only valid for cases with small temperature differences between the solid wall and the surrounding fluid. In the following research, we will conduct simulations of particle-laden turbulent boundary layers with heat transfer and temperature-dependent fluid properties, which have still not been reported in the fields of wall-bounded turbulent flows.
Acknowledgements
This work is supported by the National Natural Science Foundation of China (nos 51390491 and 51776183) and the China Postdoctoral Science Foundation (2017M611986). We are grateful for this.