Introduction
Implementation of precision irrigation systems could contribute to reducing water consumption in viticulture and to optimizing the impact on vine growth, yield and grape quality. The usefulness of different physiological parameters and their applicability for water stress detection and irrigation management in grapevines was reviewed by different authors (Acevedo-Opazo et al., Reference Acevedo-Opazo, Tisseyre, Guillaume and Ojeda2008, Reference Acevedo-Opazo, Tysseire, Taylor, Ojeda and Guillaume2010; Fernandez Reference Fernández2014). Jones (Reference Jones2004) suggested that greater precision in the application of irrigation can potentially be obtained using plant-based responses rather than measurements of soil water status. Although very reliable and informative, many of some tools monitor only a single plant in the field and/or are time-consuming; therefore, they are unsuited to detecting spatial variation in water status within a vineyard. New technologies, sensors and computing are desirable in precision viticulture (Fuentes et al., Reference Fuentes, De Bei, Pech and Tyerman2012) to assess vineyard spatial variability.
Canopy temperature has long been recognized as an indicator of stomatal conductance (gs), hence of plant water status (Costa et al., Reference Costa, Grant and Chaves2010, Reference Costa, Grant and Chaves2013; Jones Reference Jones1999, Reference Jones2004) and as a potential tool for irrigation scheduling (Cohen et al., Reference Cohen, Alchanatis, Sela, Saranga, Cohen, Meron, Bosak, Tsipris, Ostrovsky, Orolov, Levi and Brikman2005, 2016; Meron et al., 2010). Thermal stress indices, such as CWSI (Idso et al., Reference Idso, Jackson, Pinter, Reginato and Hatfield1981) and the Ig (Jones et al., Reference Jones, Stoll, Santos, de Sousa, Chaves and Grant2002) have been developed to reduce the impact of environmental fluctuations in the canopy temperature. Significant correlations between canopy temperatures (or thermal indices) and gs or Ψstem were observed in a commercial vineyard (Grant et al., Reference Grant, Baluja, Ochagavía, Diago and Tardaguila2016; Pou et al., Reference Pou, Diago, Medrano, Baluja and Tardaguila2014). Recent studies have also shown the effectiveness of CWSI computed from high-resolution imagery acquired by thermal cameras on unmanned aerial vehicles (Baluja et al., 2012; Bellvert et al., Reference Bellvert, Marsal, Girona and Zarco-Tejada2014, Reference Bellvert, Zarco-Tejada, Marsal, Girona, González-Dugo and Fereres2016). In other crops, as cotton and olive trees, the water status has been assessed by thermal imagery from mobile or aerial platforms in order to expand the viewing area (Cohen et al., Reference Cohen, Alchanatis, Sela, Saranga, Cohen, Meron, Bosak, Tsipris, Ostrovsky, Orolov, Levi and Brikman2015; Meron et al., Reference Meron, Tsipris, Orlov, Alchanatis and Cohen2010). A vineyard is typically a discontinuous crop, as vines are planted in rows, and canopy width is usually within the range of 30–50 cm for a vertically shoot positioned trellis system. To use the canopy temperature information and avoid the soil impact, both RGB and thermal cameras were mounted on a truck-crane about 15 m above the canopy to assess vineyard water status in Israel (Möller et al., Reference Möller, Alchanatis, Cohen, Meron, Tsipris, Naor, Ostrovsky, Sprintsin and Cohen2007).
Most published data from thermal imaging of grapevine relates to images taken facing the rows (Grant et al., Reference Grant, Tronina, Jones and Chaves2007; Jones et al., Reference Jones, Stoll, Santos, de Sousa, Chaves and Grant2002). These results suggested that lateral and proximal thermal imaging could be taken on-the-go for monitoring vineyard water status and characterizing the spatial variability in the commercial vineyards. In precision viticulture the usefulness and convenience of high-spatial resolution information provided to define plant water status zones within-vineyards was suggested by several authors (Acevedo-Opazo et al., Reference Acevedo-Opazo, Tysseire, Taylor, Ojeda and Guillaume2010; Baluja et al., 2012; Bellvert et al., Reference Bellvert, Zarco-Tejada, Marsal, Girona, González-Dugo and Fereres2016; Cohen et al., 2016).
The goal of this work was to assess the water status of a commercial vineyard Tempranillo cv. (Vitis vinifera L.) using on-the-go thermal imagery retrieved from a moving quad. The relationships between canopy temperature and thermal indices derived from terrestrial on-the-go imagery with stem water potential were determined.
Materials and methods
The experiment was conducted in a commercial vineyard located in Tudelilla, La Rioja, Spain, in late-August, 2016. Grapevines of Tempranillo (Vitis vinifera L.) were grafted on rootstock R-110, planted in 2002, and trained to a vertically shoot-positioned (VSP) trellis system, with North-South row orientation at 2.60 × 1.20 meters inter and intra row distances.
Three different water treatments with four replications were deployed in a random block design in order to induce variability within the vineyard water status. Each replicate per treatment block comprised 25 plants, from which the 15 middle ones were considered as the interest plants, discarding the first and last five plants to avoid edge effects.
Midday stem water potential Ψstem (14:00, solar noon) was used as reference method of the plant water stress. Of the 15 middle vines in each replication three random plants, evenly spaced, were marked and their Ψstem measured. Having 12 different treatment replications and three selected plants per each, a total of 36 Ψstem measurements were performed. The Ψstem was measured at solar noon using a Scholander pressure bomb (Model 600, PMS, Instruments Co., Albany, USA) one hour after the leaves were covered with aluminum foil bags, in order to drive them into dark adaptation.
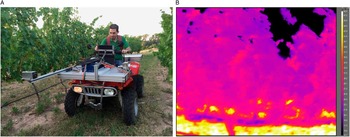
The acquisition of the on-the-go thermal images was performed using a FLIR A35 (FLIR® Systems, Inc., Bilerica, MA, USA) uncooled thermal camera mounted in the front part of an all-terrain-vehicle (quad) (figure 1A), aiming to the left and at 120 cm from the canopy (figure 1B). Due to the North-South vine rows orientation, both east and west sides of the canopy were monitored at an average speed of 5 km/h at the same time the Ψstem was measured.
(A) Thermal camera mounted on a quad to acquire (B) thermal images on-the-go during season 2016.

Tdry and Twet measurements were acquired using an evaposensor (Skye instruments, Llandrindod Wells, UK) with two artificial leaves: one covered in a black cotton wick with a continuous water absorption and a dry one to be used as dry reference (Harrison-Murray, Reference Harrison-Murray1991). Crop water stress index (CWSI) and stomatal conductance index (Ig) were calculated as follows according to Idso et al. (Reference Idso, Jackson, Pinter, Reginato and Hatfield1981), and Jones et al. (Reference Jones, Stoll, Santos, de Sousa, Chaves and Grant2002); respectively.
 $$CWSI={\rm }{{T_{c} {\minus}T_{{wet}} } \over {T_{{dry}} {\minus}T_{{wet}} }}$$
 $$I_{g} ={\rm }{{T_{{dry}} {\minus}T_{c} } \over {T_{c} {\minus}T_{{wet}} }}$$
where Tc is the temperature of the canopy. From the three Ψstem measurements per replication, their average was computed and considered as the stem water potential of the replication, while the average temperature of the canopy from the 15 middle plants was considered as Tc. Therefore, a total of 12 samples were used for the correlation analysis of the thermal indices and the Ψstem.
Results and discussion
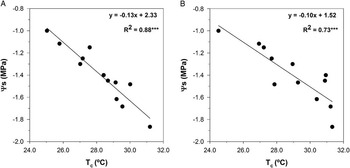
Figure 2 shows the correlation plots between Tc and Ψstem for both east and west sides of the canopy. The determination coefficients R2 were 0.88 and 0.73 respectively. Linear relationships were obtained for both canopy sides. This allowed to confirm a shallow principle: a higher canopy temperature is translated as a higher water stress level (that is, a lower Ψstem). This is fully coherent and explained by the fact that leaves close their stomata under water stress conditions, and thus leaf T increases since transpiration no longer occurs (Costa et al., Reference Costa, Grant and Chaves2013, Jones, Reference Jones1999). It is worth noting that the linear correlation equations y=a·x+b shared similar slope values a (−0.13 and −0.10, for east and west sides respectively) and constant terms b (2.33 and 1.52, for east and west sides respectively), a fact that showed the virtually identical behavior between the Tc and stem water potential correlation, regardless of the canopy side measured.
Linear correlation between Tc and Ψstem in east (A) and west (B) sides of the canopy (*** indicate statistical significance at p=0.001).

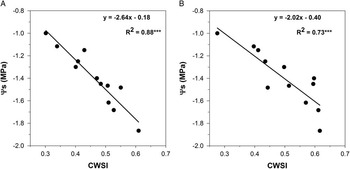
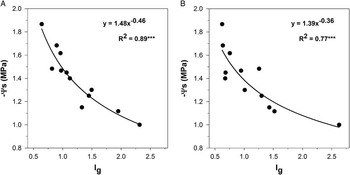
Comparing east and west canopy sides, the best correlation outcomes came from the former. The correlation plots between the grapevines’ stem water potential and the thermal indices CWSI and Ig are displayed in figures 3 and 4, respectively, for both sides of the canopy.
Linear correlation between CWSI and Ψstem in east (A) and west (B) sides of the canopy (*** indicate statistical significance at p=0.001).

Power correlation between Ig and Ψstem in east (A) and west (B) sides of the canopy (*** indicate statistical significance at p=0.001).

For these two indices, the best determination coefficients were obtained also for the measurements from the east side of the canopy (R2 of 0.88 for CWSI and 0.89 for Ig). Still, for the west side of the canopy, high correlation ratios were also obtained, reaching R2 marks of 0.73 and 0.77 for CWSI and Ig respectively. At measurement time (between 14:00 and 15:30 UTC+1), due to the North-South row orientation of the vineyard, the east side was recently shaded after a whole morning of direct sunlight, while the west side was starting to be illuminated after being shaded for the previous hours. This calls for larger acclimation to the sun exposure in leaves of the east side, hence being more responsive to differences in plant water status than leaves of west side.
Overall, the higher correlation values were obtained from the east side of the canopy. This repeated behavior evidences the high consistency between correlations and canopy side regardless the thermal index used. The major outcomes casted when measurements were acquired from the east side of the canopy could allow to assert that, for an in-field automatic solution, that side (for vineyards with North-South orientation) would be the best suitable candidate for the monitoring of the vineyard water status using thermal imaging.
It is not arbitrary that the Tc and the CWSI index yielded the same correlation values with Ψstem, as they are lineally correlated.
It is worth to mention that a major difference can be found in the kind of Ψstem correlation with Ig in comparison to Tc and CWSI. While these two proved to keep a linear correlation with the reference parameter, the profile of the Ig vs. Ψstem plot (figure 4) suggested that a non-linear correlation had a higher weight, hence the power correlation (a·x b ).
Some examples for vineyard water status monitoring by thermal imaging can be found in the literature. In Pou et al. (Reference Pou, Diago, Medrano, Baluja and Tardaguila2014), a manual thermal camera was used for the correlation analysis between the vineyard water status (using the stomatal conductance as reference parameter) and CWSI and Ig thermal indices. Values of R2 up to 0.80 for CWSI and 0.78 for Ig were obtained, having the best results, as in the present work, from the shaded side of the canopy. Although the authors did not use the same reference parameter, the shown outcomes proved the fitting ability of thermal imaging, whether manual or on-the-go, for the estimation of the vineyard water status. Correlations between CWSI and Ψstem were also developed by Grant et al. (Reference Grant, Baluja, Ochagavía, Diago and Tardaguila2016), obtaining R2 values from 0.40 to 0.58 in the same measurement times than those from the present work. The authors used a manual thermal camera, taking fixed images from side and top positions. Direct correlations between Ig and gs were also tested, providing poor determination coefficients R2 from 0.27 to 0.44.
Water status estimation using thermal imaging has also been studied in other crops. Alchanatis et al. (Reference Alchanatis, Cohen, Cohen, Moller, Sprinstin, Meron, Tsipris, Saranga and Sela2010) and Cohen et al. (Reference Cohen, Alchanatis, Sela, Saranga, Cohen, Meron, Bosak, Tsipris, Ostrovsky, Orolov, Levi and Brikman2015) developed a multi-year model for cotton crop water status estimation using ground-based thermal imaging capturing at heights from 4 to 10 meters. As in the present study, the correlation between CWSI and the water potential (leaf water potential, in the case of Alchanatis et al. (Reference Alchanatis, Cohen, Cohen, Moller, Sprinstin, Meron, Tsipris, Saranga and Sela2010) and Cohen et al. (Reference Cohen, Alchanatis, Sela, Saranga, Cohen, Meron, Bosak, Tsipris, Ostrovsky, Orolov, Levi and Brikman2015)) was analyzed and high determination coefficients R2 were achieved (up to the 0.93 and 0.82 marks). Nevertheless, the approach in these two studies noticeably differs from that in the present work. In Alchanatis et al. (Reference Alchanatis, Cohen, Cohen, Moller, Sprinstin, Meron, Tsipris, Saranga and Sela2010), an overhead view was used for thermal imagery acquisition, thus covering a wider range from a single image and bringing the chance to rapidly check the water status of larger areas. However, this methodology could not be applied to any kind of crop, for it would depend on the crop architecture and the amount of information from the canopy this view is able to provide. The side-aimed capturing of thermal images presented in this work would prevent the necessity of mounting special structures or making aerial measurements, given the possibility of embedding a thermal capturing system in agricultural vehicles that could make water status estimations during an in-field work, and even use the thermal information as input for automatic irrigation decisions.
In Cohen et al. (Reference Cohen, Alchanatis, Prigojin, Levi, Soroker and Cohen2012), thermal images taken from a full aerial point of view were used for the estimation of water status in a date-palm plot. The authors were able to characterize the thermal response of large sections of the plot and compare the results with different irrigation treatments, also providing maps of water status based on temperature. The same approach, aerial thermal imaging, was applied for vineyard irrigation scheduling by Baluja et al. (Reference Baluja, Diago, Balda, Zorer, Meggio, Morales and Tardaguila2012) and Bellvert et al. (Reference Bellvert, Zarco-Tejada, Marsal, Girona, González-Dugo and Fereres2016) using the water potential as reference method. The spatial variability of the vineyard was mapped by the authors from high-resolution airborne thermal images, and estimation of the leaf water potential was also developed casting R2 values variables between 0.31 and 0.61, depending on the phenological stage and also on the atmospheric conditions (checking, for example, the influence of the vapour pressure deficit parameter). Thermal imaging from aerial sources brings some advantages, mainly the higher amount of spatial information covered, and lacks of some features that could derive in outcomes with a lower precision. Taking ground-based thermal images from the lateral part of the canopy would provide richest information about the thermal distribution in the leaves and thus yield a better response in the predictions.
This work builds on previous evidence of thermography to provide a good assessment of the grapevine water status (Jones et al. (Reference Jones, Stoll, Santos, de Sousa, Chaves and Grant2002); Jones (Reference Jones2004); Costa et al. (Reference Costa, Grant and Chaves2010)). The main novelty of this piece of research lies in the way of acquisition of thermal imaging, which is neither manual, nor aerial, but on-the-go, from an ATV moving at commercial speed of 5 km/h, and targeting the two sides (lateral view) of the canopy. Mapping of the vineyard water status can therefore be done, but opposed to mapping from aerial thermography, this can be done from lateral thermography.
The results obtained in this work evidence the feasibility of providing accurate and reliable estimation of plant water status from thermal images acquired on-the-go from a moving vehicle. This is especially relevant and useful for grape growers, as the variability of the vineyard water status of any commercial VSP vineyard can be non-invasively assessed with a thermal camera and a GPS mounted in a tractor or any ATV moving at a speed of 5 km/h. This georeferenced information can be mapped and become a friendly, easy-to-interpret tool by grape growers to define subzones of homogeneous vine water status within the vineyard, susceptible of differentiated irrigation strategies.
Conclusions
The results obtained in this study showed the high appropriateness of on-the-go thermal imaging for the water status estimation of vineyards, as evidenced by the strong correlations between different thermal indices and the stem water potential. The possibility of quickly characterize a whole vineyard by attaching a thermal system to a working agricultural vehicle becomes feasible and useful for decision-making or even for the automatic scheduling of locally-aimed irrigation treatments.
Acknowledgments
This work received funding from the European Community’s Seventh Framework Program for research, technological development and demonstration under Grant Agreement N° 610953, Project VineRobot. This work also received financial support within the RESOLVE project provided by transnational funding bodies, being partners of the FP7 ERA-net project, CORE Organic Plus, and the cofund from the European Commission. The first author would like to acknowledge the research founding FPI grant 299/2016 by University of La Rioja, Comunidad Autónoma de La Rioja.