Introduction
While the norm in most Asian societies is for older adults to co-reside with their spouse and children, some older adults, whether by choice or circumstances, live in other less common arrangements such as with other related or unrelated persons, or alone. Understanding the demographic and socio-economic factors that correlate with living arrangements in old age can be useful in predicting how living arrangements in the future are likely to change with socio-economic development (DaVanzo and Chan Reference DaVanzo and Chan1994; Knodel and Debavalya Reference Knodel and Debavalya1997). Moreover, given that many previous studies have found that shared living arrangements can serve important functions for both older adults and their adult children (Knodel and Debavalya Reference Knodel and Debavalya1997), the consequences of certain types of living arrangements on the wellbeing of older adults are equally important to examine.
Hence, the objectives of our paper are threefold. First, we begin by providing an overview of living arrangements of older adults in Singapore in 2009 and assess the extent to which living arrangements have changed over a two-year period. Second, we examine the predictors of living arrangements of older Singaporeans. Third, we examine the consequences of living arrangements, especially living alone, on older Singaporeans' overall wellbeing, comprising of a broad range of social, economic and health dimensions. We are particularly interested in the social and economic outcomes which have been given far less attention in the literature compared to health dimensions. Our study adds to the existing literature by taking a holistic approach in considering a range of social, economic and health indicators that are consistent with the broader perspective of health expressed in the World Health Organization definition: ‘Health is not simply absence of disease or infirmity, but is the presence of a complete physical, mental and social well-being’.
Background
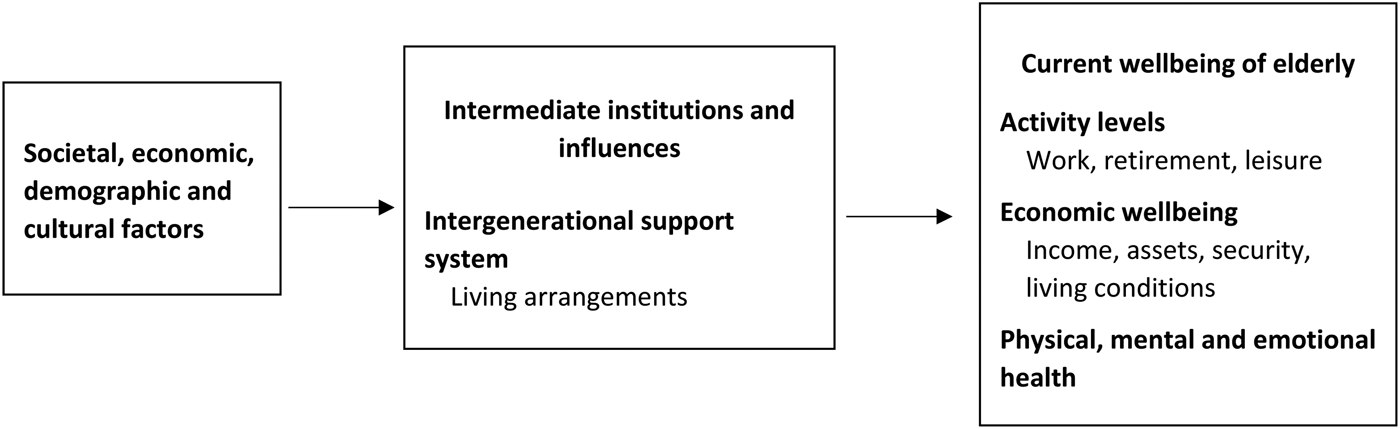
The theoretical perspective for our study is based on the conceptual framework of factors affecting wellbeing of older adults proposed by Hermalin (Reference Hermalin and Hermalin2002). In this framework, exogenous social, economic, demographic and cultural factors have an impact on intermediate institutions and influences that include personal characteristics, intergenerational support systems, and formal programmes and policies. The intermediate institutions and influences are consequently linked to the wellbeing of individuals – both older adults and persons in other age groups. The focus of the current paper is on the link between living arrangements, which forms the broader intergenerational social support system, and wellbeing of older adults along several dimensions of work and leisure activities, economic indicators, and physical, mental and emotional health, as conceptualised in the framework (see Figure 1). We identify work and leisure activities and economic indicators as social and economic wellbeing. Physical, mental and emotional health is identified as emotional and physical wellbeing. The overall framework particularly emphasises that understanding the processes, both the predictors and consequences, are important for evaluating current programmes as well as for formulating new programmes and policy development.
Conceptual framework.

Predictors of living arrangements
To date, a number of studies in Asia and elsewhere have examined patterns and changes in living arrangements and their determinants. These studies have found that despite the sweeping demographic and socio-economic changes that have occurred in several Asian countries, the vast majority of older adults in Asia continue to co-reside with their children (Bongaarts and Zimmer Reference Bongaarts and Zimmer2002; Frankenberg, Chan and Ofstedal Reference Frankenberg, Chan and Ofstedal2002; Korinek, Zimmer and Gu Reference Korinek, Zimmer and Gu2011). The city-state of Singapore is no exception. Singapore has made remarkable socio-economic progress since achieving independence in 1965. The Gross Domestic Product per capita has increased from US $500 in 1965 to US $56,000 in 2015. At the same time, Singapore has maintained relatively high levels of co-residence compared to other Asian countries of similar socio-economic development in the region. In a city-state such as Singapore that does not have a rural sector, it is perhaps not surprising that similar to any other urban setting the high cost of living would be a contributing factor in the high rates of co-residence. In addition, Singapore is unique in its aggressive stance promoting familial care for the elderly reflected in many of its government policies. For example, the Singapore government offers priority housing, housing subsidies and tax incentives to children who co-reside with their parents (Chan Reference Chan1997; Frankenberg, Chan and Ofstedal Reference Frankenberg, Chan and Ofstedal2002). Furthermore, the Maintenance of Parents Act, passed in 1995, allows older adults to take legal action against their children for failing to provide adequate economic support. In Singapore, given that 90 per cent of the population lives in high-rise high-density housing flats built by the Singapore government Housing and Development Board (HDB) and where the cost of living is extremely high, it is hence likely that such government policies would have further played a role in the maintenance of high levels of co-residence in the country.
Though a minority, older adults in Singapore also live in other arrangements such as with their spouse (without children), with others (without a spouse or children) or alone. The proportion of older adults living alone has been increasing modestly in recent years – from 2 per cent in 1988 to 3 per cent in 1995 and to 7 per cent in 2011 (Chan Reference Chan1997; Chan et al. Reference Chan, Raman, Ma and Malhotra2015). Similar increases in living alone have been observed in other South-East Asian contexts, e.g. Myanmar, Vietnam and Thailand (Teerawichitchainan, Knodel and Pothisir Reference Teerawichitchainan, Knodel and Pothisir2015). The modest increase in living alone is, however, nowhere near the sharp increase that has occurred in the East Asian countries of Japan and Korea, especially among older women. In Korea, almost 30 per cent of women aged 65 years and above lived alone in 2010 (Park and Choi Reference Park and Choi2015). The proportion of older adults living alone in Singapore is, however, expected to increase further with rising singlehood and childlessness.
At the individual level, characteristics of older adults such as age, gender, presence and availability of children, socio-economic circumstances, cultural factors, as well as health of older adults are salient features that determine who older adults live with in their old age. Changes in living arrangements at old age usually arise due to loss of a spouse, grown children moving out or in, and functional decline in older adults' health. Due to gender differences in mortality and remarriage rates, older men are more likely than older women to continue living with a spouse and consequently less likely to live alone. The odds of co-residence with children is, however, similar for older men and women but increases with the number of children (Bongaarts and Zimmer Reference Bongaarts and Zimmer2002; DaVanzo and Chan Reference DaVanzo and Chan1994; Frankenberg, Chan and Ofstedal Reference Frankenberg, Chan and Ofstedal2002). In contrast to Western contexts where higher socio-economic status allows older adults to live independently either with their spouse only or alone, some studies in Asia have found the opposite where higher socio-economic status is linked with a higher likelihood of co-residence with children (DaVanzo and Chan Reference DaVanzo and Chan1994; Park and Choi Reference Park and Choi2015; Teerawichitchainan, Knodel and Pothisir Reference Teerawichitchainan, Knodel and Pothisir2015). Ethnicity is a particularly salient feature in multi-ethnic Singapore where strong differences emerge between the three main ethnic groups of Chinese, Malay and Indians (Chan Reference Chan1997).
Consequences of living arrangements
The consequences of living arrangements on the physical, mental and emotional health of older adults have been explored extensively in the literature. A consistent finding in the literature is that living with a spouse in old age is the most beneficial arrangement for later-life physical health and emotional wellbeing. Living with children where a spouse is present, in most circumstances, does not add much to the benefits (nor does it make things worse) (Bongaarts and Zimmer Reference Bongaarts and Zimmer2002; Chen and Short Reference Chen and Short2008; Herm, Anson and Poulain Reference Herm, Anson and Poulain2016; Hughes and Waite Reference Hughes and Waite2002; Li, Zhang and Liang Reference Li, Zhang and Liang2009; Ren and Treiman Reference Ren and Treiman2015). An exception is a study in India that found living with both spouse and children (especially with grandchildren) to be the optimal living arrangement for older Indians, which was associated with the lowest levels of short-term illness, while living alone was associated with the highest levels of short-term illness (Samanta, Chen and Vanneman Reference Samanta, Chen and Vanneman2015). Living alone in Asia, in contrast to Western contexts, has generally been found to be an undesirable living condition. Previous studies have shown that older adults who live alone are less satisfied with life and have overall lower psychological wellbeing (Chen and Short Reference Chen and Short2008; Day and Day Reference Day and Day1993; Herm, Anson and Poulain Reference Herm, Anson and Poulain2016; Hughes and Waite Reference Hughes and Waite2002, Ren and Treiman Reference Ren and Treiman2015).
Previous research on Singapore has focused primarily on living arrangements and specific health outcomes that include depression and all-cause mortality risk. Chan et al. (Reference Chan, Malhotra, Malhotra and Ostbye2011) found that both living alone and living with children was associated with higher depressive symptoms compared to those living with a spouse and children. Similarly, Lim and Kua (2011) found that living alone predicted lower psychological wellbeing though its predictive ability decreased when loneliness was taken into account. The evidence on mortality risk is mixed. Ng et al. (Reference Ng, Jin, Feng, Nyunt, Chow, Feng and Fong2015) found that living alone was associated with increased mortality risk, particularly for men and those who were single, widowed or divorced. Chan et al. (Reference Chan, Raman, Ma and Malhotra2015), however, did not find any effects of living arrangements on mortality risk once loneliness and health status were accounted for.
As shown above, much of the prior literature has focused primarily on physical, mental and emotional wellbeing rather than on aspects of social and economic wellbeing. It has generally been assumed that differences in health outcomes by living arrangements arise due to varying levels of social and economic capital of elderly in different living arrangements. Some studies have considered social and economic indicators as moderators of the association between living arrangements on health outcomes. One of the few studies that has directly examined social and economic wellbeing of older adults contends that living alone, even in Asian contexts, is not necessarily associated with negative consequences. In a cross-sectional comparative study of Myanmar, Vietnam and Thailand, Teerawichitchainan, Knodel and Pothisir (Reference Teerawichitchainan, Knodel and Pothisir2015) examine what living alone really means for older adults. Results of their study showed that while older adults who live alone were more likely to be depressed, they were, however, not socially alienated and were as socially participatory, if not more active than those living with someone. Living alone was also not necessarily associated with financial distress in some contexts. Furthermore, the study found that most older adults who live alone were in ‘quasi-residence’ arrangements where they have a child living next door or nearby. Hence, they argue that it is the childless older adults living alone that are most vulnerable rather than those living alone per se. Through a qualitative study, Wong and Verbrugge (Reference Wong and Verbrugge2009) studied the lives of a small group of older adults living alone in Singapore. They argue that although Singaporean older adults living alone face many hardships and a bleak future limited by physical illnesses, disability and depression, many prefer living alone and over time have developed various strategies to succeed at living alone – particularly in terms of connecting to the outside world.
Data, methods, and sample characteristics
Data
We utilise data from a nationally representative longitudinal survey (two waves: 2009 and 2011) on the physical, mental and social health of community-dwelling older Singaporeans, known as the Panel on Health and Ageing of Singaporean Elderly (PHASE). In Wave 1, conducted in 2009, commissioned by the Ministry of Social and Family Development (MSF), 4,990 older adults aged 60 years or above or their proxy respondents were interviewed face-to-face (response rate 69.4%). Older adults (⩾75 years) and Malays and Indians were over-sampled by a factor of two to ensure sufficient numbers in each of these groups for analysis. Further details of the sampling methodology are published elsewhere (Chan et al. Reference Chan, Malhotra, Malhotra and Ostbye2011).
Of the 4,990, a total of 3,103 older adults or their proxy respondents were re-interviewed at Wave 2 in 2011, approximately two years after Wave 1. The analytic sample for our study is based on the 3,103 older adults who were interviewed at both waves of the survey. The present analysis, based on de-identified data, was exempted from full review by the institutional review board of the National University of Singapore.
Stata for Windows version 13.1 was used for data management and statistical analysis (StataCorp, College Station, Texas). All of our analyses are weighted using Wave 1 survey sampling weights to adjust for over-sampling and non-response.
Methods
In the first part of our analysis we provide an overview of the living arrangements of older Singaporeans in 2009 and assess the extent to which living arrangements have changed over a two-year period. Living arrangements is a mutually exclusive categorical variable derived from the household roster indicating whether the respondent (a) lives with spouse and child(ren)Footnote 1; (b) lives with spouse onlyFootnote 2; (c) lives with child(ren) onlyFootnote 3; (d) lives with othersFootnote 4; (e) lives alone. For the second and third part of our analyses, we combine ‘lives with spouse and child’ and ‘lives with spouse only’ as our preliminary analyses indicate very little difference between these two groups in both the predictors and consequences.
The second part of our analysis examines predictors of living arrangements cross-sectionally using the baseline data collected in 2009. Our predictor variables are gender, age (60–64, 65–74, 75+), number of living children (none, one or two children, three or four children, five or more children), ethnicity (Chinese, Malay, Indian), education (no formal education, primary, secondary, more than secondary) and housing type (one- or two-room HDB flat, three-room HDB flat, four-room or more HDB flat/private accommodation). We use housing type as a proxy for income as 23 per cent of our sample did not report their household income. Previous studies have shown that housing type is a valid proxy for income in Singapore, where housing size is proportional to income (Chan et al. Reference Chan, Malhotra, Malhotra and Ostbye2011). Due to the categorical nature of the dependent variable, we present adjusted relative risk ratios from multinomial logistic regressions controlling for two measures of health status of the elderly – number of functional limitations in activities of daily living (ADL) or instrumental activities of daily living (IADL), and number of chronic diseases.
The third part of our analysis examines the consequences of living arrangements longitudinally. The four-category living arrangements variable is now our main independent variable and we examine how living arrangements in 2009 are associated with the social and economic wellbeing as well as the emotional and physical wellbeing of older Singaporeans in 2011. Our variables of interest include a number of indicators that have been dichotomised and coded so they represent a positive aspect of wellbeing.
The social and economic wellbeing indicators are:
1. Strong social networks (outside the household): Lubben's revised social network scale is modified to assess social networks of the older adults outside the household. The scale consists of 12 items (six each for social networks with friends and with relatives outside the household) assessing the size of network, frequency of contact, closeness, and perceived support from friends and relatives outside the household. Each item is scored on a six-point scale, from 0 to 5. The sum of scores ranges from 0 to 60, 0 indicating the lowest and 60 the highest possible score. Based on previous research in Singapore, those with a score greater than or equal to the 25th percentile are classified as having ‘strong’ social networks outside the household (Malhotra et al. Reference Malhotra, Chan, Malhotra and Ostbye2011).
2. Participation in social activities: this is assessed through frequency (every day, every week, every month, less than once a month, not at all) of attending a residents/community development committee or neighborhood event and of attending a place of worship. Involvement in one or both activities at least once every month is considered as participation in social activities.
3. Currently working: current engagement in full-time or part-time work versus not working/retired/home-maker.
4. Home-ownership: solely or jointly own home versus owned by someone else or rental.
5. Income perceived to be adequate: older adults responding ‘enough money, with some left over’ or ‘just enough money’ to the question ‘do you feel that you have adequate income to meet your expenses' are considered to have income perceived to be adequate, while older adults responding ‘some difficulty to meet expenses' and ‘much difficulty to meet expenses' are considered to have income perceived to be inadequate.
The emotional and physical wellbeing indicators are:
1. Strong personal mastery: five of the seven items from Pearlin's personal mastery scale are used to assess personal mastery. Responses for each item are scored on a four-point agree–disagree format. Total score ranges from 0 to 15. Based on previous research in Singapore, respondents with scores greater than or equal to the 25th percentile are categorised as having ‘strong’ personal mastery (Malhotra et al. Reference Malhotra, Chan, Malhotra and Ostbye2011).
2. Free from depressive symptoms: depressive symptoms are assessed using the 11-item CES-D (Center for Epidemiologic Studies for Depression) scale, the total score ranging from 0 to 22. Based on previous research in Singapore, older adults with a score of <7 are classified as being free of clinically relevant depressive symptoms (Malhotra et al. Reference Malhotra, Chan, Malhotra and Ostbye2011).
3. Independent in all seven ADLs: older adults are considered to be independent in all seven ADLs if they report no difficulty in any of the seven ADLs such as bathing, dressing, eating, toileting, standing up and sitting down on bed/chair, walking around the house and going outside the house.
4. Independent in all seven IADLs: older adults are considered to be independent in all seven IADLs if they report no difficulty in any of the seven IADLs such as preparing meals, leaving the house to purchase medication, taking care of financial matters, using the phone, dusting/cleaning and other light house work, taking public transport and taking medication as prescribed.
5. Positive self-rated health: older adults responding ‘very healthy’ or ‘healthier than average’ as opposed to ‘average’, ‘somewhat unhealthy’ or ‘very unhealthy’ to the question ‘in general, how would you describe your state of health’ are considered to have positive self-rated health.
Results
Sample characteristics
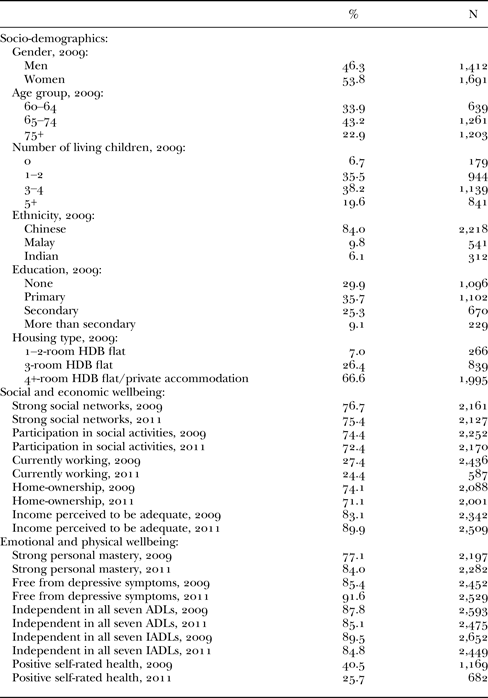
Table 1 shows the distribution of our analytic sample in 2009 (Wave 1) by socio-demographic characteristics. The majority of older adults in our sample are in the 65–74 age group, have one to two or three to four children, are Chinese, have primary education and live in a four-room or larger HDB flat/private accommodation.
Sample characteristics, 2009 and 20111

Notes: N = 3,103. 1. Percentages are weighted; N values are unweighted; 30 observations belonging to the ‘other’ category in ethnicity are excluded as the number of observations is too small for any meaningful analysis. HDB: Housing and Development Board. ADLs: activities of daily living. IADLs: instrumental activities of daily living.
The distribution of the outcome variables – social and economic wellbeing and emotional and physical wellbeing of older adults – are shown for both the baseline sample at 2009 and at follow-up two years later (Table 1). Since strong social networks is defined using a cut-off of above the bottom quartile, about 75 per cent of older adults in both waves have strong social networks. Singaporean older adults' participation in social activities is very high – 74 per cent participated in social activities in 2009, declining only very slightly to 72 per cent in 2011. A little over one-quarter of our sample were currently working, 74 per cent owned their homes and just over 80 per cent perceived their income to be adequate in 2009. By 2011, a slightly lower proportion (24%) are currently working, 71 per cent own their homes, but a higher proportion (90%) perceived their income to be adequate.
The vast majority of older adults in our sample have relatively good emotional and physical wellbeing. Strong personal mastery is defined using a cut-off of above the bottom quartile, hence over three-quarters have strong personal mastery in both waves. About 85 per cent were free from depressive symptoms and 88–90 per cent were independent in all seven ADLs or IADLs in 2009. While a higher proportion of older adults report being free from depressive symptoms (92%) in 2011, a slightly lower proportion (85%) continue to be independent in all seven ADLs or IADLs in 2011. However, only 41 per cent of older Singaporeans rated their health positively in 2009. The proportion reporting their health positively dropped even further to 26 per cent in 2011.
Living arrangements in 2009 and 2011
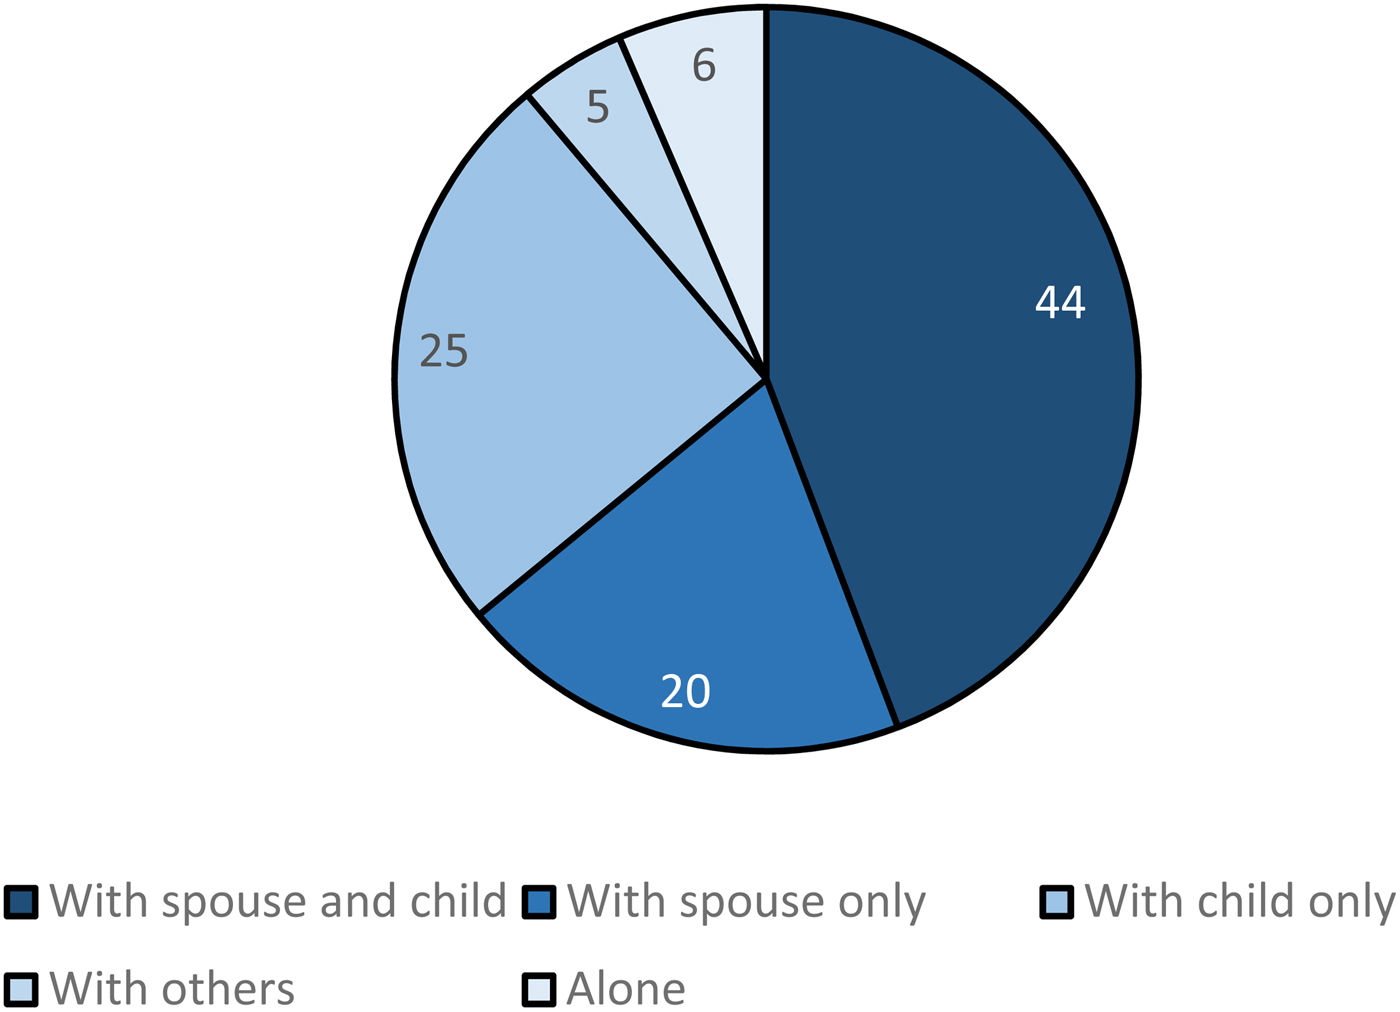
Figure 2 shows the distribution of older adults by living arrangements in 2009 for our sample.
Living arrangements of older Singaporeans, 2009.
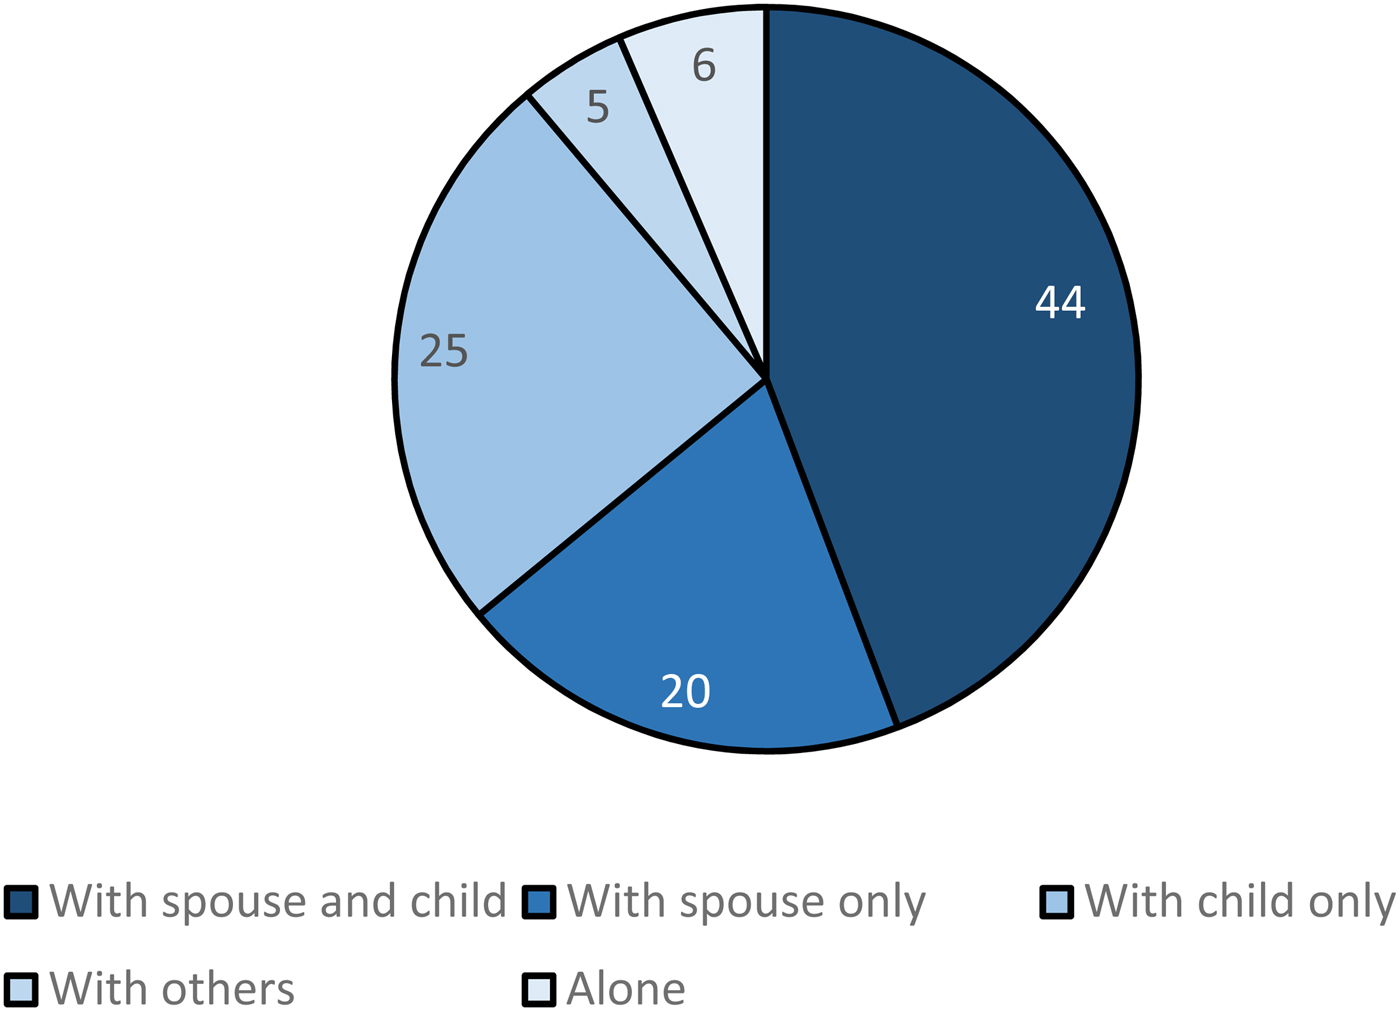
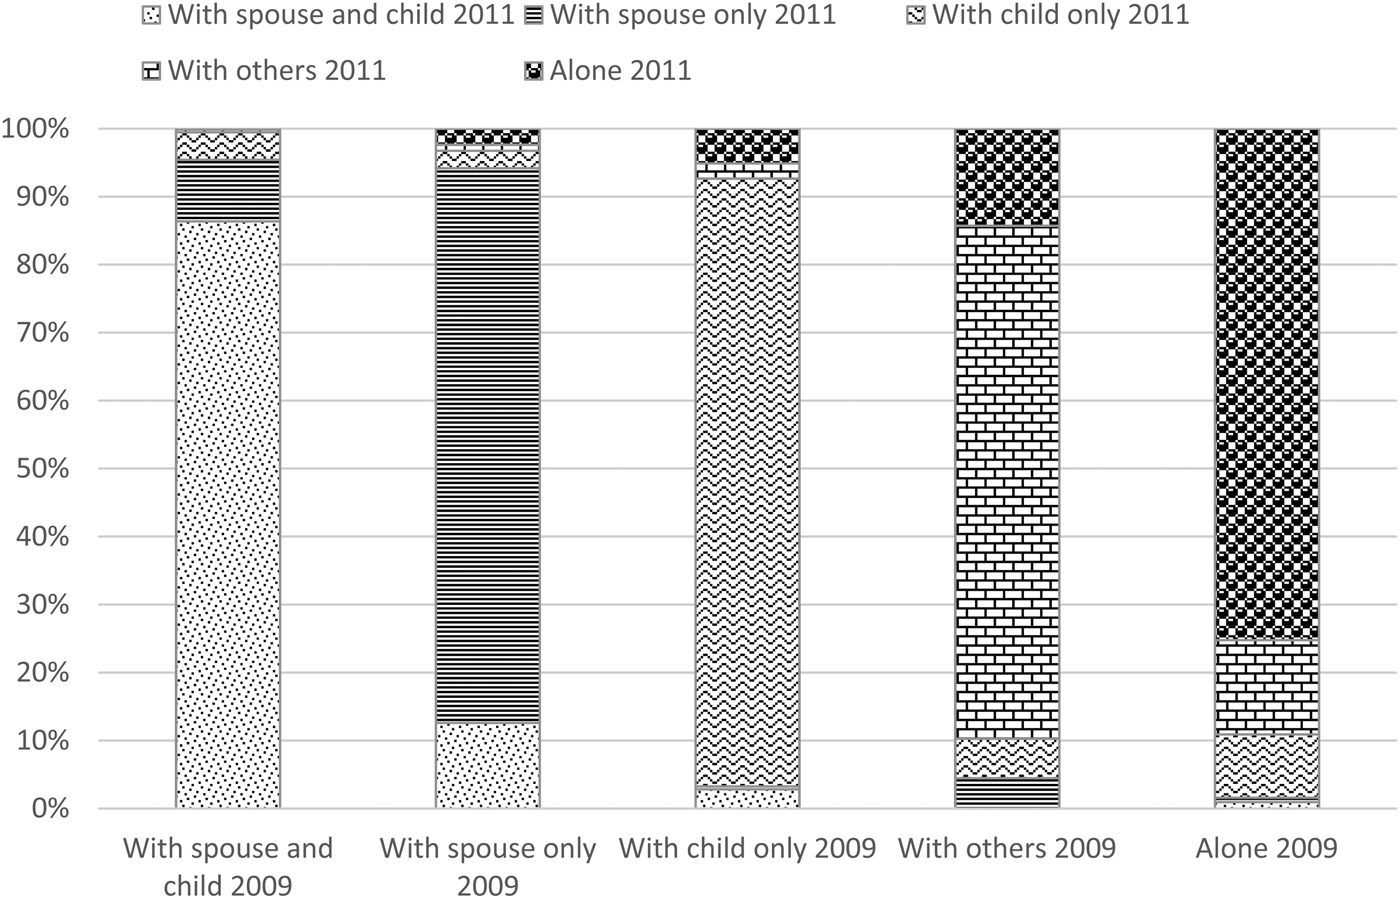
The majority of Older Singaporeans (44%) live with both their spouse and child; 20 per cent live with their spouse only; one-quarter live with their child only, 5 per cent live with others and 6 per cent live alone. The stability of living arrangements over the two-year period is shown in Figure 3.
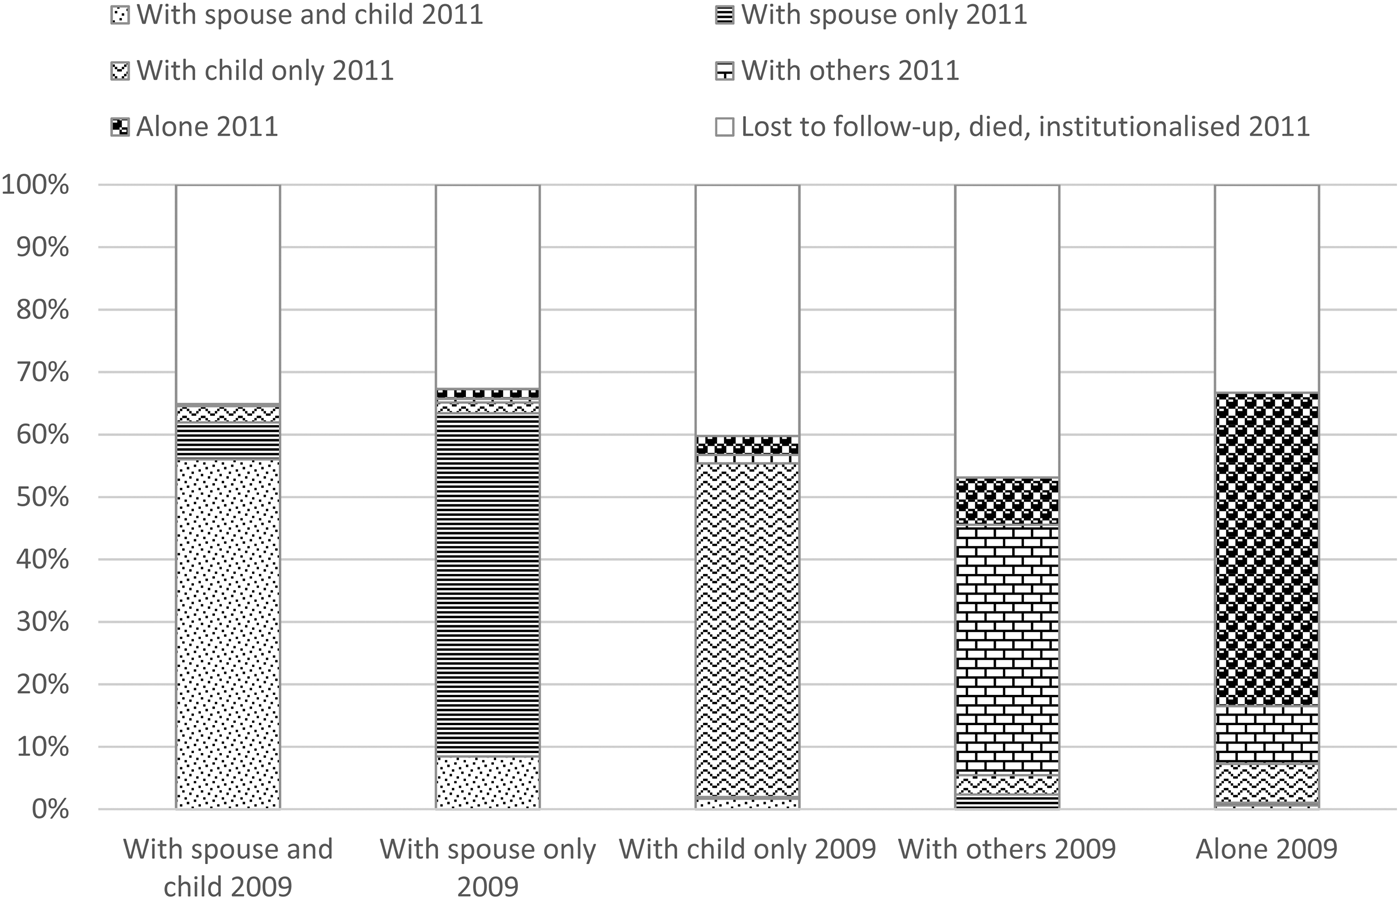
Living arrangements 2011 by living arrangements 2009 (excluding older adults lost to follow-up, dead or institutionalised in 2011).

Living arrangements 2011 by living arrangements in 2009 (including older adults lost to follow-up, dead or institutionalised in 2011).

Figure 3 shows that the majority of older Singaporeans have the same living arrangements in 2011 as in 2009. About 85 per cent of older adults who live with a spouse and child or spouse only continue to do so two years later. Almost 19 per cent of older adults who live with a spouse and child switch to living with a spouse only, and 13 per cent who live with a spouse only switch to living with a spouse and child. A negligible proportion of older adults who live with a spouse and child transition to living alone in 2011 but 2 per cent of older adults who live with a spouse only are living alone two years later. Among older adults who live with a child only, 89 per cent continue to do so in 2011 and 5 per cent transition to living alone. Among older adults who live with others or alone in 2009, three-quarters continue with the same living arrangements in 2011. While about 14 per cent of these older adults switch to living alone in 2011 (if living with others in 2009) or living with others in 2011 (if living alone in 2009), a small proportion (2–9%) switch back to living with a spouse only or spouse and child or living with a child only in 2011. Our analytic sample excludes older adults who were lost to follow-up, dead or institutionalised by Wave 2. Figure 4, including older adults who were lost to follow-up, dead or institutionalised, shows that older adults who live with others are the most likely (47%) to be missing in the second wave followed by older adults who live with a child only (40%). Older adults who live with a spouse and child, spouse only or alone in 2009 are the least likely (33–35%) to be missing in 2011.
Predictors of living arrangements
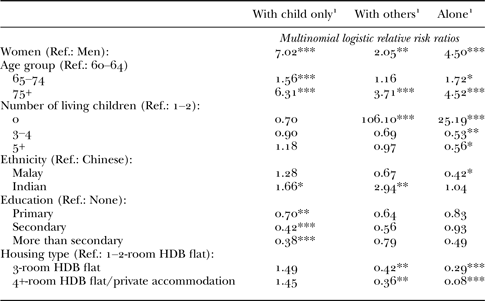
Table 2 shows the adjusted results from multinomial logistic regressions predicting living arrangement by our socio-demographic predictor variables: gender, age group, number of living children, ethnicity, education and housing type. The models are adjusted for two measures of health status of older adults: number of ADLs or IADLs, and number of chronic illnesses.
Socio-demographic predictors of living arrangements, 2009

Notes: N = 3,063 (those with missing values for any covariate are excluded). 1. The reference category is with spouse and child or spouse only. Results are weighted and adjusted for older person's number of activities of daily living or instrumental activities of daily living and number of chronic diseases. HDB: Housing and Development Board.
Significance levels: * p < 0.05, ** p < 0.01, *** p < 0.001.
The results show that compared to older men, older women are two to seven times more likely to live with a child only, live with others or live alone compared to living with a spouse and child or spouse only. As older adults age, they are more likely to be in living arrangements other than living with a spouse and child or spouse only, particularly older adults who are 75 years and older. As expected, childless older adults are more likely to live with others or alone and older adults with three or four children or five or more children are less likely to live alone compared to older adults with one or two children. Compared to Chinese older adults, Indian older adults are more likely to live with a child only or with others, while Malay older adults are less likely to live alone compared to older adults who live with a spouse and child or spouse only. With increasing education, older adults are less likely to live with a child only compared to living with a spouse and child or spouse only. Our adjusted results do not show any significant differences by education between older adults living with a spouse and child or spouse only, and older adults living with others or alone. Housing type is used as a proxy for income in the models. The results show that living with a child only does not differ significantly by housing type. Older adults who live in larger households (of higher income) are less likely to live with others or live alone compared to older adults who live in one- or two-room HDB flats.
Consequences of living arrangements
Social and economic wellbeing
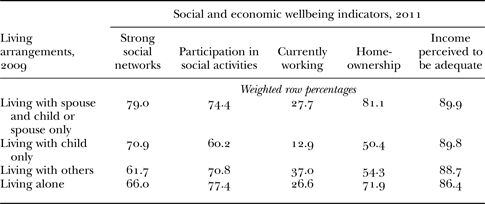
Table 3 shows the bivariate associations between living arrangements in 2009 and the five social and economic wellbeing indicators in 2011 – strong social networks, participation in social activities, currently working, home-ownership and income perceived to be adequate. Chi-square tests indicate that the differences by living arrangements are significant at p < 0.05 for all indicators except for income perceived to be adequate.
Bivariate associations of living arrangements (2009) with social and economic wellbeing (2011)

Note: Missing values on outcome variables are excluded.
Significance level: Chi-square tests indicate that except for income perceived to be adequate, all differences by living arrangements are significant at the p < 0.05 level.
In terms of social wellbeing indicators, older adults with strong social networks ranged from 62 to 79 per cent across the different living arrangements. Older adults who live with a spouse and child or a spouse only are the most likely to have strong social networks, followed by older adults who live with a child only, older adults who live alone and older adults who live with others. High proportions (72–74%) of older adults who live with a spouse and child or a spouse only and older adults who live alone participated in social activities. Older adults who live with a child only are least likely to participate in social activities – only 60 per cent participated in social activities. In terms of economic wellbeing, 81 per cent of older adults who live with a spouse and child or a spouse only and 72 per cent of older adults who live alone owned their own homes, while only half of older adults who live with a child only or older adults who live with others owned their own homes. While about 37 per cent of older adults who live with others are currently working, only 13 per cent of older adults who live with a child only are currently working. Similar proportions (27–28%) of older adults who live with a spouse and child or with a spouse only and older adults who live alone are currently working. The proportions (86–89%) of older adults who perceive their income to be adequate are similar across all living arrangements.
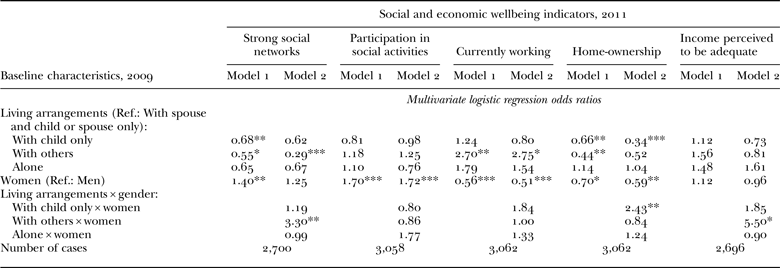
Table 4 shows the results from logistic regression analyses of the association of living arrangements in 2009 and social and economic wellbeing in 2011. Model 1 presents odds ratios of living arrangements and gender controlling for key socio-demographic and health characteristics of the elderly at Wave 1 that include gender, age, number of living children, ethnicity, education, housing type, number of ADLs or IADLs, and number of chronic diseases. We also control for baseline social and economic wellbeing indicators.
Living arrangements (2009) and social and economic wellbeing (2011)

Notes: Results are weighted and are adjusted for age group, number of living children, ethnicity, education, housing type, number of activities of daily living or instrumental activities of daily living, number of chronic diseases and Wave 1 wellbeing status. Missing values on any covariate or outcome variables are excluded.
Significance levels: * p < 0.05, ** p < 0.01, *** p < 0.001.
Confirming the bivariate results, adjusted results show that compared to older adults who live with a spouse and child or a spouse only, older adults who live with a child only or older adults who live with others are significantly less likely to have strong social networks and are significantly less likely to own their own homes; older adults who live with others are significantly more likely to be currently working; and the differences in perceived income adequacy by living arrangements remain statistically insignificant. In contrast to the bivariate results, adjusted results show that older adults who live alone are equally likely to have strong social networks compared to older adults who live with a spouse and child or a spouse only. Participation in social activities does not differ significantly between older adults who live with a spouse and child or a spouse only and older adults who live in other living arrangements. In results not shown, older adults who live with a child only are significantly less likely to participate in social activities but this effect disappears after controlling for health status of the older adults. Similarly, while the bivariate results showed that older adults who live with a child only are less likely to be currently working, this is not evident in the adjusted multivariate results. This suggests that older adults who live with their children are older, frailer and hence less able to participate in social activities or remain active in the labour market. There are significant gender differences in social and economic wellbeing. Older women are more likely to have strong social networks and participate in social activities but are less likely to be currently working and own their own homes compared to older men.
Given that living arrangements differ considerably between men and women at older ages, in Model 2 (Table 4) we include an interaction term between gender and living arrangements. Interactions between gender and living arrangements are significant for the following outcomes: strong social networks, home-ownership and income perceived to be adequate. In separate models for men and women (results not shown), we found that (compared to older men who live with a spouse and child or a spouse only) older men who live with others are significantly less likely to have strong social networks and older men who live with a child only are significantly less likely to own their own homes. For women, those who live with others are significantly more likely to perceive their income to be adequate compared to older women who live with a spouse and child or a spouse only.
Emotional and physical wellbeing
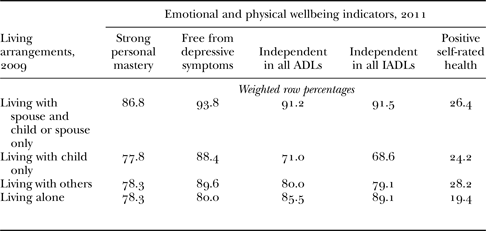
Table 5 shows the bivariate associations between living arrangements at Wave 1 and the five emotional and physical wellbeing indicators at Wave 2: strong personal mastery, free from depressive symptoms, independence in all seven ADLs, independence in all seven IADLs and positive self-rated health. Except for positive self-rated health, chi-square tests indicate that all associations are significant at the p < 0.05 level.
Bivariate associations of living arrangements (2009) with emotional and physical wellbeing (2011)

Notes: Missing values on outcome variables are excluded. ADLs: activities of daily living. IADLs: instrumental activities of daily living.
Significance level: Chi-square tests indicate that except for positive self-rated health, all differences by living arrangements are significant at the p < 0.05 level.
Bivariate associations show that older adults who live with a spouse and child or with a spouse only fare the best in strong personal mastery – 87 per cent have strong personal mastery compared to 78 per cent among older adults who live in other living arrangements. They also fare better in being free from depressive symptoms and being independent in ADLs and IADLs: over 90 per cent are free from depressive symptoms and independent in ADLs and IADLs. Older adults who live alone are the least likely to be free from depressive symptoms (80%) while older adults who live with a child only are least likely to be independent in ADLs and IADLs (69–71%). Positive self-rated health does not differ significantly by living arrangements.
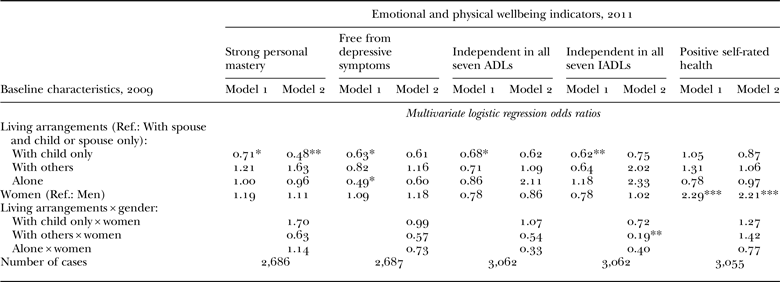
Multivariate results from logistic regression analyses are shown in Table 6. Similar to Table 4, Model 1 controls for baseline socio-demographic and health characteristics of older adults as well as baseline emotional and physical wellbeing indicators. Model 2 adds an interaction term between gender and living arrangements.
Living arrangements (2009) and emotional and physical wellbeing (2011)

Notes: Results are weighted and are adjusted for age group, number of living children, ethnicity, education, housing type, number of activities of daily living or instrumental activities of daily living, number of chronic diseases and Wave 1 wellbeing status. Missing values on any covariate or outcome variables are excluded.
Significance levels: * p < 0.05, ** p < 0.01, *** p < 0.001.
Results in Model 1 show that similar to the bivariate associations, out of the five health outcomes positive self-rated health does not differ significantly by living arrangements. For all other health outcomes, older adults who live with a child only are particularly disadvantaged. Older adults who live with a child only are less likely to be free from depressive symptoms, less likely to have strong personal mastery, and are less likely to be independent in all seven ADLs and IADLs compared to older adults who live with a spouse and child or a spouse only. While older adults who live alone are significantly less likely to be free from depressive symptoms, they do not differ significantly from older adults who live with a spouse and child or a spouse only in any of the other emotional and physical wellbeing indicators after adjusting for socio-demographic and health indicators. In the multivariate results, older adults who live with others are also not significantly different from older adults who live with a spouse and child or a spouse only in any of the health indicators.
Older women and men differ only in terms of self-rated health – Older women are 2.3 times more likely than older men to rate their health positively. The only significant interaction effect is among older women who live with others. Separate models for men and women (results not shown) indicated that while older women who live with others are significantly less likely to be independent in all IADLs, older men who live with others are significantly more likely to be independent in all IADLs compared to those who live with a spouse and child or a spouse only.
Discussion
Our results highlight that older adults in Singapore continue to co-reside with their spouse, children or both. Almost two-thirds live with their spouse and child or spouse only and one-quarter live with their child only. There has been very little change in living arrangements of older Singaporeans over the two-year period considered. Particularly among older adults who live with their spouse, child or both in 2009, 80–90 per cent of these older adults continue to do so in 2011. Although co-residence is common in many Asian countries, Singapore is unique in that it has maintained relatively high levels of co-residence in comparison to other countries in South-East Asia despite the rapid pace of socio-economic development that has occurred over the past several decades. Part of the reason for the continued high levels of co-residence in the country can be attributed to its government policies heavily promoting familial care for older adults. Incentives such as tax deductions, housing subsidies and priority housing to children who co-reside with their parents have been put in place to encourage co-residence, with the assumption that family should be the first line of defence at old age and that co-residence ensures social integration and the emotional wellbeing of older adults (Chan Reference Chan1997; Frankenberg, Chan and Ofstedal Reference Frankenberg, Chan and Ofstedal2002). It is, however, important to acknowledge that despite government policies favouring co-residence, 5 per cent of older Singaporeans, whether by choice or by circumstances, live with others and 6 per cent live alone. This proportion of older adults who live alone has increased from 2 per cent in 1988 and is expected to more than double by 2030 (Ng et al. Reference Ng, Jin, Feng, Nyunt, Chow, Feng and Fong2015).
Aside from the larger policy context, living arrangements differ by individual socio-demographic characteristics. Results for Singapore follow the expected and consistent pattern found in many other contexts: being older, female and with fewer children increases the risk of living alone or with others at old age. Beyond the scope of these analyses are other characteristics of children such as age, gender, education, income and marital status, which also may be important determinants of living arrangements of older adults. Ethnic differences are prominent in the Singaporean context even after controlling for demographic and socio-economic differences between the groups. Compared to the Chinese, Malays are less likely to live alone and Indians are more likely to live with their children or with others. The higher their education, Singaporean older adults are more likely to live with their spouse and child or spouse only and less likely to live with a child only, while the propensity to live with others or alone (compared to living with a spouse and child or spouse only) does not differ by education. While housing type, as a proxy for income, shows that older Singaporeans with higher income are less likely to live alone or with others, a limitation of using housing type is that this finding may rather be a reflection of the size of the dwelling rather than income per say.
How do older Singaporeans in different living arrangements fare on a broad range of social, economic and health indicators? Prior literature has focused extensively on living arrangements and health outcomes with the consistent finding that older adults who live with a spouse in old age, with or without the presence of children, fare the best particularly in terms of emotional and physical wellbeing. Our results lend further support to this finding, particularly in the bivariate analyses that showed that older adults who live with a spouse and child or a spouse only fared the best in personal mastery and depressive symptoms. However, this is not always the case in the multivariate adjusted models. It is older adults who live with a child only that fare the worst in emotional health (personal mastery and depressive symptoms) and physical health (ADLs or IADLs) compared to older adults who live with a spouse and child or a spouse only. In fact, older adults who live alone only fared worse in terms of depressive symptoms compared to older adults living with a spouse and child or a spouse only. These findings are in line with previous studies in Singapore documenting that it is not only living alone but also living with children only that are risk factors for depression among older adults (Chan et al. Reference Chan, Malhotra, Malhotra and Ostbye2011; Lim and Kua Reference Lim and Kua2011).
The main contribution of our study is on the link between living arrangements and social and economic wellbeing which has been given far less attention in the literature. In one of the few studies focusing on social and economic aspects of elderly wellbeing, Teerawichitchainan, Knodel and Pothisir (Reference Teerawichitchainan, Knodel and Pothisir2015) showed that although older adults living alone were more likely to be depressed, they were as socially participatory as older adults in other living arrangements in a cross-sectional comparative study of Myanmar, Vietnam and Thailand. We extend their study in the context of Singapore using a longitudinal design. The results of our study similarly show that older adults living alone are not particularly disadvantaged compared to older adults living with a spouse and child or a spouse only in terms of their social and economic wellbeing. It is older adults who live with a child only and older adults who live with others (compared to older adults who live with a spouse and child and a spouse only) that are disadvantaged in terms of strong social networks (outside the household) and home-ownership, and this is particularly so for older men. Older men who live with others (compared to older women) seem to be especially disadvantaged with regards to having weaker social networks and older men who live with a child only are disadvantaged in terms of owning their own homes.
It is encouraging that older Singaporeans are equally likely to participate in social activities, equally likely to participate in economic activities (work) and equally likely to perceive their income to be adequate regardless of living arrangements. In fact, older adults who live with others are more likely to be currently working, compared to older adults who live with a spouse and child or a spouse only. This, however, may suggest a financial need (rather than preference) to continue working. Nonetheless, we find that older women who live with others (compared to older women who live with a spouse and child or a spouse only) are more likely to perceive their income to be adequate and this may very well be because of their financial independence from being engaged in income-generating economic activities.
Though our study is based on a large and nationally representative sample, allowing generalisability to the older population of Singapore, the present analysis has a number of limitations that need to be considered when interpreting the findings. First, the study is limited in that our sample does not include older adults that are in institutional settings in 2009 or who have been institutionalised between 2009 and 2011. This, however, is likely to be a small proportion. Only 2 per cent of the older adult population occupies nursing home beds available in Singapore (Ansah et al. Reference Ansah, Matchar, Love, Malhotra, Do and Chan2012). Second, while we have addressed concerns of confounding by including baseline social, economic and health indicators as controls in our models, there is still a possibility that our associations of baseline living arrangements on Wave 2 outcomes are confounded since health, social and economic wellbeing are likely to structure baseline living arrangements. Third, we have not considered changes in living arrangements between baseline and follow-up in our analyses. Our descriptive results show that there has been very little change in living arrangements over the two-year period considered suggesting that the bias may be minimal.
Conclusion
With demographic changes such as increasing life expectancy, rising singlehood and childlessness accompanied by socio-economic development, further changes in living arrangements of older Singaporeans are inevitable, with the number of older Singaporeans living alone expected to more than double by 2030 (Ng et al. Reference Ng, Jin, Feng, Nyunt, Chow, Feng and Fong2015). Government policy in Singapore has always maintained that the family should be the first line of support for older adults and generally assumes that co-residence ensures social, economic and emotional wellbeing. However, our study shows that older adults living with their children are in fact disadvantaged in many aspects of social, economic and health indicators. Their functional limitations also preclude their participation in social activities. Thus, it is imperative that older adults living with families (along with older adults living with others and living alone) are engaged in broader social activities to ensure their wellbeing in old age.
Acknowledgements
Support for this work was provided by the NUS-Tsao Ageing Research Initiative, Faculty of Arts and Social Sciences, National University of Singapore. Data utilized for this manuscript was collected through a project funded by the Ministry of Social and Family Development, Singapore. This research was also supported by the Singapore Ministry of Health’s National Medical Research Council under its Singapore Translational Research Investigator Award as part of the project “Establishing a Practical and Theoretical Foundation for Comprehensive and Integrated Community, Policy and Academic Efforts to Improve Dementia Care in Singapore” (NMRC-STAR-0005-2009). We acknowledge research assistance provided by Jane Lim.