


Introduction
The way in which the distribution and phenology of organisms varies over space and time is of fundamental significance to many questions in ecology. Spatial heterogeneity in resources and environmental conditions drive geographical patterns in the ecology of all species, determining variation in community and population processes. Understanding how spatial variation in environmental conditions affects the demography and population dynamics of species is critical to effective management and conservation. This is particularly important in the face of rapidly changing environments and climate change (Vinatier et al., Reference Vinatier, Tixier, Duyck and Lescourret2011).
In general, understanding how environmental variation drives species phenology relies upon matching patterns of the abundance of a species over space and time with underlying environmental correlates. However, this approach involves inherent analytical difficulties associated with spatial and temporal autocorrelation (Hoeting, Reference Hoeting2009). Moreover, for highly abundant and temporally fluctuating species such as insects, problems arise from dealing with overdispersed and skewed data, and data containing a large proportion of zeros (e.g. Sileshi, Reference Sileshi2006). Understanding the environmental drivers of phenology and abundance in many insect species is increasingly important for pest management (Rodeghiero & Battisti, Reference Rodeghiero and Battisti2000; Eber, Reference Eber2004) and assessing risk of vector-borne diseases (Gern et al., Reference Gern, Cadenas and Burri2008; Takken et al., Reference Takken, Verhulst, Scholte, Jacobs, Jongema and van Lammeren2008; Yang et al., Reference Yang, Brook, Whelan, Cleland and Bradshaw2008; Parham & Michael, Reference Parham and Michael2010). Vector abundance and seasonal dynamics are important determinants of variation in the risk of vector-borne infections, forming key components of R0 models for assessing disease spread (Heffernan et al., Reference Heffernan, Smith and Wahl2005). For orbiviral pathogens of livestock, the periods of highest disease impact each year and the ability to persist between years is intimately linked to the climate-mediated seasonal dynamics of their biting midge vectors, Culicoides spp. (Diptera: Ceratopogonidae). This is particularly true in temperate systems where there is typically a vector-free period of several months over winter.
Methodologies for analysing insect phenology data across space and time include the use of generalised additive models (e.g. Saldaña et al., Reference Saldaña, Lima and Estay2007; Hodgson et al., Reference Hodgson, Thomas, Oliver, Anderson, Brereton and Crones2010) or population models (e.g. Yang et al., Reference Yang, Brook, Whelan, Cleland and Bradshaw2008, Reference Yang, Brook and Bradshaw2009) to examine the influence of environmental drivers on abundance patterns of insect species. However, these methods typically require long time-series of data, and the preponderance of such studies has focused on tropical species that reproduce year round. Therefore, disentangling the importance of environmental drivers in different critical periods of the year for seasonal species remains elusive. Previously, methods for analysing the seasonality and survival of blood-sucking insects in general, and Culicoides in particular, have relied upon parity-based methods (MacDonald, Reference MacDonald1957; Birley & Boorman, Reference Birley and Boorman1982; Holmes & Birley, Reference Holmes and Birley1987; Lord & Baylis, Reference Lord and Baylis1999). Parity-based methods use sampling of parous and nulliparous individuals within a population to estimate the survival rate of haematophagous insects. However, these methods have rarely been applied to understanding the role of environmental variables in driving patterns of seasonality and survival. Parity-based methods have provided important advances in the understanding of Culicoides phenology, but are not easily extended to analyses of phenological variation over space and time, and are bound by several important limiting assumptions: daily sampling data is required or samples must be taken over an entire season, a constant proportion of the population must be sampled at each time step, there must be no bias in sampling between nulliparous and parous individuals, all losses from the population are assumed due to mortality, and the survival rate must be constant over the time period considered (Birley & Boorman Reference Birley and Boorman1982; Lord & Baylis, Reference Lord and Baylis1999). Moreover, recent work has questioned the use of pigmentation of the abdomen as a method for determining parity in Culicoides sp. (Braverman & Mumcuoglu, Reference Braverman and Mumcuoglu2009). In light of these restrictions, and the growing urgency in achieving a better understanding of the environmental drivers of insect seasonality for disease risk and control, there is a need for new methodologies for examining trends in vector abundance across space and time that are less data-hungry, and less bound by restrictive assumptions.
Here, we present a methodology for linking environmental correlates with the phenology of two Palearctic species of Culicoides, using weekly abundance data collected across Scotland over a two-year period. Culicoides pulicaris is a farm-associated species and a candidate vector for recent Bluetongue epidemics in Europe (Caracappa et al., Reference Caracappa, Torina, Guerico, Vitale, Calabro, Ferrantelli, Vitale and Mellor2003; Purse et al., Reference Purse, Tatem, Caracappa, Rogers, Mellor, Baylis and Torina2004). The geographic range of C. pulicaris extends across the Palaearctic region to Pakistan and the Middle East (Institute for Animal Health, 2011). Culicoides impunctatus is a heathland-associated species, occurring throughout the UK and northern Europe (Boorman, Reference Boorman1986), but extending less far south, into the Iberian Peninsula (Hill, Reference Hill1947; Boorman, Reference Boorman1986). This species breeds in acidic, boggy ground and is infamous for causing high nuisance impact on the forestry and tourist industries (Hendry & Godwin, Reference Hendry and Goodwin1988), being responsible for 70–95% of Culicoides spp. attacks on humans (Boorman, Reference Boorman1986) across Scotland. We chose not to model the C. obsoletus complex in this study because of difficulties in interpretation associated with modelling a complex of species for which individual species-level data was not available. Both C. pulicaris and C. impunctatus exhibit large fluctuations in abundance on weekly timescales, and hence our methodology had to deal with highly overdispersed count data with many zero values. By implementing a combination of smoothing functions and Bayesian regression models, we aimed to identify critical timing of abundance peaks in each year of data collection for both species and to correlate these with environmental drivers. Most life history parameters of Culicoides are known to be sensitive to temperature and moisture levels (see Mellor et al., Reference Mellor, Boorman and Baylis2000 for a review) though their precise impacts on Palearctic species are poorly described. Our framework incorporates freely available, remotely sensed correlates of temperature, previously found to be of value in explaining patterns in midge vector abundance (Baylis et al., Reference Baylis, Mellor, Wittmann and Rogers2001; Tatem et al., Reference Tatem, Baylis, Mellor, Purse, Capela, Pena and Rogers2003; Purse et al., Reference Purse, Tatem, Caracappa, Rogers, Mellor, Baylis and Torina2004).
Methods
Trapping sites and methods
Scotland was divided into quadrats of 40 × 40 km, and 37 farms in separate quadrats were selected for weekly light-trap surveillance between April and November in 2008 and 2009. Geographical coordinates for all traps sites were determined using the GPS facility of a BlackBerry Storm 9500 Smartphone (Research in Motion Ltd, Egham, Surrey, UK). Catches were carried out using Onderstepoort-type blacklight traps with 8 W UV-light bulbs and down-draught suction motors. Traps were operated for one night per week, from approximately 19:00 to 08:00 h and were located outside close to livestock and positioned with the UV-light tube approximately 1.6 m above the ground. Insects were collected into a plastic beaker containing 200–300 ml of water with detergent as a wetting agent. Culicoides spp. were separated from other insects under a binocular dissecting microscope on the basis of wing patterns. Culicoides pulicaris s.s. and C. impunctatus were identified on the basis of wing patterns, after Campbell & Pelham-Clinton (Reference Campbell and Pelham-Clinton1960) and Rawlings (Reference Rawlings1996), and then counted. For large catches (>300 individuals), a subsample of the catch was speciated as described in Van Ark & Meiswinkel (Reference Van Ark and Meiswinkel1992) and the total number of individuals multiplied by the inverse of this proportion to calculate an adjusted abundance. Only females were considered in the statistical analysis since male Culicoides do not blood feed and are unimportant either as vectors or as causes of biting nuisance and often make up a small proportion of adults caught in light traps (∼5% in this study). Parous and nulliparous females were distinguished by examining the colouration of their abdominal walls as described by Dyce (Reference Dyce1969). The abdominal wall tissue of gravid females develops burgundy-red colouration during the development of ovarian follicles. The colouration persists in the abdomen walls and can be used to distinguish nulliparous and parous Culicoides females.
Environmental drivers
We derived a series of temperature, precipitation and landcover metrics for each trapping site. Weekly mean temperatures for each site were calculated using the MODIS Land Surface Temperature and Emissivity eight-day product (MOD11A2) at a resolution of 1 km (Wan & Li, Reference Wan and Li1997). These data are distributed by the Land Processes Distributed Active Archive Center (LP DAAC), located at the US Geological Survey (USGS) Earth Resources Observation and Science (EROS) Center (lpdaac.usgs.gov). Daily precipitation data was derived from the ENSEMBLES model at a resolution of 25 km (Haylock et al., Reference Haylock, Hofstra, Klein Tank, Klok, Jones and New2008). We acknowledge the E-OBS dataset from the EU-FP6 project ENSEMBLES (http://ensembles-eu.metoffice.com) and the data providers in the ECA&D project (http://eca.knmi.nl). Landcover estimates were taken from the CORINE 2000 Landcover Map (EEA, 2000). Using these time-series of temperature and precipitation data, we derived a suite of seasonal metrics for use in the analysis (table 1). Environmental covariates were centred prior to model fitting to improve the efficiency of sampling in the MCMC chain (McCarthy, Reference McCarthy2007). This adjustment has no effect on the regression slope coefficients, although the intercept is altered, hence back-transformed posterior means for intercept estimates are reported here.
Environmental drivers used in analysis of Culicoides appearance and abundance models in Scotland during 2008 and 2009.

Models
Because of the difficulties inherent to analysing short time-series of abundance data from species as numerous and temporally variable as Culicoides midges, we adopted a two-phase modelling approach. We first fit generalised additive models (GAMs) to a three-week moving average of the number of nulliparous midges caught per week at each trapping location. These models assumed a Poisson distribution with a log link and used a three-week moving average of the raw count data to reduce spurious temporal changes in abundance due to variation in meteorological conditions during the weekly trapping effort. A separate model was fit for each site, and year of data was collected to identify the peaks in abundance for each trapping location in each year of data collection. These models were used to identify the timing of the peak in abundance for different generational peaks for both species at each site in each year. GAMs used a spline smoothing function and all models were fit in R using the ‘mgcv’ package (Wood, Reference Wood2011). For all sites, the degree of smoothing was automatically selected using generalised cross validation. Sites for which there were missing data (more than two consecutive weeks of trapping lost per year) were dropped from subsequent analyses.
Having identified the timing of the first and second generational peaks for each species, we derived phenological traits to depict the seasonal change in Culicoides abundance across Scotland: the timing of the first and, if present, second generational peaks, the abundance associated with the first generational peak, the abundance associated with the second generational peak, and the difference in abundance between the first and second generational peaks (log[abundance first peak]/log[abundance second peak]). Abundance estimates for each generational peak were taken as the six-week average in the total number of female midges trapped per site associated with the timing of each generational peak identified by the GAMs (none of the identified six-week periods for each generational peak overlapped for either species). We averaged counts of female midges over six weeks because this has previously been estimated as the generation period for C. impunctatus in Scotland (Kettle, Reference Kettle1950; Blackwell et al., Reference Blackwell, Mordue, Young and Mordue1992).
The second phase of the analysis used linear mixed models (GLMMs) to relate these phenological traits to environmental drivers. The basic structure of these models related each phenological trait with a series of environmental drivers, assuming linear relationships. All models included a random intercept term for each year of measurement and a random site effect term to account for unstructured spatial heterogeneity not explicitly included in the regression model. Residuals from all models were checked for spatial autocorrelation (Moran's I, spdep package in R).
Correlation analyses (Pearson's r, R software program) were used to check for correlations between all of the environmental variables used in the GLMMs. No pair of variables showed a correlation greater than 0.5 (Pearson's correlation), and so all possible combinations of variables were used in the models. Deviance information criterion (DIC: Speigelhalter et al., Reference Speigelhalter, Best, Carlin and Van Der Linde2002) was used to select variables to find the most parsimonious model for each phenological trait. DIC is a generalisation of the Akaike information criterion (AIC) and is derived as the mean deviance adjusted for the estimated number of parameters in the model, compromising between model fit and complexity, and providing a measure of out-of-sample predictive error (Gelman & Hill, Reference Gelman and Hill2007). The mean deviance can be calculated from the posterior mean log likelihood, i.e. the average of the log likelihood values calculated from the parameters in each sample from the posterior. Smaller values of DIC are indicative of a better-fitting model, and we used delta DIC values to compare support in the data for each model. When comparing two models, a delta DIC value of less than two indicates substantial support for both models, a value of four to seven indicates considerably less support for the model with the larger DIC, and a value of greater than ten indicates essentially no support for the model with the larger DIC (McCarthy, Reference McCarthy2007).
Timing of the first and second peaks in abundance
Models for the timing of the first and, if present, second generational peaks assumed that the data were drawn from an underlying normal distribution. We assumed that the mean of this distribution had a linear relationship with environmental drivers:
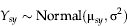 $$Y_{sy} \sim {\rm Normal}({\rm\mu} _{sy}, {\rm\sigma} ^2 )$$
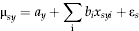 $${\rm\mu} _{sy} = {a}_{y} + \sum\imits_{\rm i} {b_i x_{syi} + {\rm\varepsilon}_s} $$
where Y s,y are the week of appearance at site s in year y; μsy is the mean of the normal distribution (the process model estimate for timing of the first peak at each site s in each year y); x syi is the value of environmental variable i in year y at site s; σ2 is the residual variance in the data not explained by site, year or environmental variables; a y is the random intercept term for each year of measurement; b i are the regression coefficients for the environmental drivers; and εs accounts for unstructured spatial heterogeneity (random site effect).
Size of the first and second peaks
Counts from surveillance data are most appropriately modelled using a Poisson distribution. However, insect data are generally highly overdispersed, which presents difficulties in achieving convergence in Markov Chain Monte Carlo simulations when models include multiple random effects for spatial heterogeneity and overdispersion. Therefore, the abundance at each site per year during the first and second generational peaks was log transformed, and modelled assuming a normal distribution assuming a linear relationship with environmental drivers. The structure of the model for log abundance was identical to that for timing.
Difference in size between first and second peaks
The log difference in size between the abundance of the first and second generational peaks,  $D_{s,y} =\log \left( {\textstyle{{{\rm abundance \ of \ first \ peak}} \over {{\rm abundance \ of \ second \ peak}}}} \right)$, was also assumed to have a normal distribution. The structure of the model was identical to that for timing. Larger values of D s,y indicate a larger first abundance relative to the second abundance, within a particular site and year, suggesting greater mortality during the time interval between peak abundance sizes.
Inference
All models were fit using BRugs on the R platform (R-Development Core Team, 2009) and OpenBUGS software (Lunn et al., Reference Lunn, Spiegelhalter, Thomas and Best2009). Models were run for 100,000 iterations with three MCMC chains and a burn-in period of 50,000 iterations for each chain. MCMC samples were thinned to every 10th sample when necessary (due to autocorrelation in the MCMC chains), giving a total of 5000 (thinned) or 50,000 (unthinned) samples per chain. Model fit was checked using trace plots and the Gelmin-Rubin statistic for scale reduction factors (Gelmin & Rubin, Reference Gelman and Rubin1992).
Mean parous rate
The mean parous rate,  ${{\sum\nolimits_{s = 1}^{15} {P_s}} \over {\sum\nolimits_{s = 1}^{15} {NP_s + P_s}}} $ (MacDonald, Reference MacDonald1952), where P and NP are the total number of parous and nulliparous females trapped at each of the sites for C. pulicaris (n = 27) and C. impunctatus (n = 23), can be used to estimate survival rates when data has been collected over the entirety of the season (Birley & Boorman, Reference Birley and Boorman1982). We used the trapping data to estimate mean survival rates between blood meals for C. pulicaris and C. impunctatus.
Results
Sites selected
After eliminating sites with gaps in time-series trapping data, 27 sites were selected for analysis for C. pulicaris and 23 for C. impunctatus in both 2008 and 2009 (fig. 1). Of the 27 sites used for C. pulicaris, 22 showed second generational peaks in 2008 and 21 in 2009; and, of the 23 sites used for C. impunctatus, 16 showed second generational peaks in 2008 and 12 in 2009. Model fit for the generalised linear models was good across all species and sites (adjusted R2 > 0.70; fig. 2).
Location of trapping sites for C. pulicaris (grey dots) and C. impunctatus (open circles).

Time-series for abundance counts (dots are three week moving average) and fitted Generalised Additive Models (solid line) for C. pulicaris and C. impunctatus at eight trapping sites during 2008.

Culicoides pulicaris constituted approximately 16% in 2008 and 11% in 2009 of the total yearly catch of all females Culicoides across all 37 sites, whilst C. impunctatus made up approximately 25% in 2008 and 42% in 2009. The C. obsoletus group constituted approximately 5% in 2008 and 44% in 2009. Six other species were present in very low numbers: C. punctatus, C. grisescens, C. deltus, C. fagineus, C. newsteadi and C. nubeculosus.
Environmental variables
Of the three landcover types evaluated, pasture was the most prevalent around the trapping sites (fig. 3). Percent cover of agriculture and heathland was low, although a few sites had high percent cover values (fig. 3). Comparing annual mean environmental variables for the sites selected for analysis showed that sites accumulated similar amounts of degree days in 2008 and 2009; however, the variability (standard deviation) between sites was greater in 2009 than in 2008 (fig. 3). Mean temperature in winter was slightly higher in 2008 than in 2009, but mean temperature in the spring was slightly higher in 2009 than in 2008. Mean temperature in June and July was slightly lower, and more variable, in 2008 than in 2009 (fig. 3). Spring precipitation was similar in both years but was more variable in 2009 (fig. 3). Summed precipitation in June and July was greater in 2008 than in 2009 (fig. 3).
Summary of environmental drivers used in GLMM models. Box plots show the median (central line), box denotes 25th and 75th percentiles, error bars represent 10th and 90th percentiles and dots are points outside the 10th and 90th percentiles.

Timing of generational peaks
Averaged across all sites, C. pulicaris abundance peaked earlier than C. impunctatus abundance in both years (mean date of first generational peak: C. pulicaris 4th June 2008 and 17th June 2009; C. impunctatus 25th June 2008 and 1st July 2009), although the mean timing of the second generational peak was similar for both species (C. pulicaris 20th August 2008 and 26th August 2009; C. impunctatus 13th August 2008 and 26th August 2009) (fig. 4). In 2008, we detected a significant negative correlation between the timing of the first and second peaks in abundance (Pearson's r = −0.48, t 20 = − 2.45, P = 0.023); however, this correlation was not significant in 2009 (Pearson's r = 0.38, t 19 = 1.80, P = 0.087). No significant correlations were detected between the timing of the first and second peaks for C. impunctatus (2008 Pearson's r = 0.46, t 14 = 1.91, P = 0.077; 2009 Pearson's r = 0.33 t 10 = 1.10, P = 0.30). We detected no significant spatial autocorrelation in the residuals from any of the best-fitting models.
Timing of first generational peak for C. impunctatus and C. pulicaris across Scotland in (A) 2008 and (B) 2009 identified by the fitted generalised additive models. Box plots show the median (central line), box denotes 25th and 75th percentiles, error bars represent 10th and 90th percentiles, and dots are points outside the 10th and 90th percentiles.

There were five models selected with a delta DIC value of less than two (indicating approximately equal support for all models) for the timing of the first generational peak for C. pulicaris (table 2). These five models included photoperiod, percent cover of agriculture, spring temperature and percent cover of pasture. However, only photoperiod and percent cover of agriculture showed significant correlations (95% credible interval does not bridge zero) with the timing of the first generational peak (table 2). Sites that exceeded eight hours of daylight earlier in the year had earlier peaks, and sites with a greater percent cover of agriculture in the surrounding 1 km2 had earlier peaks (table 2).
Model results for timing of first peak in abundance for C. pulicaris and C. impunctatus in Scotland during 2008 and 2009. Posterior means for variable intercepts (a) for 2008 and 2009, and slope parameters for environmental variables (b i) are shown with associated 95% credible intervals. The estimated number of parameters (pD), Deviance Information Criterion (DIC), and Gelmin-Rubin statistic for MCMC convergence (multivariate psrf) are shown for each model. Asterix (*) indicate significance for environmental variables. ΔDIC refers to the difference in DIC values between each model and the model receiving the greatest support in the data. Dotted line separates model with approximately equal support (ΔDIC < 2) from those with considerably less support.

Four models for the timing of the first generational peak for C. impunctatus had a delta DIC value of less than two (table 2). These models included photoperiod, degree days, winter temperature and percent cover of heathland (table 2). However, only photoperiod had a significant positive correlation with timing, indicating that sites at lower latitudes had earlier first generational peaks.
Three models for the timing of the second generational peak for C. pulicaris had delta DIC values of less than two, including combinations of June and July temperature, and percent cover of agriculture and pasture (table 3). Only mean June and July temperatures exhibited a significant positive relationship with the timing of the second peak, indicating that sites experiencing warmer summers had later second generational peaks.
Model results for timing of second peak in abundance for C. pulicaris and C. impunctatus in Scotland during 2008 and 2009. Posterior means for variable intercepts (a) for 2008 and 2009, and slope parameters for environmental variables (b i) are shown with associated 95% credible intervals. The estimated number of parameters (pD), Deviance Information Criterion (DIC), and Gelmin-Rubin statistic for MCMC convergence (multivariate psrf) are shown for each model. Asterix (*) indicate significance for environmental variables. ΔDIC refers to the difference in DIC values between each model and the model receiving the greatest support in the data. Dotted line separates model with approximately equal support (ΔDIC < 2) from those with considerably less support.

For C. impunctatus, five models selected had delta DIC values of less than two, including June and July precipitation, June and July temperatures, and percent cover of heathland (table 3). However, none of these variables showed a significant correlation with timing of the second peak for this species.
Model fit for the timing of the first peak for C. pulicaris was good (R2 = 0.91, F2,24 = 125, P < 0.001) and was reasonable for C. impunctatus (R2 = 0.61, F2,20 = 18.0, P < 0.001). Model fit for the timing of the second peak was poor for C. pulicaris (R2 = 0.28, F2,17 = 4.7, P = 0.023) but good for C. impunctatus (R2 = 0.80, F2,6 = 16.8, P = 0.0035).
Size of generational peaks
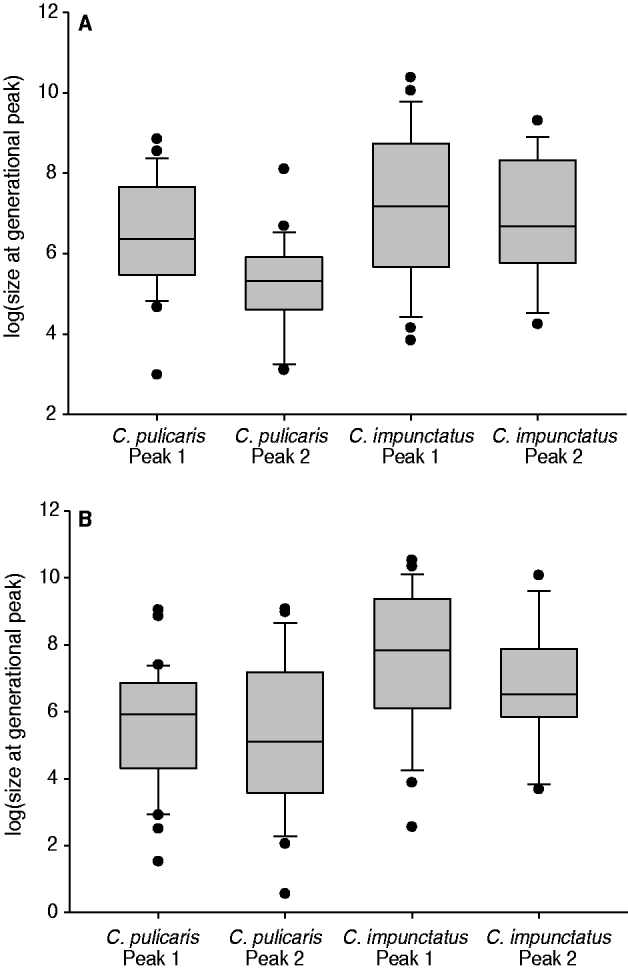
Culicoides impunctatus produced consistently larger peaks in abundance compared to C. pulicaris (mean size of first peak: C. impunctatus, 5284 in 2008 and 7603 in 2009; C. pulicaris, 1390 in 2008 and 748 in 2009; mean size of second peak: C. impunctatus, 2417 in 2008 and 3088 in 2009; C. pulicaris, 369 in 2008 and 1380 in 2009) (fig. 5).
Mean abundance of first and second generational peaks for C. pulicaris and C. impunctatus across Scotland in (A) 2008 and (B) 2009. Box plots show the median (central line), box denotes 25th and 75th percentiles, error bars represent 10th and 90th percentiles and dots are points outside the 10th and 90th percentiles.
No variables showed a significant correlation with the size of the first generational peak for C. pulicaris (table 4). The two best models included combinations of degree days, spring precipitation, pasture and spring temperature. Two models for C. impunctatus had delta DIC values of less than two and included combinations of photoperiod, degree days, spring precipitation and percent cover of heathland (table 4). Only photoperiod showed a significant positive correlation with the size of the first peak for this species, suggesting that sites which exceeded eight hours of daylight earlier in the year had smaller abundances during the first generational peak.
Model results for the size of the first peak in abundance for C. pulicaris and C. impunctatus in Scotland during 2008 and 2009. Posterior means for variable intercepts (a) for 2008 and 2009, and slope parameters for environmental variables (b i) are shown with associated 95% credible intervals. The estimated number of parameters (pD), Deviance Information Criterion (DIC), and Gelmin-Rubin statistic for MCMC convergence (multivariate psrf) are shown for each model. Asterix (*) indicate significance for environmental variables. ΔDIC refers to the difference in DIC values between each model and the model receiving the greatest support in the data. Dotted line separates model with approximately equal support (ΔDIC < 2) from those with considerably less support.

It was not possible to select between the four environmental variables used in models for the size of the second generational peak for C. pulicaris; all combinations of variables had DIC values within two of each other (table 5). However, the percent cover of pasture showed a significant positive relationship with the size of the second peak for this species, indicating that sites with a greater cover of pasture in the surrounding 1 km2 had higher abundances during the first generational peak. We found a significant positive relationship between the size of the first and second peaks in abundance for C. pulicaris that persisted in both years of study (2008 Pearson's r = 0.52, t 20=2.71, P = 0.013; 2009 Pearson's r = 0.45, t 19 = 2.17, P = 0.043). We, therefore, included the size of the first peak in the best-fitting model identified during environmental variable selection; and, indeed, this significant positive association was confirmed in the linear mixed model (table 5). The same positive correlation between the size of the first and second peaks was found for C. impunctatus (2008 Pearson's r = 0.73, t 14 = 3.95, P = 0.0014; 2009 Pearson's r = 0.65, t 10 = 2.69, P = 0.023). Similarly, we included the size of the first peak in the best-fitting model identified during environmental variable selection. This confirmed the significant positive correlation between the size of the first and second peaks but, interestingly, did not improve model fit over the best-fitting model, including only environmental variables (table 5).
Model results for the size of the second peak in abundance for C. pulicaris and C. impunctatus in Scotland during 2008 and 2009. Posterior means for variable intercepts (a) for 2008 and 2009, and slope parameters for environmental variables (b i) are shown with associated 95% credible intervals. The estimated number of parameters (pD), Deviance Information Criterion (DIC), and Gelmin-Rubin statistic for MCMC convergence (multivariate potential scale reduction factor) are shown for each model. Asterix (*) indicate significance for environmental variables. ΔDIC refers to the difference in DIC values between each model and the model receiving the greatest support in the data. Dotted line separates model with approximately equal support (ΔDIC < 2) from those with considerably less support.

For C. impunctatus, three models had delta DIC values of less than two, including combinations of June and July temperatures and percent cover of heathland (table 5). Estimates for both of these variables were positive (table 5); however, none of these variables showed a significant relationship with the size of the second generational peak.
Model fit for the size of the first peak for C. pulicaris was poor (R2 = 0.34, F2,24 = 7.7, P = 0.0027) but was very good for C. impunctatus (R2 = 0.97, F2,20 = 383.3, P < 0.001). Model fit for the size of the second peak was good for both C. pulicaris (R2 = 0.74, F2,17 = 28.2, P < 0.001) and for C. impunctatus (R2 = 0.98, F2,6 = 292, P = 0.001).
Difference in size of first and second peaks
Three models for C. pulicaris had delta DIC values of less than two, including percent cover of pasture and agricultural land; however, neither of these variables showed significant relationships with the difference in size between the first and second peaks (table 6). It was not possible to separate the importance of the three variables selected to assess the difference in size of peaks for C. impunctatus because none of the variables showed a significant relationship with the difference in size of peaks, and all three variables were selected in the best models, all of which had delta DIC values of less than two (table 6).
Model results for the difference in size between the first and second peaks in abundance (log [peak 1/peak 2]) for C. pulicaris and C. impunctatus in Scotland during 2008 and 2009. Posterior means for variable intercepts (a) for 2008 and 2009, and slope parameters for environmental variables (b i) are shown with associated 95% credible intervals. The estimated number of parameters (pD), Deviance Information Criterion (DIC), and Gelmin-Rubin statistic for MCMC convergence (multivariate psrf) are shown for each model. ΔDIC refers to the difference in DIC values between each model and the model receiving the greatest support in the data. No environmental variables were significant. Dotted line separates model with approximately equal support (ΔDIC < 2) from those with considerably less support.

Model fit for the difference in size of peaks for C. pulicaris was reasonable (R2 = 0.57, F2,17 = 13.4, P < 0.001) but was very good for C. impunctatus (R2 = 0.99, F2,6 = 1496, P < 0.001). Model fit for the size of the second peak was good for both C. pulicaris (R2 = 0.74, F2,17 = 28.2, P < 0.001), and for C. impunctatus (R2 = 0.98, F2,6 = 292, P = 0.001).
Mean parous rate
The mean parous rate for C pulicaris in 2008 was 0.33 (0.17 SD), which increased to 0.51 (0.22 SD) in 2009. Culicoides impunctatus has a mean parous rate 0.47 (0.22 SD) in 2008 and 0.42 (0.33 SD) in 2009.
Discussion
Insect abundance data presents challenges to statistical analysis, yet linking seasonal patterns of insect abundance to environmental drivers is critical for effective management of pests and disease. Researchers are often faced with supplying information to policy makers based upon short time-series of strongly fluctuating abundance data for species for which little ecological information is available. In this study, we have presented a methodology for linking environmental drivers with key phenological patterns of two Palearctic Culicoides species, using weekly abundance data collected from over just two years of observation. Importantly, the use of GAMs dealt with the large seasonal fluctuations in abundance exhibited by both of these species (coefficient of variation ∼7). Using a combination of smoothing functions and generalised linear mixed models, we identified critical timing of abundance peaks and identified correlations between abundance during these peaks and environmental drivers widely available from satellite and modelled temperature, precipitation and landcover data. Model fit for most phenological traits was good, particularly for C. impunctatus, for which all best-fitting models had adjusted R2 > 0.6 (four of the five models had R2 > 0.80). However, model fit for C. pulicaris was less good, especially for the timing of the second peak and the size of the first peak. This may be because the resolution of our environmental variables was insufficiently fine to detect correlations or because important driving variables were not included in the modelling framework, such as host density on surrounding farmland. Traps were only run for one night per week, which may also have led to spurious variation in catches caused by local microclimatic effects, for which we were unable to account in our models.
The timing of generational peaks identified using our modelling approach was reasonably consistent with previous empirical data on other UK populations of C. pulicaris and C. impunctatus. Emergence in spring has been observed to begin in late April/early May in C. pulicaris (Service, Reference Service1974; Holmes & Boorman, Reference Holmes and Boorman1987) and early May in C. impunctatus (Blackwell et al., Reference Blackwell, Mordue, Young and Mordue1992), which is consistent with our finding that the first generation of C. pulicaris peaks earlier than that of C. impunctatus.
For both species, our finding that the first generational peak was on average larger than the second was also consistent with previous studies in southern England, where the greatest numbers of adult C. pulicaris were caught in June (Service, Reference Service1974) or July (Service, Reference Service1968) and those of C. impunctatus in June (Hill, Reference Hill1947; Service, Reference Service1969; Boorman & Goddard, Reference Boorman and Goddard1970) or July (Parker, Reference Parker1949).
The positive association between timing of the first peak and the day of the year at which eight hours of daylight was passed in both species corroborates previous studies that have documented earlier emergence at lower latitudes within the UK (southern England: April/May: Service, Reference Service1968, Reference Service1969, 1974; Boorman & Goddard, Reference Boorman and Goddard1970; Holmes & Boorman, Reference Holmes and Boorman1987; Scotland: May/June: Blackwell et al., Reference Blackwell, Mordue, Young and Mordue1992). At present, we can only speculate on the underlying causes for the links this study identified between environmental variables and patterns of timing. Our finding that C. impunctatus sites experiencing warmer winters tended to have later first peaks in abundance may perhaps be related to a less synchronous overwintering period, and it is possible that drier conditions in the summer caused C. pulicaris sites experiencing warmer summers to have later second generational peaks. However, further study is required to more mechanistically link these associations with underlying ecological processes. The negative correlation identified in 2008 between the timing of the first and second peaks for C. pulicaris suggests that in this year, sites with earlier first peaks tended to have later second peaks, and vice versa. This may be reflective of sites with environmental conditions favourable for earlier emergence also tending to have conditions that allow for a longer season of activity or at least a wider second peak. However, it is difficult to interpret this finding with only two years of data; and, indeed, in the second year of study, this positive relationship was not detected. No significant correlations in the timing of generational peaks were identified for C. impunctatus, suggesting that for this species, the emergence of the second generation may be less strongly linked to that of the first generation than in C. pulicaris; but, again, this is very difficult to interpret with only two years of data.
Environmental factors governing the size of abundance peaks not only differed between species but also between the generations of a species, suggesting that the influence, particularly of climatic factors, can alter throughout the year. Given the life cycle of these palearctic species, abundance during the first generation is likely to be related to the suitability of conditions for survival and development of larvae overwinter from diapause, and the survival and rate of completion of the adult reproduction cycle. Similarly, abundance of the second generation is likely to be linked with survival and development of the larvae from eggs laid by the first generation (and, therefore, also to the size of the first generation) and to the survival and rate of completion of the adult reproductive cycle. No significant effects on the size of the first generational peak were detected for C. pulicaris, and only photoperiod was found to significantly impact the size of the first generational peak for C. impuncatus, with sites at higher latitudes tending to have larger abundances, possibly reflecting the more northerly distribution of this species. The positive impact of the percent cover of pasture on abundance during the second generational peak for C. pulicaris is consistent with previous studies for this livestock-associated species (Takken et al., Reference Takken, Verhulst, Scholte, Jacobs, Jongema and van Lammeren2008). The positive correlation between the size of the first and second peaks for C. pulicaris and C. impunctatus detected in both years is likely reflective of sites with favourable environmental conditions tending to produce larger abundances during both generational peaks. Including the size of the first peak in the best-fitting linear mixed model for C. pulicaris improved model fit substantially, but did not change the magnitude or significance of the effects of environmental variables, lending support to the robustness of the positive association between percent cover of pasture and the size of the second peak for this species. However, for C. impunctatus, including the size of the first peak in the best-fitting linear mixed model did not improve model fit over models including only environmental variables. Whether this result is indicative of a stronger effect of exogenous forces on abundance compared to intrinsic population dynamics in this species needs to be confirmed by further research. We detected no significant correlations for the difference in size between the first and second peaks in abundance for either species, suggesting that the environmental variables used in this analysis did not adequately capture the processes affecting mortality between peak abundances. It is also likely that the relatively low occurrence of heathland around the trapping sites meant that we sampled from relatively sub-optimal habitat for C. impunctatus populations. This may have been responsible for the lack of correlation between landcover variables and population size in this species.
The likely mechanisms underlying the variation between species and generations in observed climatic responses are unclear, due to the lack of life-history data for Palearctic species to assist in interpretation. Temperature has been found, largely from laboratory studies on temperate North American colony species, to have opposing effects on different stages of Culicoides life cycles. There are negative effects on fecundity (Linley & Hinds, Reference Linley and Hinds1976; Kramer et al., Reference Kramer, Greiner and Gibbs1985), and both adult (Hunt et al., Reference Hunt, Tabachnick and McKinnon1989; Wellby et al., Reference Wellby, Baylis, Rawlings and Mellor1996; Wittmann, Reference Wittmann2000) and larval survival rates, but positive effects on adult activity rates (e.g. mating, feeding) (Blackwell, Reference Blackwell1997; Kettle et al., Reference Kettle, Edwards and Barnes1998), rates of larval development and completion of the gonadotrophic cycle (in terms of both oocyte development and subsequent egg deposition (Linley, Reference Linley1966; Akey et al., Reference Akey, Potter and Jones1978; Edwards, Reference Edwards1982; Kitoaka, Reference Kitoaka1982; Mullens & Rutz, Reference Mullens and Rutz1983; Allingham, Reference Allingham1991; Mullens & Holbrook, Reference Mullens and Holbrook1991; Bishop et al., Reference Bishop, McKenzie, Barchia and Harris1996; Wittman, Reference Wittmann2000)).
We were unable to detect any influence of precipitation on the phenological traits for either species, perhaps because the resolution of the precipitation data (25 km2) was too coarse. The influence of precipitation on life history characteristics of Culicoides is not well documented; however, precipitation has been linked to the successful development of higher numbers of larvae (Mellor et al., Reference Mellor, Boorman and Baylis2000) due to the greater availability and permanence of semi-aquatic breeding sites.
The mean parous rate is an estimate of the survival rate per gonotrophic cycle, and the values deduced from this study for C. impunctatus in 2008 (0.47) and 2009 (0.42) are similar to that from a study in Argyllshire in southeast Scotland (0.57: Blackwell et al., Reference Blackwell, Mordue, Young and Mordue1992). The parity rate averaged across all sites for C. pulicaris was considerably lower in 2008 (0.33) than in 2009 (0.51), suggesting a degree of sensitivity to environmental conditions (i.e. the warmer spring and drier summer in 2009). The values for C. pulicaris from this study during 2009 are relatively high compared to the range of parity rate estimates for other temperate Culicoides species: 0.61 and 0.24 for C. variipennis in New York State (Mullens & Rutz, Reference Mullens and Rutz1984) and California (Work et al., Reference Work, Mullens and Jessup1991), and 0.38 for C. obsoletus in the UK (Holmes & Birley, Reference Holmes and Birley1987). We detected a third generational peak for several sites: five sites in 2008 and four sites in 2009 for C. pulicaris, and three sites with a third generation in 2008, and one site in 2009 for C. impunctatus. The third peaks were generally small in 2008 (range 10–334) but were considerably larger in 2009 at some sites (range 7–8671). These findings are suggestive of trivoltinism at some trapping locations for both C. pulicaris and C. impunctatus. Although we could find no records in the literature of trivoltinism for these species, a study in southern England suggested that C. obsoletus, a related temperate species, appears to be trivoltine (Birley & Boorman, Reference Birley and Boorman1982). This variation warrants further studies with daily trapping data to confirm voltinism in these species, particularly because of the potential influence a third abundance peak could have on disease transmission late in the vector season.
In summary, the techniques implemented in this study provide a framework for analysing short time-series of insect count data, dealing with widely fluctuating data containing a large proportion of zeros. Applying these techniques to a longer time-series of data would allow for analysis of environmental drivers of additional phenological traits such as overwintering mortality in temperate species, an area currently lacking in empirical study. Extending this approach to the analysis of insect count data across larger spatial and temporal scales is easily achieved, following well-established hierarchical GLMM methods for grouping data across space, time and species (e.g. Gelman & Hill, Reference Gelman and Hill2007). Though our current explanations of the mechanisms underlying the differential environmental responses of the species studied are somewhat speculative, this underscores the need for a greater understanding of the effects of temperature and precipitation on the life history traits of palearctic Culicoides spp. in Europe. Empirical studies that contrast the environmental responses of different Culicoides spp. within the same model framework are invaluable for enhancing this understanding, allowing season- and species-specific impacts to be detected and related to life history characteristics.
Acknowledgements
This work was supported by an internal NERC Centre for Ecology and Hydrology grant to B. Purse and trapping data was funded by a grant from the Scottish Government Rural and Environment Research and Analysis Directorate. This study was partially funded by EU grant FP7-261504 EDENext and is catalogued by the EDENext Steering Committee as EDENext050 (http://www.edenext.eu). The contents of this publication are the sole responsibility of the authors and don't necessarily reflect the views of the European Commission. We thank Jim Mcleod from the Macaulay Land Use Research Institute for supplying the soil and deer datasets. S. Carpenter provided useful discussions on Culicoides ecology. In particular, we thank the Scottish Agricultural College and a network of farmers across Scotland for assisting with Culicoides collections. We also thank two anonymous reviewers for their comments during the review process.



