I. INTRODUCTION
One of the distinctive characteristics of biological structural materials is their ability to autonomically repair progressive damage, or in other words to achieve self-healing. Reference Meyers, Chen, Lin and Seki1,Reference Winkelstein2 Typical examples are skin, bone or tendons, where the long term reparation occurs as a result of an initial damaging event. Reference Meyers, McKittrick and Chen3 Drawing inspiration from these natural systems, self-healing artificial materials have also been designed and produced, using diverse approaches and various constituents, from systems based on “microcapsules” containing a healing agent, Reference White, Sottos, Geubelle, Moore, Kessler, Sriram, Brown and Viswanathan4,Reference Sahni, Harris, Blackledge and Dhinojwala5 to “vascular-based” systems, Reference Toohey, Sottos, Lewis, Moore and White6,Reference Hansen, Wu, Toohey, Sottos, White and Lewis7 to “molecular-based” systems. Reference Brown, White and Sottos8,Reference Cordier, Tournilhac, Soulie-Ziakovic and Leibler9 In particular, self-healing was found to be particularly effective in increasing the fatigue life of composites Reference Brown, White and Sottos8,Reference Brown, White and Sottos10 and polymers, Reference Jones, Rule, Moore, Sottos and White11 where up to 90% recovery of fracture toughness was achieved. A review of approaches to self-healing in artificial materials can be found in Ref. Reference Murphy and Wudl12, while a review of numerical modeling methods applied to such systems is given in Ref. Reference BaLazs13.
In biological materials, damage generally evolves as a consequence of cyclic loading during the whole lifetime of a particular tissue. Tendons and ligaments are typical examples. Their function is to transmit forces between bones and muscles or bones and other bones, and are constituted essentially by type I collagen fibers. Reference Meyers, Chen, Lin and Seki1 As for other biological structural materials, they display a hierarchical structure that encompasses various size scales, ranging from collagen molecules (nanometer scale), to microfibrils, to fibrils, to fibers, to fiber fascicles, and to the final tissue itself (at cm scale). Reference Gautieri, Vesentini, Redaelli and Buehler14 Thus, tendons and ligaments can be considered an example of “soft nanomaterials”. From a mechanical point of view, they can be modeled as bundles of viscoelastic fibers organized in a hierarchical structure, cyclically loaded in the fiber direction in uniaxial tension. Thus, a fiber bundle model-like approach Reference Pradhan, Hansen and Chakrabarti15 with the inclusion of hierarchy and self-healing is ideally suited to simulate the mechanical behavior of these biological structures. In previous work, we introduced such a hierarchical fiber bundle model (HFBM) Reference Pugno, Bosia and Carpinteri16,Reference Bosia, Abdalrahman and Pugno17 coupled with self-healing Reference Bosia, Abdalrahman and Pugno18 to study the effects of material regeneration on the strength and toughness of hierarchical composite materials.
As mentioned above, damage to tendons and ligaments can be caused by macrotraumas but more often by repeated exposure to lower magnitude stresses, i.e., fatigue. In the case of humans, healthy individuals are estimated to walk approximately 1–1.5 million strides per year, and in sporting activities so-called “tendon overuse injuries” are estimated to be about 30–50% of all sports-related injuries. Reference Schechtman and Bader19 Clearly, however, tendon inflammation, degeneration, and ultimately fatigue life depend on the stress level to which they are subjected. For example, cyclic loading at a 40% level of the ultimate tensile strength (UTS) would typically lead to failure after approximately 8500 cycles, whilst at 20% of the UTS, the fatigue life would be of the order of 300,000 cycles (i.e., about four months of normal walking activity). Reference Schechtman and Bader19,Reference Schechtman and Bader20 This type of prediction, however, is based on the results from in vitro mechanical tests on tendons, Reference Wren, Yerby, Beaupré and Carter21 whilst self-healing and remodeling effects are present in vivo and cannot be neglected in order not to underestimate fatigue life. Thus, a numerical model which is able to estimate the fatigue life of tendons starting from known mechanical properties and including self-healing effects would be of considerable interest to help, e.g., in the diagnosis and prediction of overuse injuries. In this paper, we extend the above-mentioned HFBM to simulate cyclic loading and thus fatigue, and study the influence of self-healing on biological materials such as tendons and ligaments.
The paper is structured as follows: In Sec. II, the theoretical influence of self-healing on fracture stress and fatigue life is discussed; In Sec. III, the numerical approach is presented; In Sec. IV, calculation and simulation results are compared and discussed. Conclusions conclude the paper.
II. FRACTURE STRESS AND FATIGUE LIFE LAWS IN THE PRESENCE OF SELF-HEALING
We wish to analytically estimate the scaling of fracture stress and fatigue life in self-healing materials as a function of their healing rate η. Self-healing is a function of time, but also of damage level, since it is triggered by damage, increases with damage, and stops if no further damage occurs, albeit with some time delay. Here, we consider loading to be slow enough for the system to be described in the quasistatic regime, so that dependence with respect to time can be neglected, and only dependence with respect to the damage level is significant. Thus, the healing rate η, which is a function of time and damage level, can be defined as the ratio between the “healed” volume portion of the material and the “damaged” volume portion in a given fixed time interval. As a first approximation, we will consider η constant.
We first consider the relation for the scaling of the fracture stress σF in an infinite linear elastic plate with a central crack of length 2a and subjected to uniaxial tension perpendicularly to the crack (Griffith's case), which according to Linear Elastic Fracture Mechanics (LEFM)
Reference Anderson22
is
 $\sigma _{\rm{F}} = {{K_{{\rm{IC}}} } \mathord{\left/ {\vphantom {{K_{{\rm{IC}}} } {\sqrt {\pi a} }}} \right. \kern-\nulldelimiterspace} {\sqrt {\pi a} }}$
, where K
IC is the critical stress intensity factor, or fracture toughness, for mode I crack propagation. If we now consider that the effect of self-healing is to limit crack growth, we can assume, as a first approximation, that the crack length term a is modified to a(1 − η) in the presence of self-healing, so that the fracture stress
 $\sigma _{\rm{F}}^{{\rm{(SH)}}}$
becomes:
 $$\sigma _{\rm{F}}^{{\rm{(SH)}}} = {{{K_{{\rm{IC}}}}} \over {\sqrt {\pi a\left( {1 - \eta } \right)} }}\quad {\rm{.}}$$
This equation can be generalized in the case of nonlinear elastic materials, such as biological tissues like tendons or ligaments, for which the stress/strain constitutive equation can be expressed as σ ∝ εκ, with κ constant (κ > 1 implies hyperelasticity while κ < 1 implies elastoplasticity). Reference Pugno, Carpinteri, Ippolito, Mattoni and Colombo23 Writing the equation in the form of the ratio between fracture stresses with and without self-healing, we get:
 $${{\sigma _{\rm{F}}^{{\rm{(SH)}}}} \over {{\sigma _{\rm{F}}}}} = {\left[ {{{{K_{{\rm{IC}}}}} \over {{\sigma _{\rm{F}}}\sqrt {\pi a\left( {1 - \eta } \right)} }}} \right]^{2\alpha }} = {{K_{{\rm{IC}}}^{{\rm{(SH)}}}} \over {{\sigma _{\rm{F}}}\sqrt {\pi a} }}\quad {\rm{,}}$$
where α = κ/(κ + 1) and the modified fracture toughness for self-healing materials
 $K_{{\rm{IC}}}^{\left( {{\rm{SH}}} \right)}$
is:
 $$K_{{\rm{IC}}}^{{\rm{(SH)}}} = {{\sigma _{\rm{F}}^{\left( {1 - 2\alpha } \right)}{{\left( {\pi a} \right)}^{\left( {{1 \over 2} - \alpha } \right)}}K_{{\rm{IC}}}^{2\alpha }} \over {{{\left( {1 - \eta } \right)}^\alpha }}}\quad {\rm{,}}$$
which means that both the fracture stress and fracture toughness of a self-healing material are expected to scale as:
 $$\sigma _{\rm{F}}^{({\rm{SH}})} \propto K_{{\rm{IC}}}^{({\rm{SH}})} \propto {\left( {1 - \eta } \right)^{ - \alpha }}\quad,$$
with respect to the healing rate η.
As far as the fatigue life is concerned, one of the most widely used analytical laws is Paris's law,
Reference Paris and Anderson24
which describes the growth of a fatigue crack of length a as a function of the number of cycles N between two stress levels σmin and σmax in the case of a Griffith crack as
 ${{{\mathop{\rm d}\nolimits} a} \mathord{\left/ {\vphantom {{{\mathop{\rm d}\nolimits} a} {{\mathop{\rm d}\nolimits} N}}} \right. \kern-\nulldelimiterspace} {{\mathop{\rm d}\nolimits} N}} \propto \left( {\Delta \sigma \sqrt {\pi a} } \right)^{\rm{m}}$
where Δσ = σmax − σmin. Integrating this equation, we find that the number of cycles to failure N
C, arising when the crack length has reached its critical final value a
C, scales as
 ${N_{\rm{C}}} \propto {a^{\left( {1 - {m \mathord{\left/ {\vphantom {m 2}} \right. \kern-\nulldelimiterspace} 2}} \right)}}$
for aC
>>a and plausible values of m>2.
Reference Pugno, Cornetti and Carpinteri25,Reference Pugno, Ciavarella, Cornetti and Carpinteri26
This scaling relation can once again be generalized for a self-healing material with the above hypothesis, so that:
 $$N_{\rm{C}}^{({\rm{SH}})} \propto {\left[ {a\left( {1 - \eta } \right)} \right]^{\left( {1 - {m \mathord{\left/ {\vphantom {m 2}} \right. \kern-\nulldelimiterspace} 2}} \right)}}\quad {\rm{,}}$$
which can again be generalized for nonlinear elastic materials, giving:
 $$N_{\rm{C}}^{({\rm{SH}})} \propto {\left\{ {{{\left[ {a\left( {1 - \eta } \right)} \right]}^{\left( {1 - {m \mathord{\left/ {\vphantom {m 2}} \right. \kern-\nulldelimiterspace} 2}} \right)}}} \right\}^{2\alpha }} \propto {\left( {1 - \eta } \right)^{\alpha \left( {2 - m} \right)}}\quad {\rm{,}}$$
III. NUMERICAL HIERARCHICAL FIBRE BUNDLE MODEL FOR SELF-HEALING AND FATIGUE
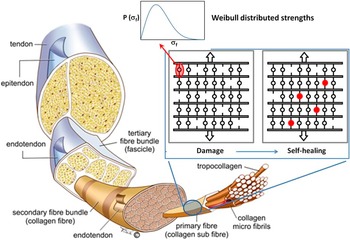
As mentioned in Sec. I, tendons and ligaments display a fibrous structure, and several hierarchical levels can be identified, Reference Lakes27,Reference Fratzl and Weinkamer28 as shown in Fig. 1: from tissue level (∼cm), to collagen fibers (∼mm in length, ∼μm in diameter), to collagen fibrils (∼μm in length, ∼100 nm in diameter), to collagen molecules (∼300 nm in length, ∼1 nm in diameter). Therefore, as in previous studies, we simulate their mechanical behavior using a HFBM, Reference Bosia, Abdalrahman and Pugno17,Reference Bosia, Abdalrahman and Pugno18 which extends the classical fiber-bundle model, Reference Pradhan, Hansen and Chakrabarti15 adding hierarchical and self-healing effects. The HFBM procedure consists in discretizing a specimen in arrays of fibers arranged in series and parallel and assigning them statistically distributed fracture strengths, e.g., using a Weibull distribution. Reference Weibull29 Uniaxial loading is applied to the specimen and when fibers fail due to their strength having been exceeded, the load is redistributed among parallel fibers, e.g., according to an equal load sharing scheme. Reference Pradhan, Hansen and Chakrabarti15 This allows the system to be analytically solvable at each iteration, i.e., the stresses acting on each fiber can be recalculated after each fracture event, as well as the mechanical properties of each section of the bundle, and the global stress strain behavior. The model is implemented in a MATLAB code, which generates statistically distributed random fiber strength values from the chosen Weibull distributions for each fiber type, calculates the global stress–strain data for the selected loading protocol, and repeats the simulation with different random values over a sufficient number of iterations to derive statistically reliable average values. For large systems, the code is run on a high-performance computing cluster at the Politecnico di Torino. 30
Hierarchical fibrous structure of tendon, from tissue level to collagen fiber bundles, down to collagen fibrils (printed with permission of Vicky Earle and Karim Khan, and not to be reproduced further), and a schematic of the corresponding HFBM modelization including self-healing.

Hierarchical architectures can be modeled by using the simulation output of one particular hierarchical level (e.g., overall strength and stiffness) as the input for the statistically assigned mechanical properties at the next hierarchical level. Reference Pugno, Bosia and Carpinteri16 Self-healing is included in this scheme by allowing fibers to be “regenerated” (healing event) as well as “eliminated” (fracture event) at a certain healing rate η, which is defined as:
 $$\eta = {{{N_{{\rm{sh}}}} - {N_{{\rm{s}}0}}} \over {{N_0} - {N_{{\rm{s}}0}}}}\quad {\rm{,}}$$
where N 0 is the initial number of fibers, and N s0 and N sh are the numbers of surviving fibers with or without self-healing, Reference Bosia, Abdalrahman and Pugno18 respectively. If N h and N f are the numbers of healed and fractured fibers, respectively, in a given time interval, we have N sh = N 0 − N f + N h and N s0 = N 0 − N f, so that:
 $$\eta = {{{N_{\rm{h}}}} \over {{N_{\rm{f}}}}}\quad {\rm{,}}$$
in accordance with the definition given in Sec. II. Finally, self-healing can take place at random locations in the specimen (distributed healing, in the case of microcracking) or at the location of the main advancing cracks (localized healing).
In the case of fatigue damage progression, modifications are necessary to the numerical model with respect to simulations involving simple monotonically increasing loads. This is due to the previously discussed Paris' law, which predicts a decrease of fatigue strength σC with increasing number of cycles:
 $$\sigma _{\rm{C}} \propto N_{\rm{C}}^{−1/m} \quad {\rm{,}}$$
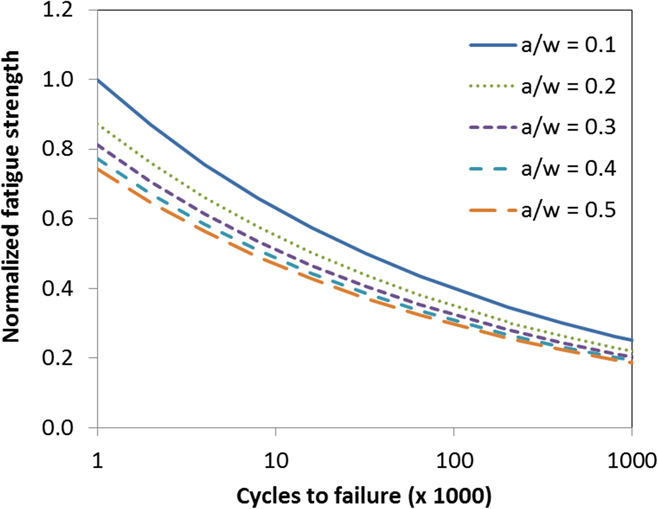
obtained by integrating Paris's law and taking σmin = 0, as in our case. The typical behavior is shown in Fig. 2 for m = 3 and various values of initial crack length a. Here, the fatigue strength is normalized with respect to nominal fracture strength.
Fatigue strength decrease with increasing number of cycles N C, for various initial crack lengths a with respect to the specimen width w (m = 3). Fatigue strength is normalized with respect to nominal fracture strength.
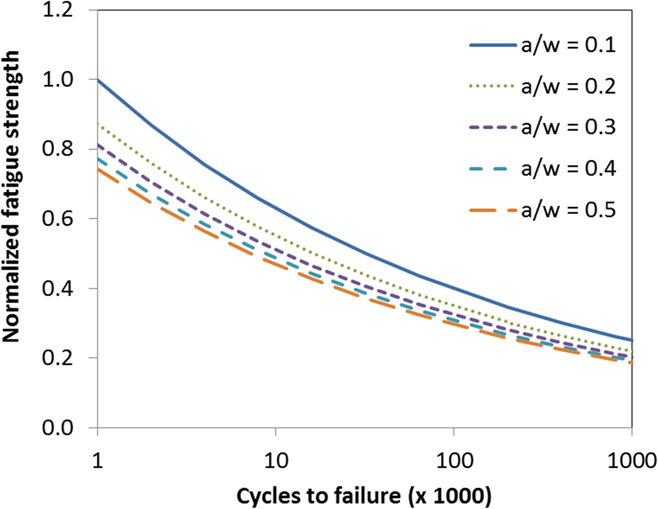
Therefore, the failure criterion for the individual fibers in the HFBM is modified to include a stress threshold, whose initial value is assigned according to a Weibull distribution, which decreases with the number of fatigue cycles, according to Eq. (9).
When simulating biological materials, where the healed tissue is the same as the original one, the mechanical characteristics of the “healing agent” are the same as those of the “host material”. This means that when healing occurs, fractured fibers in the bundle are replaced by fibers with statistically equivalent mechanical characteristics. To model tendons or ligaments, we use representative mechanical properties: Reference Schechtman and Bader19–Reference Wren, Yerby, Beaupré and Carter21 Young's modulus E = 650 MPa, failure stress σF = 80 MPa, and failure strain εF = 15%. Weibull distributions with shape parameter k = 2 are used to obtain statistical dispersion around these mean values.
IV. NUMERICAL RESULTS AND ANALYTICAL COMPARISON
A. Fracture
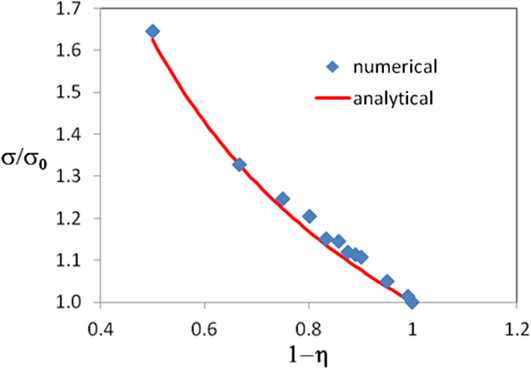
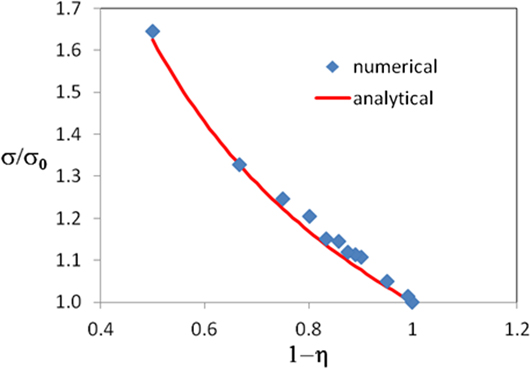
We first wish to evaluate the validity of Eqs. (1) and (2) regarding the scaling of the strength of a self-healing material with its healing rate. To do this, we consider a specimen with a centrally placed pre-existing crack of length 2a, loaded uniaxially in the direction of the fibers and perpendicular to the crack. To simulate such a pre-existing crack, an appropriate number of fibers in a central section of the fiber bundle are removed. The crack length a varies between 1/100th and 1/10th of the specimen width w, i.e., from 1 to 10% of the fibers are initially removed from the central section of the fiber bundle. Numerical simulations agree well with analytical values calculated with Eq. (2) in a wide range of parameters. As predicted by the theory, failure stress increases with respect to a and (1 − η) according to the power law in Eq. (2). The results shown in Fig. 3, where failure stress is normalized with respect to nominal strength σ0 without self-healing, refer to a/w = 1/50 and a best fit is obtained for α = 0.7, corresponding to κ = 2.33, which is close to the hypothesized value of α = 0.5 in the simulations. The discrepancy is due to the statistical nature of the simulations, in contrast with deterministic scaling laws. These simulations confirm the validity of this simple scaling and thus that, in the presence of self-healing, a Griffith's crack can be treated with an equivalent length of a(1 − η). The obtained values for α (and κ) can be considered material constants, and will be used in the following sections.
Comparison between numerical simulations and analytical values based on Eq. (2) (Griffith's law generalized to include self-healing) for the failure stress σ of a centrally cracked specimen as a function of its healing rate. Failure stress is normalized with respect to nominal strength σ0 without self-healing, and best fit is obtained for α = 0.7.
B. Fatigue
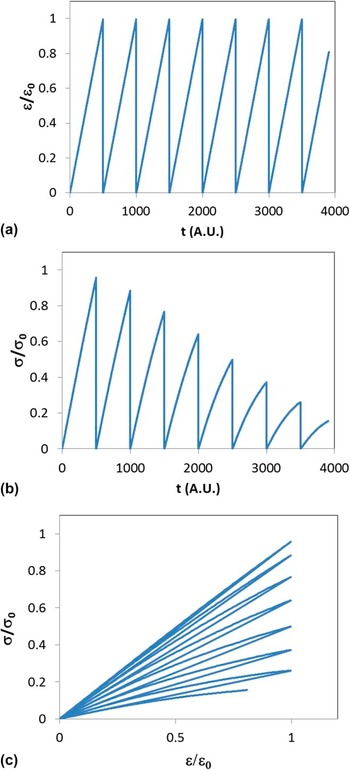
The same type of sample considered in simulations in Sec. IV. A is subsequently considered under cyclic fatigue loading. Various types of imposed displacement are adopted, including “saw tooth”-like functions, where the strain is increased linearly up to a maximum value, then decreased to zero, and then ramped-up again cyclically, or “rectified sine”-like functions, where the imposed strain varies with the absolute value of a sine function. An example of the obtained behavior, in the absence of self-healing, is shown in Fig. 4(a) for a saw tooth cyclic strain profile. Both stresses and strains are normalized with respect to their maximum amplitude ε0 and σ0 in the fatigue cycles. Here, the maximum imposed strain value is chosen near the failure strain of the material (80% of the value), so that considerable damage progression is achieved over a limited number of cycles. This is shown in Fig. 4(b), where the stress amplitude is seen to drop considerably over a few fatigue cycles, due to specimen damage, and in Fig. 4(c) where the specimen stress–strain curves display increasing material softening as damage progresses, up to final specimen failure.
Example of a simulation of fatigue cycling and corresponding stress–strain behavior: (a) Cyclic “saw tooth” imposed strain; (b) Corresponding stress evolution; and (c) Resulting stress–stain curves with increasing fatigue damage. Time scales are given in arbitrary units (A.U.) since no explicit time dependence is included in the model.

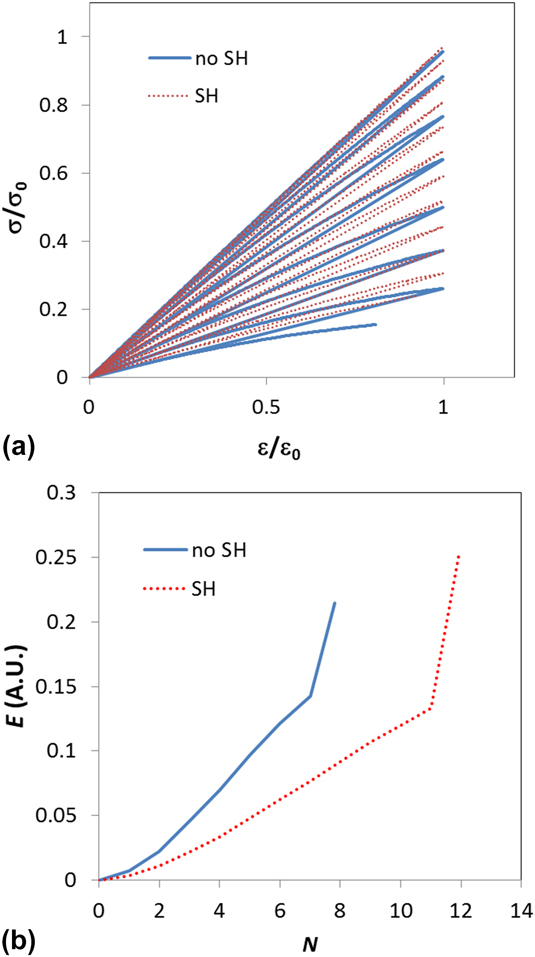
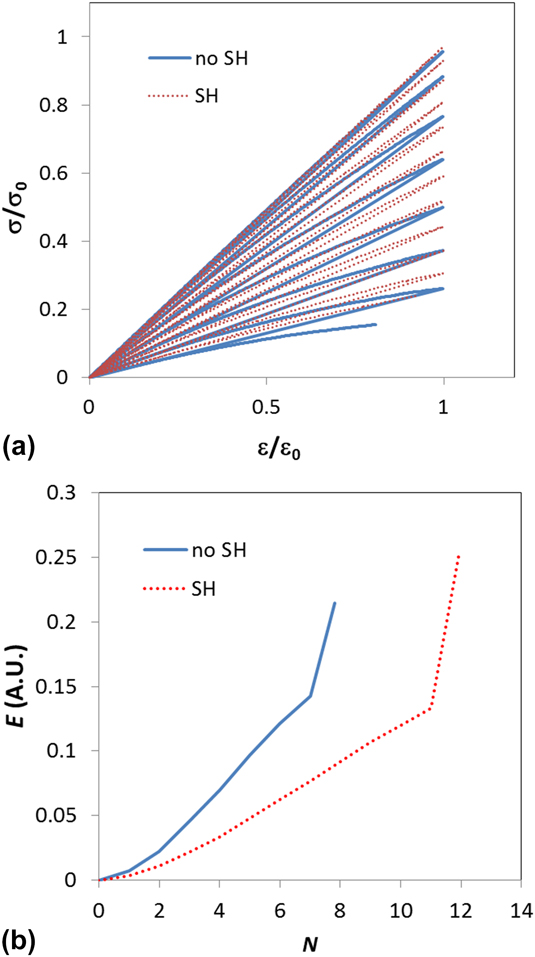
The effect of self-healing on the simulated behavior can be visualized in Fig. 5 for η = 0.1 in a distributed healing configuration: The stress softening effect due to progressive damage is reduced considerably [Fig. 5(a)], in particular, for early stages of damage, and the fatigue lifetime is increased by approximately 34%. At the same time, the dissipated energy during fatigue cycling, calculated as the area included between the ascending and descending stress–strain curves in a single cycle, is reduced considerably in the presence of self-healing [approximately 47% per cycle, Fig. 5(b)]. Clearly, this calculation does not account for the energy necessary to provide self-healing itself. At specimen failure, the self-healing specimen dissipates a greater amount of total energy, since it fails at a higher stress value with respect to the non-self-healing one.
Example of a simulation of fatigue cycling with (“SH”) or without (“no SH”) self-healing: (a) stress–strain curves. A healing rate of η = 0.1 is chosen in a distributed healing configuration. (b) Normalized dissipated energy.
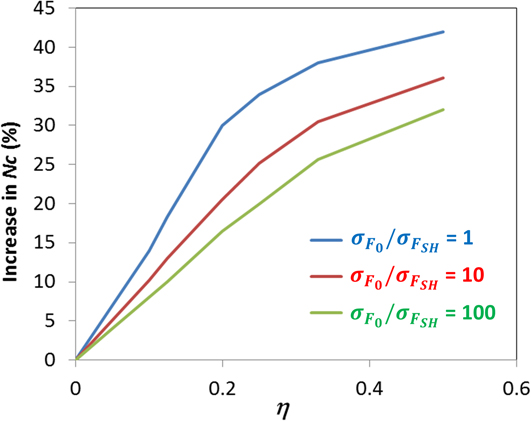
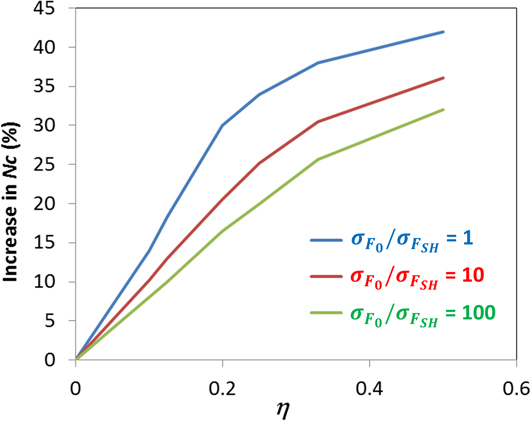
The effectiveness of self-healing is greatly dependent on the mechanical properties of the “healing agent”, i.e., in biological materials, the tissue that replaces the damaged material. This can be seen by varying the strength σFSH of the new fibers that replace damaged ones in simulations, with respect to that of the original ones σF0. Three ratios between the two strengths are considered in Fig. 6: σF0/σFSH = 100, 10, 1. Simulations show a nonlinear increase in the fatigue life N C of the considered specimen with increasing healing rate for all three cases, but a markedly more significant maximum increase (42%) in the case of σFSH = σF0, although a significant 31% maximum increase is obtained for a poor healing agent having only σF0/σFSH = 100. This suggests the robustness of the strategy emerged in nature during the Evolution process: even a small healing rate can result in a strong toughening of the material.
Evaluation of the increase in fatigue life (N C) as a function of healing rate η for varying “healing agent” mechanical strength σFSH with respect to the original material strength σF0. The small differences in fatigue life imposed by huge variations of healing agent strengths suggest the self-healing robustness of the strategy emerged in nature during evolution.
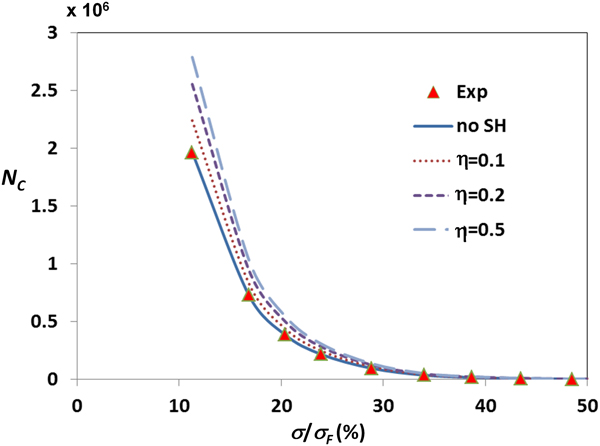
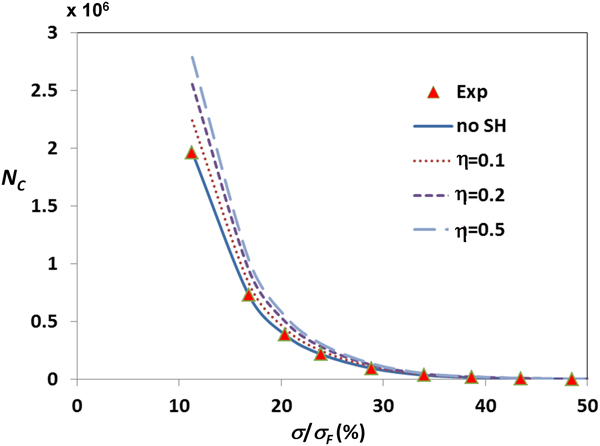
These calculations can be used to interpret data in the literature regarding in vitro tests on biological tissue, where mechanical properties are derived without the effect of self-healing. For example, Schechtman and Bader Reference Schechtman and Bader19 performed mechanical tests on human extensor digitorum longus (EDL) tendons, which are involved in joint movement at the foot and ankle. In particular, they derived the fatigue life for 90 specimens as a function of the maximum fatigue stress, expressed as a percentage of the experimentally measured tendon fracture stress. These data are reported in Fig. 7 (“no SH” fitted with our model for η = 0), together with the corresponding fatigue life extrapolations for different values of healing rate η, which in this case would also be dependent on fatigue cycle speed. For example, in the case of η = 0.2, when cycling at 20% of the failure stress, one would obtain an increase in N C of approximately 30%. In practical terms, for an athlete, this would mean that in the absence of tendon self-healing, and assuming an active sporting life of up to 40 years, tendon overuse problems or fracture would occur up to ten years earlier for equivalent loading.
Fatigue life (N C) as a function of maximal stress amplitude divided by strength for various η values. Experimental data (“Exp”) fitted by the η = 0 curve (“no SH”) are taken from Ref. Reference Schechtman and Bader19.
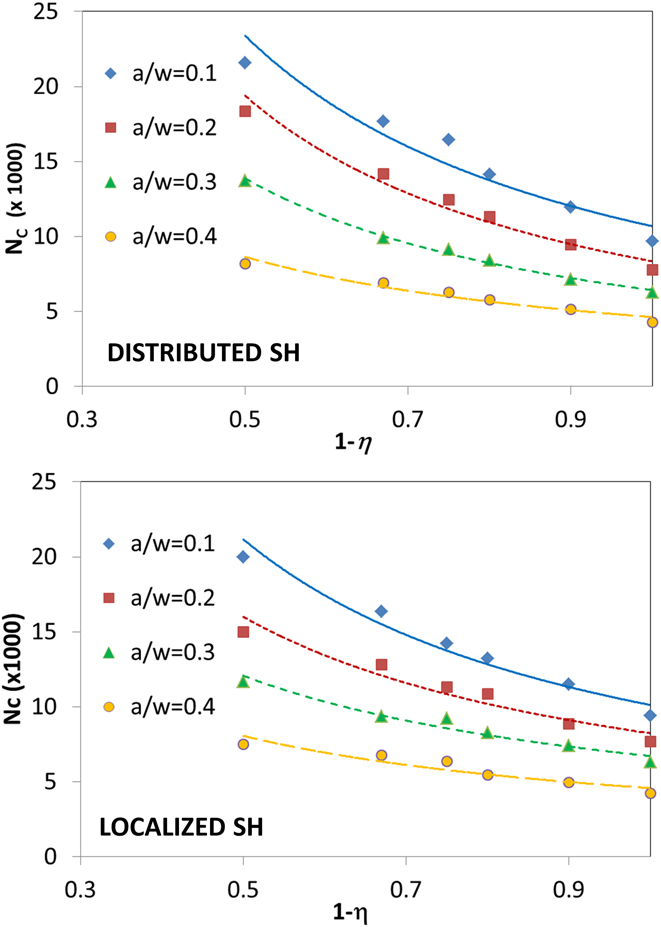
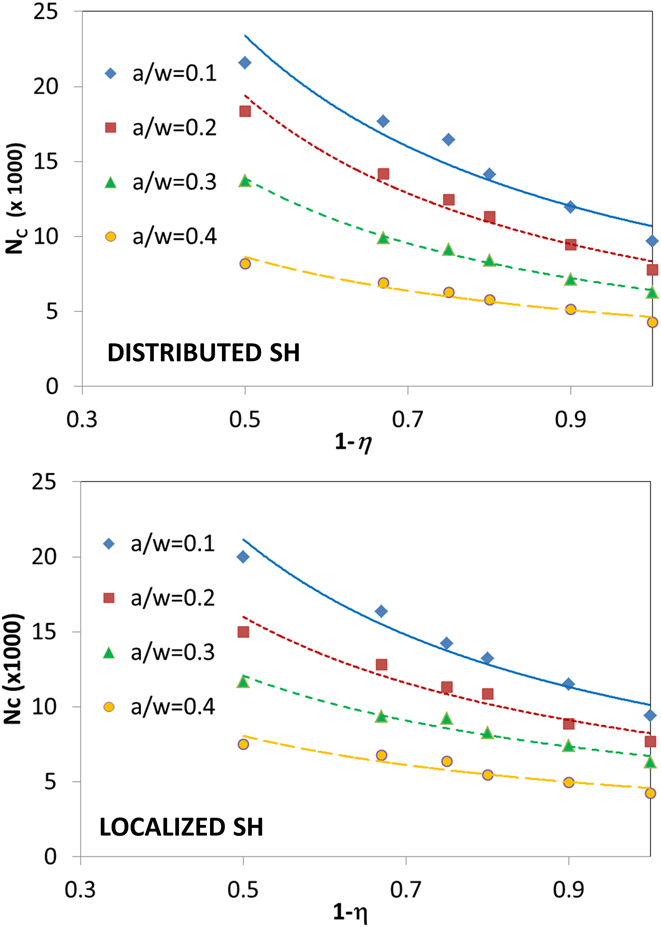
Simulations also allow us to verify the validity of the generalized Paris' law hypothesized in Sec. II. The results are shown in Fig. 8: the scaling of fatigue life N C of self-healing specimens with respect to (1 − η) is calculated numerically and analytically, using Eq. (6), for various initial crack lengths a, normalized with respect to the specimen width w. A saw tooth loading function is used and the fatigue stress level is chosen to be approximately 5% of the fracture strength of fibers, so as to obtain a significant number of cycles to failure (>10,000). Numerical results show a power-law decrease in the average fatigue life with (1 − η), consistent with the theory. These can be fitted with power-law functions, as shown in the figure. Contrary to uniaxial tension numerical simulations, where localized healing proved to be considerably more effective than distributed healing in increasing fracture strength, in the case of the present fatigue simulations, the difference between results for the fatigue life in the two cases is negligible, again suggesting the robustness of the self-healing.
Dependence of numerically calculated fatigue life as a function of (1 − η) for distributed (above) or localized (below) healing. Data are interpolated with the derived power law scaling.
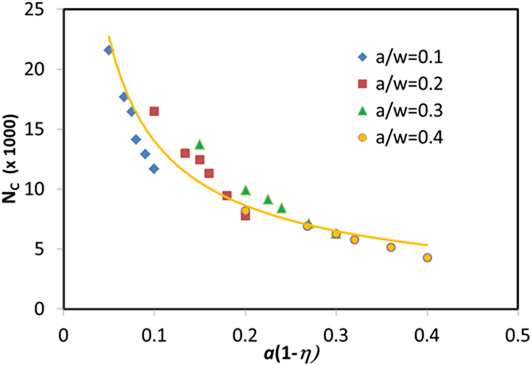
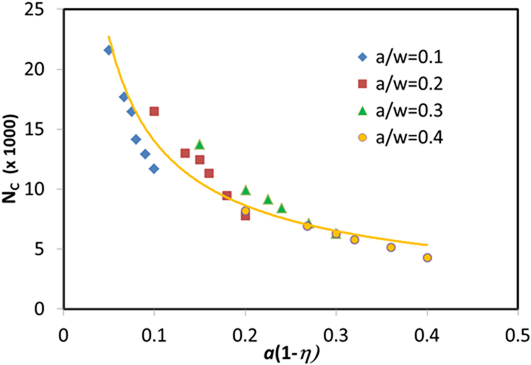
To fully verify Eq. (6), the N C results are plotted versus a(1 − η). Figure 9 shows data for distributed healing. The numerical data can be adequately fitted using a power-law y = a × x b , with a resulting exponent of b = −0.698. Comparing this to Eq. (6) and using the previously derived value of α = 0.7, we obtain a Paris exponent of m = 2.5, which is smaller than values found for other collagen-based materials such as bone (which can have lower values of m = 4), Reference Nalla, Kruzic, Kinney and Ritchie31 but is comparable to other biological materials. Reference Mach, Hale, Denny and Nelson32 More importantly, the output value of m = 2.5, although close to the input value of m = 3 used in Eq. (9), also confirms that our code is able to predict scaling of the Paris's exponent. More importantly, we also notice that this m value is consistent with that used in simulations to describe the fatigue stress decrease according to Eq. (9).
Numerical validation of the generalized Paris' law for self-healing materials: comparison between numerically and analytically calculated fatigue life as a function of a(1 − η).
V. CONCLUSIONS
We have developed and modified our previous code, the HFBM, to simulate fatigue damage evolution in self-healing soft nanomaterials. The model is essentially dependent on a single parameter, the material healing rate, which defines the degree of material reparation versus material damage. How the healing occurs, whether at the location of the main advancing crack, or at random damaged locations in the specimen, does not seem to appear to influence significantly the effectiveness of the reparation process. The results show that the fatigue life can be considerably improved with respect to non-self-healing specimens, with increases of up to 40% for healing rates close to 0.5. The mechanical properties of the healing agent are also shown to play a significant role: biological materials, even when the healing agent does not have the same high-level properties of the original material, have a potential advantage over non-self-healing materials suggesting that also artificial self-healing materials, where healing agents often have reduced mechanical properties, could represent interesting bioinspired solutions. Finally, numerical simulations are used to confirm simple scalings that have been introduced for the expressions of fracture or fatigue in the case of self-healing materials.
On the one hand, this study highlights the robustness of the self-healing strategy adopted in nature as a consequence of evolution. On the other hand, the present numerical approach and modified analytical expressions for Paris' law provide the possibility of improving fatigue life predictions in medicine, e.g., the fatigue life of in vivo tendons of sportsmen. Of course, further studies are needed to verify the applicability of Paris' law, which was first developed for materials such as metals, in the field of soft materials such as tendons. However, in support of this approach, a number of studies are present in the literature for collagen-based materials (see Ref. Reference Fratzl33 and references therein), particularly in the case of bone, showing that Paris' law is applicable. This, together with the particularly robust and wide-ranging applicability of Paris' law for many materials, leads to the assumption that it should be appropriate for tendons and ligaments.
In future, the influence of hierarchy on fatigue performance will be studied in depth, and this model will also be used to develop strategies for the simultaneous optimization of multiple material properties, such as strength, toughness, and fatigue life, with the objective of better understanding biological materials and thus helping in finding ultimate solutions in sport medicine, as well as in the design of novel bioinspired materials.
ACKNOWLEDGEMENTS
NMP acknowledges support from the European Research Council, ERC Ideas Starting Grant No. 279985 “BIHSNAM”, from ERC Proof of Concept Grant No. 619448 “REPLICA2” and No. 632277 “KNOTOUGH”, from the Graphene FET Flagship (“Graphene-Based Revolutions in ICT And Beyond”-Grant agreement No. 604391), and from the Autonomous Province of Trento (Graphene PAT WP10, code 81017). FB acknowledges support from BIHSNAM. The authors also acknowledge support for computational resources from Politecnico di Torino's DAUIN High Performance Computing Initiative (www.dauin-hpc.polito.it).