




No CrossRef data available.
BOOTSTRAP INFERENCE IN SEMIPARAMETRIC GENERALIZED ADDITIVE MODELS
Published online by Cambridge University Press: 10 February 2004
Abstract
Semiparametric generalized additive models are a powerful tool in quantitative econometrics. With response Y, covariates X,T, the considered model is E(Y |X;T) = G{XTβ + α + m1(T1) + ··· + md(Td)}. Here, G is a known link, α and β are unknown parameters, and m1,…,md are unknown (smooth) functions of possibly higher dimensional covariates T1,…,Td. Estimates of m1,…,md, α, and β are presented, and asymptotic distributions are given for both the nonparametric and the parametric part. The main focus of the paper is application of bootstrap methods. It is shown how bootstrap can be used for bias correction, hypothesis testing (e.g., component-wise analysis), and the construction of uniform confidence bands. Further, bootstrap tests for model specification and parametrization are given, in particular for testing additivity and link function specification. The practical performance of the methods is illustrated in a simulation study.This research was supported by the Deutsche Forschungsgemeinschaft, Sonderforschungsbereich 373 “Quantifikation und Simulation ökonomischer Prozesse,” Humboldt-Universität zu Berlin, DFG project MA 1026/6-2, the Spanish “Dirección General de Enseñanza Superior,” no. BEC2001-1270, and the grant “Nonparametric methods in finance and insurance” from the Danish Social Science Research Council. We thank Marlene Müller, Oliver Linton, and two anonymous referees for helpful discussion.
Information
- Type
- Research Article
- Information
- Copyright
- © 2004 Cambridge University Press
1. INTRODUCTION
Many problems in econometrics and other fields require estimating and analyzing the conditional mean m(X,T) of a random response Y given covariates X and T. A traditional estimation approach for m(x,t) assumes that m belongs to a known finite-dimensional parametric family, often motivated by economic theory, identifiability conditions or practical reasons. Parameters can be estimated with

rate of convergence. Clearly, the estimation results are misleading if m(x; t) is misspecified. Misspecifications may be avoided by non- or semiparametric approaches. However the nonparametric rate of convergence decreases rapidly as the dimension of the covariates increases (see, e.g., Stone, 1985), and high-dimensional nonparametric functions are difficult to interpret. A natural compromise between typical parametric and purely nonparametric models is a model of the form

called a generalized additive partial linear model. In this paper we study the case when the link function G is known or has to be tested and coefficients α and β and the nonparametric functions m1,…,md of possibly higher dimensional covariates T1,…,Td are unknown. It is well known that those models can be estimated at a rate typical for the lower dimensional explanatory variables Tj (Stone, 1985).
The special case of generalized partially linear models (with d = 1) is well studied (see, e.g., Ai, 1997; Mammen and van de Geer, 1997; Severini and Staniswalis, 1994). We will extend the latter approach, i.e., the iterative application of smoothed local and unsmoothed global likelihoods. The related model E [Y |X,T] = G{βTX + m(TTα)} is studied by Carroll, Fan, Gijbels, and Wand (1997). Their aim is dimension reduction of the variable T by projection, but the fitted nonparametric transformation m is quite difficult to interpret.
Additive and generalized additive models play an important role in economic theory (see, e.g., Leontief, 1947; Goldberger, 1964; Deaton and Muellbauer, 1980). Apart from their statistical advantages they allow for the analysis of subsets of regressors and permit decentralization in optimization and decision making. Projection smoothers using backfitting techniques are considered in Hastie and Tibshirani (1990), but asymptotic theory for this technique is rather complicated (see Mammen, Linton, and Nielsen, 1999; Opsomer and Ruppert, 1999). An alternative approach that allows a detailed asymptotic analysis uses approximations by linear spaces (e.g., of regression splines) with increasing dimension (see Hansen, Huang, Kooperberg, Stone, and Truong, 2002). Horowitz (2001) proposes estimates of additive components based on partial derivatives of the full-dimensional regression function. His approach also allows an unknown link function. Further, Tjøstheim and Auestadt (1994) and Linton and Nielsen (1995) introduce the marginal integration approach. Marginal integration is applied to generalized additive models by Linton and Härdle (1996). We will use the approach of Severini and Staniswalis (1994) and combine it with marginal integration. This is done for practical and theoretical reasons. In particular, this approach will allow for a detailed asymptotic distribution theory.
The main subject of this paper is the introduction of bootstrap procedures for (1). Nonparametric bootstrap tests for generalized partially linear models can be found in Härdle, Mammen, and Müller (1998). In our more complex case, the integration estimate of an additive component has bias terms that depend on the shape of the other additive components. This complicates the data analytic interpretation of nonparametric fits. We will show how bootstrap can be used to correct for these terms. Bootstrap tests will be considered also for variable selection, parametric specifications, and testing additivity. We will argue that bootstrap is a natural method for these problems. Alternative methods could be based on asymptotic expansions to get bias approximations or normal approximations, respectively, and to use plug-in estimates. In our setup these expansions are rather complex and may lead only to crude approximations. So we expect that the structure of the model will be better mimicked by the bootstrap.
The paper is organized as follows. In the next section we introduce estimates for the parameters and the nonparametric components of model (1). Section 3 presents several applications of bootstrap for analyzing the nonparametric components, starting with bias corrections for the nonparametric estimates. What follows are bootstrap tests for different null hypotheses about the components. In the last part procedures and theory for uniform confidence bands are given. In Section 4 the presented methodology is studied in simulations. Assumptions, asymptotic theory for the estimators, and proofs are postponed to the Appendix.
2. QUASI-LIKELIHOOD ESTIMATION IN GENERALIZED ADDITIVE MODELS
In this section we will discuss our approach for generalized additive models. Our estimation procedure starts with the iterative algorithm of Severini and Staniswalis (1994), and in a second step the additive components are fitted by marginal integration. For a better understanding we first discuss the special case of binary response models. For the general case of generalized additive models our approach will be introduced in Section 2.2. For a discussion of binary response models see also Horowitz (1998). A detailed introduction to quasi-likelihood can be found in McCullagh and Nelder (1989).
2.1. Additive Binary Response Models
In an additive binary response model independent and identically distributed (i.i.d.) tuples (Yi,Xi,Ti) are observed (i = 1,…,n), where Ti = (Ti,1,…,Ti,d) is a random variable with components Ti,j in

, Xi is in

, and Yi ∈ {0,1}. Conditionally given (Xi,Ti) the variable Yi is distributed as a Bernoulli variable with parameter G{XiT β + α + m1(Ti,1) + ··· + md(Ti,d)} where G is a known (link) function, β an unknown parameter in

, α an unknown scalar, and

unknown smooth functions. For identifiability we set E wj(Ti,1)mj(Ti,1) = 0 ∀j for some weight functions wj. Given (Xi,Ti), the likelihood of Yi is

where μi = G{XiTβ + α + m1(Ti,1) + ··· + md(Ti,d)}. The likelihood function is given by

where m+(t) is the additive function α + m1(t1) + ··· + md(td).
We now discuss how the additive nonparametric components can be estimated. Without loss of generality, we will do this for the first component m1. We write r = q1, s = q2 + ··· + qd and define the smoothed likelihood

where the vector Ti = (Ti,1,…,Ti,d) is a random variable with components Ti,j in

. For a vector u = (u1,…,ud) with components uj in

we denote (u2,…,ud)T by u−1; similarly, we write Ti,−1 = (Ti,2,…,Ti,d)T. For a kernel function L defined on

put Lg(v) = (g1·····gs)−1L(g1−1v1,…,gs−1vs) and for simplicity assume that L is a product kernel

. Similarly, define Kh(v) = h−1K(h−1v) for

and bandwidth vector

with product kernel

. The bandwidth vector g is related to smoothing in direction of the “nuisance” covariates. The relative speed of the elements of g to the elements of h and the choice of these bandwidths will be discussed subsequently.
Following Severini and Staniswalis (1994), we base our estimates on an iterative application of smoothed local and unsmoothed global likelihood functions. We define for β ∈ B


Equation (5) may be written as

. The result

is a multivariate kernel estimate of m+ that does not use the additive structure of m+. This

will be used in an additional step to obtain estimates

of the additive components α, m1,…,md. The final additive estimate of m+(t) will then be given by

.
For the estimation of the nonparametric component m1 the marginal integration method is applied. It is motivated by the fact that, up to a constant, m1(t1) is equal to

for a weight function w−1. Note that this method does not use iterations so that the explicit definition allows a detailed asymptotic analysis. A weight function w−1 is used for two reasons: it may be useful to avoid problems at the boundary, and it can be chosen to minimize the variance (compare Fan, Härdle, and Mammen, 1998). So we define

which estimates the function m1 up to a constant. An estimate of the function m1 is given by norming (with a weight function w1)

The additive constant α can be estimated by

Again, the weight functions w0 and w1 may be useful to avoid problems at the boundary. After having estimated the remaining nonparametric components analogously, the final estimate of m is

2.2. Semiparametric Generalized Additive Models
We now come to the discussion of estimation in semiparametric generalized additive models. Suppose that we observe an independent sample (Y1,X1,T1),…,(Yn,Xn,Tn) with E [Yi|Xi,Ti] = G{XiTβ + m(Ti)}. Additional assumptions on the conditional distribution of Yi will be given subsequently. For a positive function V the quasi-likelihood (QL) function is defined as

where μ is the (conditional) expectation of Y, i.e., μ = G{XTβ + m(T)}. The QL function has been introduced for the case that the conditional variance of Y is equal to σ2V(μ) where σ2 is an unknown scale parameter. The function Q can be motivated by the following two considerations: clearly, Q(μ; y) is equal to −½(μ − y)2v−1 where v−1 is a weighted average of 1/V(s) for s between μ and y. Consequently, maximum QL estimates can be interpreted as a modification of weighted least squares. Another motivation comes from the fact that for exponential families the maximum QL estimate coincides with the maximum likelihood estimate. Note that the maximum likelihood estimate

, based on an i.i.d. sample Y1,…,Yn from an exponential family with mean μ(θ) and variance V{μ(θ)}, is given by

We consider three models.
Model A. (Y1,X1,T1),…,(Yn,Xn,Tn) is an i.i.d. sample with E [Yi|Xi,Ti] = G{XiTβ + m(Ti)}.
Model B. Model A holds, and the conditional variance of Yi is equal to Var[Yi|Xi,Ti] = σ2V(μi) where μi = G{XiTβ + m(Ti)} and where σ2 is an unknown scale parameter.
Model C. Model A holds, and the conditional distribution of Yi belongs to an exponential family with mean μi and variance V(μi) with μi as in Model B.
The QL function is well motivated for Models B and C. The more general Model A is included for discussion of robustness issues, i.e., to discuss the case of a wrongly specified conditional variance in Models B and C. If not stated otherwise, all the following remarks and results treat the most general Model A. The QL function and the smoothed QL function are now defined as in (3) and (4) with (2) replaced by (12). The estimates

are defined as in (5)–(10). Asymptotics for

are presented in Section A.2 of the Appendix. In particular, Lemma A2.1 shows that

converges to a centered Gaussian variable where the bias δn1(t1) is of the form Ah+2 + Bg+2 + oP(h+2 + g+2), where h+ = max1≤j≤r hj and g+ = max1≤j≤s gj. For a definition of the terms Ah+2 and Bg+2 see Lemma A2.1. This lemma does not require that g+ is of smaller order than h+, an assumption that has been made in previous papers. Clearly, then the bias term Bg+2 would be asymptotically negligible, and therefore asymptotics suggests the choice g+ = o(h+). However, stochastic and numerical stability of the preestimator

demand that h1 ×···× hr·g1 ×···× gs is large. Otherwise too few observations would lie in the local support of the multidimensional kernel. Often, in practice even larger values for gj than for hl are needed for a satisfactory performance of

. The constant A in the bias depends on the value of m1′ and m1′′ at t1, whereas the constant B depends on averages of powers of mj′(tj) and mj′′(tj) over tj and over j ≠ 1. Typically the averaging leads to small values of B. For more discussion, especially on optimal rates and efficiency, we refer to Härdle, Huet, Mammen, and Sperlich (1998).
The remaining additive components mj for j = 2,…,d are estimated in analogy to m1. It can be checked that the estimates

are asymptotically independent. The variance of the estimate

can be consistently estimated (see Section A.2 of the Appendix). Consistency and asymptotic normality of β are shown in Lemma A2.2. It turns out that for asymptotic unbiasedness with rate

no undersmoothing is required in the nonparametric estimation. Further, an explicit expression for the asymptotic variance is given that, however, depends on unknown terms as, e.g., on the function m(·).
3. BOOTSTRAP APPLICATIONS IN GENERALIZED ADDITIVE MODELS
Three versions of bootstrap will be considered here. The first version is wild bootstrap, which is related to proposals of Wu (1986), Beran (1986), and Mammen (1992) and was first proposed by Härdle and Mammen (1993) in nonparametric settings. Note that in Model A the conditional distribution of Y is not specified besides the conditional mean. The wild bootstrap procedure works as follows.

For Model B we propose a resampling scheme that takes care of the specification of the conditional variance of Y. For this reason, we modify Step 3 by putting

. Here

is a consistent estimate of σ2. In this case the condition that |εi*| is bounded can be weakened to the assumption that εi* has subexponential tails; i.e., for a constant C it holds that E(exp{[|εi*|/C]}) ≤ C for i = 1,…,n (compare Assumption (A2) in the Appendix).
In the special situation of Model C (semiparametric generalized linear model), Q(y;μ) is the log-likelihood. Then the conditional distribution of Yi is specified by μi = G{XiTβ + m+(T)}. In this model we generate n independent Y1*,…,Yn* with distributions defined by

, respectively. In the binary response example that we considered in Section 2, Yi is a Bernoulli variable with parameter μi = G[XiTβ + m+(T)] . Hence, here we resample from a Bernoulli distribution with parameter

.
3.1. Bias Correction
Lemma A2.1 in the Appendix shows that if the elements of the bandwidth vectors h and g are of the same order, the bias of

depends on the shape of the other additive components m2,…,md. This may lead to wrong interpretations of the estimate

. Bootstrap bias estimates will help to judge such effects.
In all three resampling schemes, one uses the data (X1,T1,Y1*),…, (Xn,Tn,Yn*) to calculate the estimate

. This is done with the same bandwidth h for the component t1 and with the same g for the other d − 1 components. The bootstrap estimate of the mean of

is given by

, where E* denotes the conditional expectation given the sample (X1,T1,Y1),…,(Xn,Tn,Yn). The bias corrected estimate of m1(t1) is defined by

The theorem shows that the bias terms of order g+2 are removed by this construction.
THEOREM 3.1. Assume that Model A, Model B, or Model C holds and that the corresponding version of bootstrap is used. Suppose further that Assumptions (A1)–(A11) in the Appendix apply and that assumptions analogous to (A3) and (A4) hold for the estimation of the other additive components mj for j = 2,…,d (h being always the bandwidth used for the estimated component mj and g the bandwidth for the nuisance components). Furthermore, suppose that the elements of h and g tend to zero and that nh1·····hr g12·····gs2(log n)−2 tends to infinity. Then it holds that

where again h+ = max1≤j≤r hj and g+ = max1≤j≤s gj.
Bootstrap applications in nonparametric regression often use resampling from a modified estimate of the regression function. Suppose, e.g., that in the third step of the bootstrap algorithm

is replaced by

, where

is defined as

but with bandwidth vector hO instead of h. Then if hjO/h+ → ∞ (1 ≤ j ≤ r) one can show that the left-hand side of (13) is of order Op{(h+O)4 + g+4 + (nh1O···hrO)−1/2}, where h+O is the maximal element of hO. For appropriate choices of hO, e.g., for hO with (h+O)4 and (nh1O···hrO)−1/2 of the same asymptotic order, this is of smaller order than the right-hand side of (13) with resampling from

.
3.2. Componentwise Hypothesis Testing
Interesting shape characteristics may be visible in plots of estimates of the additive components. The complicated nature of the model, though, makes it difficult to judge the statistical significance of such findings. Hypothesis tests in addition to uniform confidence bands are useful tools to analyze and interpret fitted components. We now discuss tests of the hypothesis that one component is linear:

Extensions to variable selection problems (H0 : m1 ≡ 0) or tests of polynomial forms are straightforward; see also the discussion that follows.
Our test is a modification of a general approach by Hastie and Tibshirani (1990). In semiparametric setups they propose to apply likelihood ratio tests and to use χ2 approximations for the calculation of critical values. Approximate degrees of freedom are heuristically derived by calculating the expectation of asymptotic expansions of the test statistic under the null hypothesis. Here we propose more accurate distributional approximations. Furthermore, in the definition of the test statistic we correct for the bias of the nonparametric estimate. Our test statistic is asymptotically normal, but the convergence to the normal limit is very slow as mathematical arguments and simulations indicate. Therefore we propose the bootstrap for the calculation of critical values. Bias correction will be used in the test because otherwise it will have a nonnegligible effect on the power. For this reason,

is compared with a bootstrap estimate of its expectation under the hypothesis.
First, we calculate semiparametric estimates for the hypothetic model

Note that the α occurring in the preceding equation can be different from the α defined in Section 2.1 because Xi is replaced by (Xi,Ti,1). Estimation of the parametric components β, α, and γ1 and of nonparametric components m2,…,md can be done as in Section 2.1. This defines estimates

. Set

Second, for the bootstrap we proceed as follows: generate independent samples (Y1*,…,Yn*) (compare Section 3) but now with μi replaced by

. Then, using the data (X1,T1,Y1*),…,(Xn,Tn,Yn*) calculate the estimate

. The bootstrap estimate of the mean of

is given by

, where E* denotes the conditional expectation given the sample (X1,T1,Y1),…,(Xn,Tn,Yn). Third, we define the test statistic

with

. The weights [G′{…}]2/V(G{…}) in the summation of the test statistic are motivated by likelihood considerations (see Härdle et al., 1998) but could be replaced by some other weights. The test statistic R has an asymptotic normal distribution (see Lemma A3.1 in the Appendix). Mean and variance can be consistently estimated, and thus critical values for the test could be calculated using the normal approximation. But as mentioned before this approximation does not perform well. Again we recommend using bootstrap approximations. The bootstrap estimate of the distribution of R is given by the conditional distribution of the test statistic R*, defined by

The conditional distribution

(given the original data (X1,T1,Y1),…,(Xn,Tn,Yn)) is our bootstrap estimate of

(on the hypotheses (14)). Here,

denotes the distribution of R. The following theorem states consistency of the bootstrap.
THEOREM 3.2. Assume that Model A, Model B, or Model C holds and that the corresponding version of bootstrap is used. Furthermore suppose that assumptions (A1)–(A11) in the Appendix hold with Xi replaced by (Xi,Ti,1). Then, if additionally, n1/2h1·····hr g12·····gs2(log n)−1 → ∞ and if all elements of h and g are of order o(n−1/8), on the hypotheses (14), it holds that

where dK denotes the Kolmogorov distance, which is defined for two probability measures μ and ν (on the real line) as

.
With similar arguments as in Härdle and Mammen (1993) one shows that the test R has nontrivial asymptotic power for deviations from the linear hypothesis of order n−1/2(h1·····hr)−1/4. This means that the test does not reject alternatives that have a distance of order n−1/2. However, the test also detects local deviations (of order n−1/2(h1·····hr)−1/4) that are concentrated on shrinking intervals with length of order h. The test may be compared with overall tests that achieve nontrivial power for deviations of order n−1/2. Typically, such tests have poorer power performance for deviations that are concentrated on shrinking intervals. For our test, the choice of the bandwidth determines how sensitively the test reacts on local deviations; i.e., for smaller h the test detects deviations that are more locally concentrated but at the cost of a poorer power performance for more global deviations. In particular, as an extreme case one can consider the case of a constant bandwidth h. This case is not covered by our theory. It can be shown that in that case R is an n−1/2-consistent overall test.
Finally we want to emphasize that the same procedure works for any other linearly parameterized hypothesis

where θ1,…,θq are unknown parameters but f1,…,fq are given. Moreover, the results of this section can be extended to tests of other parametric hypotheses on m1:

where {mθ : θ ∈ Θ} is a parametric family. This can be done similarly as in Härdle and Mammen (1993). However, this requires an asymptotic study of parametric estimates in the model (1) with parametric specification (17) for m1.
Using an approach similar to the approach described earlier, one can construct F-type tests on the coefficients β. For testing H0 : Hβ = c versus H1 : Hβ ≠ c (with a k × p matrix H of rank k ≤ p and a constant

for a k ≥ 1) a natural test statistic is defined as

, where

is a consistent estimate of the matrix I, defined in Lemma A2.2. A natural estimate of I would be the bootstrap estimate. According to Lemma A2.2, on the hypothesis Rβ has a central χ2 distribution. This asymptotic result could be used for the approximate calculation of critical values. As before we recommend applying bootstrap. Then Rβ will be compared with its bootstrap analog

. For simplicity, the same (bootstrap) covariance estimate has been used in the calculation of Rβ and Rβ*.
3.3. Testing Separability and Interactions
First note that our estimate of m1 is robust against nonadditivity of the other components. In fact, in the construction of the estimate it is only used that m(x; t) is of the form

for an arbitrary function m2,…,d. It is not assumed that the function m2,…,d is additive, i.e., m2,…,d(T2,…,Td) = m2(T2) + ··· + md(Td). Also in the case that m(x; t) is not of the form (18), the estimate

makes sense because then it estimates the average (or marginal) effect of T1. Nevertheless the hypothesis of additivity is of interest in its own right and an important step in a model choice procedure. Following the idea of Sperlich, Tjøstheim, and Yang (2002), we consider a split of the first covariate T1 into two components T1:1 and T1:2 and consider the hypothesis

For other approaches to test additivity, see also Gozalo and Linton (2001). Estimates of m1:1 and m1:2 are constructed by marginal integration:

so that

is an estimate for the first-order interaction of T1:1 and T1:2.
For testing hypothesis (19) we proceed similarly as in Section 3.2. We define

where m1:1,2* is an estimate based on a bootstrap sample. Bootstrap samples are generated as in Section 3.2 but now with

replaced by

The test statistic Rinter has an asymptotic normal distribution (see Lemma A3.2 in the Appendix). The bootstrap estimate of the distribution of Rinter is given by the conditional distribution of the test statistic Rinter*, with

where

is defined as

but now from a bootstrap sample instead of the original sample.
THEOREM 3.3. Under the assumptions of Theorem 3.2, on the hypotheses (19), it holds that

3.4. Testing the Link Function
Härdle, Mammen, and Proenca (2001) introduce a bootstrap test for the null hypothesis of a parametric generalized linear versus a single index model. We extend here their approach to test


with v(T,X,β) = βTX + α + m1(T1) + ··· + md(Td). We recommend a test statistic of the form

where hL is an additional bandwidth and where

. For further details see also Section 4.
3.5. Uniform Bootstrap Confidence Bands
To construct uniform confidence bands we first define

where

is the estimate of the variance of

, defined in equation (A.2) in the Appendix. In the simulation study in Section 4 we also use a bootstrap estimate of σ1(t1). The distribution of S can be estimated by bootstrap as introduced in the beginning of Section 3. This defines the statistic

. In the definition of S* the norming

could be replaced by

. We write

. Here

is an estimate of the variance of

, that is defined similarly as

but that is calculated with a bootstrap resample instead of with the original sample. The first norming helps to save computation time; for the second choice bootstrap theory from other setups suggests higher order accuracy of bootstrap. Nevertheless, both bootstrap procedures can be used to construct valid uniform confidence bands:
THEOREM 3.4. Assume that Model A, Model B, or Model C holds and that the corresponding version of bootstrap is used. Furthermore suppose that assumptions (A1)–(A11) apply, that all elements of h and g are of order o(n−1/8), and that nh1·····hr g12·····gs2(log n)−2 → ∞. Then it holds that

This gives uniform confidence intervals for m1(t1) − δn1(t1). For confidence bands of m1 one needs a consistent estimate of δn1(t1). This could be done by plug-in or by bootstrap. Both approaches require oversmoothing, i.e., choice of a bandwidth vector hO with hjO/h+ → ∞; see also the discussion after Theorem 3.1. For related discussions in nonparametric estimation see Eubank and Speckman (1993) and Neumann and Polzehl (1998).
4. A SIMULATION STUDY
We now illustrate the performance of our methods in small samples. Simulation results are given for different tests and for confidence bands. Level accuracy is checked for testing linearity of an additive component and for testing the specification of the link function. For the first test problem power functions also are calculated. Furthermore, coverage probabilities of our bootstrap confidence bands are checked.
Binary response data are generated from

where G is the logit distribution function and

. The explanatory variables X1, X2, T1, and T2 are independent, X1 and X2 are standard normal, and T1 and T2 have a uniform distribution on [−2,2] . We generate n = 250 data points with β = (0.3,−0.7)T, m1(t1) = 2 sin(−2t1), m2(t2) = t22 − E [T22] , and α = 0. For all computations the quartic kernel is used. In this section h1 denotes the bandwidth that is used for the estimation of β. In the simulations we set all weight functions w−1, w0, and w1 equal to 1; i.e., we applied no trimming and no optimal weighting.
First, we consider the test problem (14) H0 : m1(t1) is linear. It can be seen from Figure 1 that the normal approximation of Lemma A3.1 is quite inaccurate. In this plot a density estimate for the test statistic R, based on 500 Monte Carlo replications, is plotted together with its limiting normal density. The parameters are chosen on the null hypothesis, with m1(t1) = t1 and β, m2, and α as before. The density estimate for R is a kernel estimate with bandwidth according to Silverman's rule of thumb, i.e., 1.06·2.62·n−1/5 times the empirical standard deviation. For better comparison, the normal density is convoluted with the quartic kernel using the same bandwidth.

Standardized density estimate of the test statistic (thin line) and convoluted standard normal density (thick line).
In a simulation (500 runs) the level of the bootstrap test is estimated for B = 249 bootstrap repetitions. We get a relative number of rejections of 0.03 for theoretical level 0.05 and 0.06 for theoretical level 0.1; i.e., the bootstrap test keeps its level but is conservative for such a small sample. The power is investigated for the alternatives m1(t1) = (1 − v)t1 + v{2 sin(−2t1)}, 0 ≤ v ≤ 1. The other parameters are chosen as before. For comparison, we perform the same simulations for a parametric likelihood ratio test testing the hypothesis γ1 = γ2 = 0 in the parametric model

Clearly, this comparison is far away from being fair because for the parametric test the alternative and also m2 are assumed to be known. Figure 2 plots the power of these tests at theoretical levels 0.05 and 0.1. Note that the better performance of the parametric test is partly due just to the fact that the test R is conservative (see the preceding discussion). (One could compare the power of R in the right plot with the power of the likelihood ratio test in the left plot.) We conclude that the bootstrap test performs quite well.

Power functions for theoretical levels 0.05 (left) and 0.1 (right), for the nonparametric bootstrap test (thick line) and the likelihood ratio test (thin line).
Second, for bootstrap confidence bands we investigate the following questions: What is the coverage accuracy in a small sample? How much does the width of the band vary with the chosen coverage probability? Does it really matter how we estimate σ12(t1)? In the simulations we use two estimates of σ12(t1):

as defined in equation (A.2) (see Section 3.5) and the empirical variance of m1*(t1) in the bootstrap resamples, denoted by

. The simulated model is again (24) with n, m1, m2, X1, and X2 as before. But the variables T are now uniformly distributed on [−1,1] . The confidence bands are only investigated for m1. For h1 = h = g = 0.3 to 0.6 we obtain reasonable coverage accuracies; results for h1 = h = g = 0.5 are given in Table 1. The empirical coverage probabilities are close to the theoretical ones for all levels and for both variance estimates. It is surprising how well the bootstrap fits the different coverage probabilities in such small samples. For smaller and larger bandwidths they are less accurate. This is caused by poorer bootstrap bias correction. In contrast, the variance of the estimates is always well caught by the bootstrap. In Figures 3 and 4 we compare 95% and 85% confidence bands. Despite their different levels the bands hardly differ.
Coverage probabilities for bootstrap confidence bands with h1 = h = g = 0.5.


95% and 85% confidence bands, using . Dashed lines are the confidence bands and corresponding estimates; solid lines are the data-generating functions.

95% and 85% confidence bands, using . Dashed lines are the confidence bands and corresponding estimates; solid lines are the data-generating functions.
In our last simulation, we verify the performance of the test for the link function (see Section 3.4). The data are generated as in the simulations on confidence bands. Bandwidth hL (see (23)) is set to

, where

is an estimate of the standard deviation sI of the index; otherwise we set h1 = h = g = 0.35. The simulation results for level accuracy for the theoretical 1, 5, 10, and 15% levels are 0.014, 0.046, 0.090, and 0.13. Thus the accuracy is quite good. We also tried different bandwidths but found no major differences in the results.
APPENDIX
A.1. Assumptions. We now state the assumptions that are used in the results in Sections 2.1 and 2.2 and Section A.3 of this Appendix. We use the notation

Furthermore, we put λi(u) = Q{G(u);Yi}, λ(u) = Q{G(u);Y}. With this notation we have

For our asymptotic expansions we use the following assumptions.
(A1) (X1,T1,Y1),…,(Xn,Tn,Yn) are i.i.d. tuples. The expression Ti = (Ti,1,…,Ti,d) is a vector with components

valued, and

valued. We write r = q1 and s = q2 + ··· + qd.
(A2) E(Y |X,T) = G{XTβ + m+(T)} with

. Here m+ denotes the function m+(t) = α + m1(t1) + ··· + md(td), with E mj(Ti,j) = 0 for j = 1,…,d. The conditional variance Var(Yi|Ti = t) has a bounded second derivative. Furthermore the Laplace transform E exp t|Yi| is finite for t > 0 small enough.
(A3) Xi and Ti have compact support SX,ST. The support ST is of the form ST,1 × ST,−1 with

. Here T has a twice continuously differentiable density fT with inft∈ST fT(t) > 0.
(A4) For compact sets

we define

where, as before,

The term

is defined as

For β ∈ B we put

We assume that mβ(t) lies in the interior of H for all t ∈ ST and β ∈ B. This implies E {λ′(βTX + mβ(t))|T = t} = 0. We assume also that E [λ′′{βTX + mβ(T)}|T = t] ≠ 0 for all t ∈ ST and β ∈ B and that for all ε > 0 there exists a δ > 0 such that for all η ∈ H,t ∈ ST,β ∈ B

implies that

(A5) There exists a δ > 0 such that G(k)(u), k = 1,…,3, and G′(u)−1 are bounded on

. Furthermore V−1, V′, and V′′ are bounded on G(Sδ).
(A6) m1,…,md are twice continuously differentiable functions from

. The weight functions w, w−1, and w1 are positive and twice continuously differentiable. To avoid problems on the boundary, we assume that for a δ > 0 we have that w−1(t) = 0, w1(t) = 0, and w(t) = 0 for t ∈ ST,−1− = {s : there exists a u ∉ ST,−1 with ∥s − u∥ ≤ δ}, t ∈ ST,1− = {s : there exists a u ∉ ST,1 with ∥s − u∥ ≤ δ}, and t ∈ ST− = {s : there exists a u ∉ ST with ∥s − u∥ ≤ δ}, respectively. Furthermore, the weight function w1 is such that ∫ST,1 w1(t1)m1(t1) fT1(t1) dt1 = 0, where fT1 denotes the density of T1.
(A7) The kernels K and L are product kernels K(v) = K1(v1)·····Kr(vr) and L(v) = L1(v1)·····Ls(vs). The kernels Ki and Lj are symmetric probability densities with compact support ([−1,1], say).
(A8) E [λ1′′{X1Tβ0 + m+(T1)}|T1 = t] and E [λ1′′{X1Tβ0 + m+(T1)}X1|T1 = t] are twice continuously differentiable functions for t ∈ ST.
(A9) The matrix

is strictly positive definite. The random vectors

are defined in Lemmas A2.1 and A2.2 in Section A.2 of this Appendix, respectively.
This assumption implies that X does not contain an intercept. Note that if the first element of X were constant, a.s., e.g.,

.
(A10) m1,…,md are four times continuously differentiable on

.
(A11) The kernels Ki and Lj are twice continuously differentiable.
Assumptions (A1)–(A3) and (A5) and (A6) contain boundedness conditions on covariates and standard smoothness conditions on regression functions, design densities, link function, and variance function. Condition (A4) contains a slightly modified definition of our estimates. We now assume that in the definition of the parametric and nonparametric estimates the minimization of the QL only runs over a bounded set (denoted by B or H, respectively). This assumption together with (A8) and the other assumptions of (A4) enables us to prove consistency of the parametric and nonparametric estimates and to derive a stochastic expansion of these estimates. Condition (A7) is a standard assumption on the kernels K and L. Condition (A8) guarantees that the Fisher information of the parametric estimate is positive definite. Conditions (A10) and (A11) are used for second-order bounds on expansions of bias terms.
A.2. Asymptotic Theory for Estimation. This section contains asymptotic results on the marginal integration estimates

and the parametric estimate

.
LEMMA A2.1. Suppose that Assumptions (A1)–(A9) apply. If the elements of h and g tend to zero and nh1·····hr g12·····gs2(log n)−2 tends to infinity, then

converges to a centered Gaussian variable with variance

where fT−1 and fT are the densities of T−1 or T = (T1,T−1), respectively. (For a vector (v1,…,vd) with

we denote the vector (v1,…,vj−1,vj+1,…,vd) by v−j.) The terms Z1 and Z2 are defined in the following way:

For the asymptotic bias δn1(t1), one has

Here fT1 denotes the density of T1. We write fTj′(v) = (∂/∂vj) fT(v). Furthermore, σL,j2 = ∫s2 dLj, σK2 = ∫s2 dK, and

where H1 is a diagonal matrix with diagonal elements

and where for j = 2,…,d the matrix Hj is a diagonal matrix with diagonal elements

Under the additional assumption of (A10) the rest term oP(h+2 + g+2) in the expansion of δn1(t1) can be replaced by OP(h+4 + g+4).
The estimation of the other additive components mj for j = 2,…,d can be done in the same way as the estimation of m1 in Lemma A2.1. If assumptions analogous to (A1)–(A10) hold for the other components, then the corresponding limit theorems apply for their estimates. (In the assumptions h always denotes the bandwidth of the estimated component, and g is chosen as bandwidth of the other components.) Then under these conditions the estimates

are asymptotically independent. This leads to a multidimensional result. The random vector

The variance

can be estimated by

where

with

The estimation of the nonparametric components also yields an estimate of the parameter β. We show that under certain conditions a rate of order OP(n−1/2) can be achieved. This is a consequence of the iterative application of smoothed local and unsmoothed global likelihood function in the definition of

. Our conditions imply that s + r ≤ 3. This constraint can be weakened by assumption of higher order smoothness of m1,…,md and by the use of higher order kernels.
LEMMA A2.2. Suppose that Assumptions (A1)–(A9) apply. Then, if hgd−1 × n1/2(log n)−1 tends to infinity and h and g = o(n−1/8), it holds that

where Z2 is defined as in Lemma A2.1 and

Our estimate of β achieves the efficiency bound in the partial linear model m(x; t) = G{xTβ + α + m(T1,…,Td)} (see Mammen and van de Geer, 1997). An estimate that takes care of additivity is given by

where

is defined as

with

replaced by

in equation (8). We expect that this estimate achieves higher efficiency. However this estimate has two drawbacks. Calculation of this estimate would need several nested iterative algorithms and is therefore computationally unattractive for large data sets. Moreover, such an estimator is not robust against deviations from additivity.
Compared to

root-n consistency of

requires additional conditions. The estimate

inherits by construction the biases of the nonparametric estimates

. These biases are only of order o(n−1/2) if the elements of h and g are of order o(n−1/4). Note that this is not necessary for

. On the other hand it can be checked that

has, as does

, asymptotic variance of order O(n−1). Clearly, this is not essential as for most applications the parameter α has no direct interpretation.
A.3. Proofs. For simplicity of notation we give all proofs only for the case q1 = ··· = qd = 1. Then r = 1 and s = d − 1. Furthermore we suppose that g1 = ··· = gd−1 and denote this bandwidth by g. The bandwidth h1 is denoted by h.
Proof of Lemma A2.1. We start by showing consistency of the estimate

:

For the proof of (A.4) we show first that

Proof of (A.5). For the proof of claim (A.5) we show first that

where the following notation has been used:

For the proof of (A.6) we remark first that

This can be seen by standard smoothing arguments. Furthermore, Δ1(η,t,β) is a sum of i.i.d. random variables with bounded Laplace transform (see Assumption (A2)). By standard application of exponential inequalities we get for every ν1 > 0 that for C′ large enough

We consider the partial derivatives of the summands of Δ(η,t,β) with respect to η, t, and β. They are bounded by C′′nν2 for C′′ and ν2 large enough. Together with (A.8), following the same argument as in Härdle and Mammen (1993), we obtain (A.6).
For the proof of (A.5), one can conclude from (A.6) that, with probability tending to one,

lies in the interior of H (see Assumption (A4)). This gives

With (A.6) we obtain

With Assumption (A4) this yields (A.5). █
We use (A.5) to prove (A.4) (consistency of
).
Proof of (A.4). Let k(β) = E [Q{XTβ + mβ(T);Y}] . We will show that

This implies claim (A.4) because

is strictly negative definite and k(β0) = supβ∈H k(β).
It remains to prove (A.10). This follows from


Claim (A.11) holds because

converges to k(β) by the law of large numbers and because

is tight. For the proof of tightness note first that

Under our conditions, Tn,1 and Tn,2 are bounded in probability. To see that (∂/∂β)mβ(t) is uniformly bounded in β and t note that

Equation (A.13) follows by differentiation of E {λ′(βTX + mβ(t))|T = t} = 0. This shows (A.11). Claim (A.12) follows from

Thus finally (A.4) is shown. █
Next, we establish uniform stochastic expansions of

.


with


Equations (A.14) and (A.15) follow from a slight modification of Lemma A3.3 and Corollary A3.4 in Härdle et al. (1998). There it has been assumed that the likelihood is maximized for β in a neighborhood of β0 with radius ρ1 (see Härdle et al., 1998, Assumption (A7)). In our setup we have that for a sequence δn′ with δn′ → 0 with probability tending to one

Using the same arguments as in Härdle et al. (1998), one can show that

This shows (A.14). Equation (A.15) can be shown similarly.
With the help of (A.15) we arrive at

where

where λj′, κj, and Zi are defined by equations (A.1), (A.3), and (A.19), respectively. Given

, the term Δ1(t1) is a sum of independent variables. For the conditional variance the following convergence holds in probability:

For this convergence, one uses, e.g.,

Asymptotic normality of

follows from the convergence of the conditional variance and from

for all δ > 0. Here dK is the Kolmogorov distance, which is for two probability measures μ and ν (on the real line) defined as

For the proof of (A.21) one shows that a conditional Lindeberg condition holds with probability tending to one. It remains to study the conditional expectation

. This can be done by showing first that

where the function a1 is defined in Lemma A2.1 and rn = OP(ρ22 + n−1/2) + oP(h2 + g2). Furthermore, rn = OP(ρ22 + n−1/2 + h4 + g4) under the additional assumption (A10). The proof of (A.22) follows by standard but tedious calculations. The asymptotic form of

can be easily calculated from (A.22). Note that the asymptotic bias of

is asymptotically equal to

because we assumed that ∫w1(v1)m1(v1) fT1(v1) dv1 = 0. Furthermore, note that up to first order,

have the same asymptotic variance. █
Proof of Lemma A2.2. The conditions on h and g imply ρ22 = o(n−1/2). Therefore the statement of Lemma A2.2 can be followed from (A.14). █
Proof of Theorem 3.1. The statement of the theorem follows from

Claim (A.23) follows from


where

and where R1 has been defined after (A.20).
We give only the proof of (A.24). Claim (A.25) follows similarly. By (A.20) we have that

Similarly, one obtains

For claim (A.24) it suffices to show

This can be done by lengthy but straightforward calculations. We do not want to give all details here. In a first step one shows that

where

The left-hand side of (A.27) can be treated by using Taylor expansions of G and the stochastic expansions of

given in (A.20). Consider, e.g., for k ≠ 1

Then by using the expansions of

given in (A.20) and the expansion of the bias of

(see Lemma A2.1) one sees that

with some uniformly bounded constants

:

It can be easily seen that Ck1(t1) = OP(h4 + g4 + n−1/2) and Ck2(t1) = OP(n−1/2). We have discussed this term because it shows how the terms of order g2 cancel in

. By similar calculations for the other terms one can show the theorem. █
Proof of Theorem 3.2. For the proof we make use of the following lemma.
LEMMA A3.1. Under the assumptions of Theorem 3.2, it holds that

where Kj(2)(u) = ∫Kj(u − v)K(v) dv is the convolution of Kj with itself.
We now give a proof of Lemma A3.1. Theorem 3.2 follows by replication of the arguments for the “bootstrap world.”
We consider the statistic

Note that

We will show that


where

The function a1 has been defined in the statement of Lemma A2.1. Asymptotic normality of V can be shown as in Härdle and Mammen (1993). In particular, one gets (with pairwise different indices i, j, k, and l)

Because vn2 is of order h−1 for the proof of the theorem it remains to show (A.28) and (A.29).
Proof of (A.28). Because ρ22 = o(n−1/2), it follows from (A.15) (compare (A.20)) that uniformly for t1 in ST,1−

Furthermore, for Δ1(t1) one can show the following uniform expansion:

By similar expansions as in the proof of Lemma A2.1 one can show that this implies the following uniform expansion of
:

where

with some uniformly bounded functions ωi,n,2:

The function δn1 has been defined in Lemma A2.1.
Furthermore, using similar arguments as in the proof of Theorem 3.1 one can show that

for some uniformly bounded functions ωi,n,3. Together with (A.30) and a stochastic expansion of

this gives that uniformly for t1 in ST,1−

for some uniformly bounded functions ωi,n,4.
Claim (A.28) follows from

These bounds can be shown by calculation of expectations of the terms on the left-hand side. █
Proof of (A.29). Because of Lemma A2.2, we have that

. Moreover we can easily show that

It follows that

Now,

This proves (A.29). ██
Proof of Theorem 3.3. The proof follows the lines of the proof of Theorem 3.2. In a first step one again shows asymptotic normality of the test statistic.
LEMMA A3.2. Under the assumptions of Theorem 3.3, it holds that

with en and vn defined as in Lemma A3.1. █
Proof of Theorem 3.4. The proofs for Models A and B can be done as in Neumann and Polzehl (1998), where wild bootstrap of one-dimensional regression functions has been considered. In this paper it has been shown that the regression estimates in the bootstrap world and in the real world can be approximated by the same Gaussian process. For this purpose one shows that

have linear stochastic expansions. In particular, using the expansions given in the proof of Lemma A2.1, one shows that

Here, for δ > 0 small enough we have put ST,1− = {s : there exists a u ∉ ST,1 with |s − u| ≤ δ}. (Then, if δ is small enough we have that w1(t1) = 0 for s ∉ ST,1−.) Similarly one can see that

By small modifications of the arguments of Neumann and Polzehl (1998) one can see that their approach carries over to our estimates.
We now will give a sketch of the proof for Model C. First note that

in probability where

denotes the conditional distribution given

. This can be seen as in Neumann and Polzehl (1998). The proof of the theorem will be based on strong approximations. For this purpose we introduce random variables Y1+,Y1++,…,Y1+,Y1++,…,Yn+,Yn++ by the following construction: choose an i.i.d. sample U1,…,Un that is independent of

. We put Yi+ = Fi−1(Ui) and Yi++ = Gi−1(Ui), where Fi and Gi are the distribution functions of

, respectively. Then given the original data (X1,T1,Y1),…,(Xn,Tn,Yn), (Y1+,Y1++),…,(Yn+,Yn++) are conditionally i.i.d.,

. Furthermore we have that

Here E* denotes the conditional expectation given the original data (X1,T1,Y1),…,(Xn, Tn,Yn). Note that

belong to the same exponential family with expectation

, respectively. Property (A.31) follows from

Put

. The estimate of the first component that is based on the sample Y1+,…,Yn+ is denoted by

. The estimate that is based on Y1++,…,Yn++ is denoted by

.
We argue now that for τ > 0 small enough

This can be seen by straightforward calculations using (A.31) and the fact that the natural parameter of

is bounded away from the boundary of the natural parameter space of the exponential family (see Assumption (A2)).
It can be shown that for a sequence cn = o(1) and for all an < bn with bn − an ≤ cn log n (nh)−1/2 one has that P(S ∉ [an,bn]) converges to 0. This can be seen similarly as for kernel smoothers in one-dimensional regression (see, e.g., Neumann and Polzehl, 1998). The statements of Theorem 3.4 follow from


We give here only the proof of (A.35). One shows first that

This can be done by using expansions of the type (A.15). Note that the bias of

is of order oP((nh)−1/2[log n]−1/2). So, for (A.35) it remains to show

For the proof of this claim we use a standard method that has been applied for calculation of the sup-norm of linear smoothers. We show first that for all constants C1 > 0 there exists a constant C2 such that

where κn [nh/ρ1]−1/2[log n]3/2 and where P* denotes the conditional distribution given the original data (X1,T1,Y1),…,(Xn,Tn,Yn). Note that κn = o((nh)−1/2[log n]−1/2). Equation (A.37) implies a modification of claim (A.36) where the supremum runs only over a finite grid of O(nC1) elements. The unmodified claim (A.36) follows by taking a crude bound on

It remains to show (A.36). Note that

We use now the expansion exp[x] ≤ 1 + x + x2/2 {1 + exp[x]}. Because of E*εi+ − εi++ = 0 and because of (A.32) this gives that the last term is bounded by

where C is a constant. We use now 1 + x ≤ exp[x] . This gives the bound

With another constant C′ this can be bounded by

For C2 large enough, this is of order o(nC1). This shows (A.36).
References
REFERENCES
Ai, C.
(1997)
A semiparametric maximum likelihood estimator.
Econometrica
65,
933–963.Google Scholar
Beran, R.
(1986)
Comment on “Jackknife, bootstrap, and other resampling
methods in regression analysis” by C.F.J. Wu.
Annals of Statistics
14,
1295–1298.Google Scholar
Carroll, R.J.,
J. Fan,
I. Gijbels, &
M.P. Wand
(1997)
Generalized partially linear single-index models.
Journal of the American Statistical Association
92,
477–489.Google Scholar
Deaton, A. &
J. Muellbauer
(1980)
Economics and Consumer Behavior.
Cambridge University Press.
Eubank, R.L. &
P.L. Speckman
(1993)
Confidence bands in nonparametric regression.
Journal of the American Statistical Association
88,
1287–1301.Google Scholar
Fan, J.,
W. Härdle, &
E. Mammen
(1998)
Direct estimation of low dimensional components in additive models.
Annals of Statistics
26,
943–971.Google Scholar
Goldberger, A.S.
(1964)
Econometric Theory.
Wiley.
Gozalo, P.L. &
O.B. Linton
(2001)
Testing additivity in generalized nonparametric regression models.
Journal of Econometrics
104,
1–48.Google Scholar
Hansen, M.H.,
J.Z. Huang,
C. Kooperberg,
C.J. Stone, &
Y.K. Truong
(2002)
Statistical Modeling with Spline Functions: Methodology and Theory.
Springer-Verlag.
In press.
Härdle, W.,
S. Huet,
E. Mammen, &
S. Sperlich
(1998)
Semiparametric additive indices for binary response and generalized
additive models.
Discussion Paper 95,
Sanderforschungsbereich 373,
Berlin.
Härdle, W. &
E. Mammen
(1993)
Testing parametric versus nonparametric regression.
Annals of Statistics
21,
1926–1947.Google Scholar
Härdle, W.,
E. Mammen, &
M. Müller
(1998)
Testing parametric versus semiparametric modelling in generalized
linear models.
Journal of the American Statistical Association
93,
1461–1474.Google Scholar
Härdle, W.,
E. Mammen, &
I. Proenca
(2001)
A bootstrap test for single index models.
Statistics
35,
427–452.Google Scholar
Hastie, T.J. &
R.J. Tibshirani
(1990)
Generalized Additive Models.
Chapman and Hall.
Horowitz, J.L.
(1998)
Semiparametric Methods in Econometrics.
Lecture Notes in Statistics
131,
Springer-Verlag.
Horowitz, J.L.
(2001)
Nonparametric estimation of a generalized additive model with an
unknown link function.
Econometrica
69,
499–513.Google Scholar
Leontief, W.
(1947)
Introduction to a theory of the internal structure of functional
relationships.
Econometrica,
15
361–373.Google Scholar
Linton, O.B. &
W. Härdle
(1996)
Estimating additive regression models with known links.
Biometrika
83,
529–540.Google Scholar
Linton, O.B. &
J.P. Nielsen
(1995)
A kernel method of estimating structured nonparametric regression
based on marginal integration.
Biometrika
82,
93–101.Google Scholar
Mammen, E.
(1992)
When Does Bootstrap Work? Asymptotic Results and Simulations.
Lecture Notes in Statistics
77,
Springer-Verlag.
Mammen, E. &
S. van de Geer
(1997)
Penalized quasi-likelihood estimation in partial linear models.
Annals of Statistics
25,
1014–1035.Google Scholar
Mammen, E.,
O.B. Linton, &
J.P. Nielsen
(1999)
The existence and asymptotic properties of a backfitting projection
algorithm under weak conditions.
Annals of Statistics
27,
1443–1490.Google Scholar
McCullagh, P. &
J.A. Nelder
(1989)
Generalized Linear Models.
Chapman and Hall.
Neumann, M. &
J. Polzehl
(1998)
Simultaneous bootstrap confidence bands in nonparametric regression.
Journal of Nonparametric Statistics
9,
307–333.Google Scholar
Opsomer, J.D. &
D. Ruppert
(1999)
A root-n consistent estimator for semiparametric additive
modeling.
Journal of Computational and Graphical Statistics
8,
715–732.Google Scholar
Severini, T.A. &
J.G. Staniswalis
(1994)
Quasi-likelihood estimation in semiparametric models.
Journal of the American Statistical Association
89,
501–511.Google Scholar
Sperlich, S.,
D. Tjøstheim, &
L. Yang
(2002)
Nonparametric estimation and testing of interaction in additive
models.
Econometric Theory
18,
197–251.Google Scholar
Stone, C.J.
(1985)
Additive regression and other nonparametric models.
Annals of Statistics
13,
685–705.Google Scholar
Tjøstheim, D.J. &
B.H. Auestadt
(1994)
Nonparametric identification of nonlinear time series: Projections.
Journal of the American Statistical Association
89,
1398–1409.Google Scholar
Wu, C.F.G.
(1986)
Jackknife, bootstrap, and other resampling methods in regression
analysis. (with discussion)
Annals of Statistics
14,
1291–1380.Google Scholar
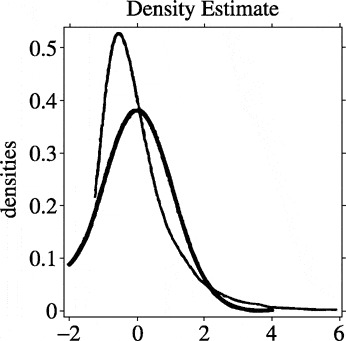
Standardized density estimate of the test statistic (thin line) and convoluted standard normal density (thick line).
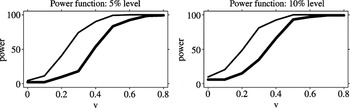
Power functions for theoretical levels 0.05 (left) and 0.1 (right), for the nonparametric bootstrap test (thick line) and the likelihood ratio test (thin line).
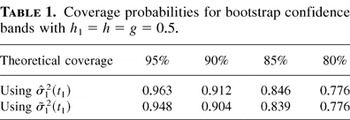
Coverage probabilities for bootstrap confidence bands with h1 = h = g = 0.5.
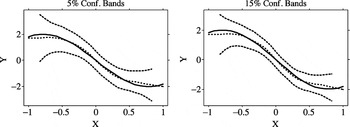
95% and 85% confidence bands, using . Dashed lines are the confidence bands and corresponding estimates; solid lines are the data-generating functions.
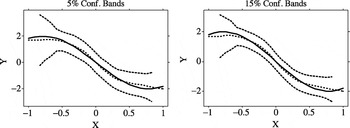
95% and 85% confidence bands, using . Dashed lines are the confidence bands and corresponding estimates; solid lines are the data-generating functions.
 You have
Access
- 72
- Cited by