Implications
Genomic information is now being included in national dairy and beef cattle genetic evaluations to increase the accuracy of selection. Generation of individual animal genotype information can, however, be expensive. Based on knowledge that an animal receives half its DNA from its sire and half from its dam, we hypothesise that genotypes from several progeny could be used to predict, or impute, the genotype of the parents. The accuracy of imputing parental genotypes from genotyped half-sib progeny groups was, on average, 98% when 12 genotyped half-sib progeny were available. This could reduce the necessity and therefore cost of genotyping some ancestral animals.
Introduction
Genomic selection (Meuwissen et al., Reference Meuwissen, Hayes and Goddard2001) exploiting genome-wide information on individual animals is increasing in popularity as a method of genetic evaluation in dairy (Hayes et al., Reference Hayes, Bowman, Chamberlain and Goddard2009) and beef (Saatchi et al., Reference Saatchi, Schnabel, Rolf, Taylor and Garrick2012) cattle. The accuracy of genomic predictions improves non-linearly with an increase in size of the population of genotyped and phenotyped animals (Daetwyler et al., Reference Daetwyler, Villanueva and Woolliams2008), commonly referred to as the training population or reference population. However, generating such a large reference population is costly.
Several countries and breeding companies have shared dairy cattle genotypes either through a series of bilateral agreements (Cromie et al., Reference Cromie, Berry, Wickham, Kearney, Pena, van Kaam, Gengler, Szyda, Schnyder, Coffey, Moster, Hagiya, Weller, Abernethy and Spelman2010) or through the development of consortia (David et al., Reference David, de Vries, Feddersen and Borchersen2010; Jorjani et al., Reference Jorjani, Zumbach, Dürr and Santus2010; Muir et al., Reference Muir, Van Doormaal and Kistemaker2010). Sharing of genotypes in dairy cattle is particularly beneficial because of the provision of international genetic evaluations by INTERBULL. These international genetic evaluations (i.e. MACE evaluations) can subsequently be included in national genomic evaluations (Lund et al., Reference Lund, Roos, de Vries, Druet, Ducrocq, Fritz, Guillaume, Guldbrandtsen, Liu, Reents, Schrooten, Seefried and Su2011). Hence, a bull born in a foreign country may receive an estimated breeding value in all countries despite having no progeny in those countries and therefore once a genotype is available, the sire can be included in the reference population of the national genomic evaluations using his INTERBULL breeding value. Furthermore, accuracy of genomic prediction can be increased with the addition of (sometimes by then dead) female animals to the reference population (Pryce and Hayes, Reference Pryce and Hayes2012); therefore imputing genotypes of influential females with no available biological sample could be useful to increase the accuracy of genomic predictions (Pimentel et al., Reference Pimentel, Wensch-Dorendorf, König and Swalve2013).
International genetic evaluations in beef cattle are, however, currently not routinely undertaken in many countries, although a concerted effort, through INTERBEEF (Venot et al., Reference Venot, Pabiou, Fouilloux, Coffey, Laloë, Guerrier, Cromie, Journaux, Flynn and Wickham2007) and BreedPlan (http://breedplan.une.edu.au/), is underway. Therefore, the benefit for national genomic evaluations of sharing beef genotypes among countries where animals have estimated breeding values in only one or a small number of countries may be limited. If, however, parental genotypes could be accurately imputed from genotyped half-sib families, then international sharing of beef genotypes (and also dairy genotypes) may indeed be advantageous even in the short term. This is because the genotype of a bull with a useful phenotype in a country but no genotype available could be imputed from son genotypes available from other collaborating countries.
The objective of this study was therefore to evaluate the accuracy of imputing a sire’s genotype from the genotypes of its progeny using a combined family- and population-based imputation algorithm. Real genotype data from dairy and beef populations were used in this study. Results from this study will be useful in evaluating the potential to impute the genotype of an animal of interest where biological material or a genotype is not available but genotypes of its progeny are available.
Material and methods
Data
Illumina (http://www.illumina.com) high-density (HD) genotypes (777 962 single nucleotide polymorphisms; SNPs) were available on 3122 dairy and beef bulls with progeny in Ireland; all animals had a genotype call rate of ⩾0.95. The SNP positions were based on the UMD 3.1 genome build (University of Maryland, College Park, MD, USA). The number of bulls per breed was 269, 196, 710, 234, 719, 730 and 264 for Angus, Belgian Blue, Charolais, Hereford, Holstein–Friesian, Limousin and Simmental, respectively. Mendelian inconsistencies were used to validate animal identification through parentage assessment but also to discard autosomal SNPs that did not adhere to Mendelian inheritance (i.e. sire was homozygous for one allele and progeny was homozygous for the other allele). Subsequently, only autosomal SNPs of known genomic location (n=735 151 SNPs) were retained for this analysis. No other SNP edits were applied (this data set will be hereon in referred to as the ‘beef+dairy’ data set).
Two alternative SNP density panels, as well as the HD panel described above, were evaluated. To mimic the commercially available Illumina BovineSNP50 Beadchip (50K) genotyping platform, the 47 770 autosomal SNPs common to both genotyping platforms were retained. To mimic the commercially available Illumina BovineLD low-density (LD) genotyping platform, the 6501 autosomal SNPs common to both the Illumina LD and HD genotype platforms were retained.
Illumina BovineSNP50 Beadchip genotypes (i.e. 54 001 SNPs) were also available on 5489 Holstein–Friesian bulls as described by Berry and Kearney (Reference Berry and Kearney2011); all animals had a genotype call rate of ⩾0.95. Parentage was verified using genomic information and SNPs were filtered according to the same criterion as in HD described previously. A total of 51 602 SNPs remained. This data set will be hereon referred to as the ‘dairy-only’ data set. The pedigree of all animals was traced back to founder animals.
Imputation scenarios
In all scenarios evaluated across both data sets, the genotype of the sire of a family was imputed. Imputation was undertaken for each chromosome separately using FImpute V2.2 (Sargolzaei et al., Reference Sargolzaei, Chesnais and Schenkel2011) combining family- and population-based imputation. The FImpute algorithm begins using family information, if available, and then exploits population information. In the family imputation step, genotypes of immediate relatives (e.g. parents, progeny) are traced to detect haplotypes matches between relatives and the target individual. Population imputation is performed by searching for haplotype matches starting with long haplotypes and moving slowly to shorter haplotypes. Long haplotypes are usually found in close relatives and are highly accurate. The longer haplotype matches then act as an anchor for detecting shorter haplotypes. Similarly, for ungenotyped animals, first parents and progeny information is used to infer the most likely genotypes and haplotypes, which is then followed by population imputation.
Preliminary analyses of the beef+dairy data set revealed no difference in imputation accuracy of sires whether the imputation was undertaken within breed or across breed; therefore, all imputation was undertaken across breeds. Preliminary analyses also revealed a benefit of including animal genotypes in the reference population, which were not directly related to the sire being imputed although the benefit diminished as the half-sib progeny group size increased; therefore animals not directly related to the sire to be imputed were also included in the reference population. Scenarios evaluated differed by paternal half-sib family size and also whether or not the genotype of the sire’s sire was included in the analysis. Only one generation back was imputed.
Preliminary analyses clearly showed an inability to impute the genotype of a large number of sires when a paternal half-sib family size of just three was used. Therefore, the first scenario evaluated the ability of four half-sibs only to impute the genotype of the sire; this was evaluated with or without the genotype of the sire’s sire included in the analysis. Some families had more than four genotyped paternal half-sibs. For sires with between five and seven half-sibs genotyped, a random four half-sibs were chosen for the reference population with the remainder discarded. For sires with eight genotyped paternal half-sib progeny, the analysis evaluating four parental half-sib progeny was run twice using the first and second set of four paternal half-sibs in separate analyses. For sires with between 9 and 11 half-sib progeny, 8 randomly selected half-sibs (i.e. 2 sets of 4 half-sibs) were included in the reference population with the remaining (i.e. modulus of 4) animals discarded. For sires with at least 12 paternal half-sibs the analysis was run 3 times using each of the (randomly selected when >12 paternal half-sibs) 3 sets of 4 paternal half-sibs in separate analyses. A similar approach was used in the evaluation of paternal half-sib groups of 5 and 6 (i.e. more than one half-sib grouping per sire was used when the number of available half-sibs was ⩾10 or ⩾12 when evaluating progeny half-sib group sizes of 5 and 6, respectively). The calculated accuracy of imputation in the present study included these additional iterations on the same sire. For example, the accuracy of imputation from 4 paternal half-sibs was based on the number of sires with 4 to 7 paternal half-sibs, 2 times the number of sires with between 8 and 11 half-sibs, and 3 times the number of sires with ⩾12 paternal half-sibs. Therefore, the number of comparisons included in the analysis was greater than the number of sires. Although the number of animals in the reference population varied with the half-sib progeny group size being evaluated, preliminary analysis revealed negligible effect of the varying reference population size on imputation accuracy.
Imputation statistics
The efficiency and accuracy of imputation was calculated as: (1) the proportion of genotypes that could not be imputed, (2) the genotype concordance rate defined as the average proportion of correctly imputed genotypes within SNP or within animal, (3) the allele concordance rate defined as the average proportion of correctly imputed alleles within SNP or within animal; in this instance a genotype imputed to be heterozygote but was truly homozygote was assumed to have one correct allele imputed. Genotypes not called by the imputation algorithm were not included in the calculation of the latter two measures of imputation accuracy.
The accuracy of imputation was also quantified for the ends of each chromosome relative to the rest of the chromosome for the HD genotypes in the dairy+beef data set. The 10 SNPs at each periphery of each chromosome were assumed to represent the ends of the chromosome. Least square means of the proportion of genotypes not imputed as well as the mean allele concordance rate were estimated using a fixed effects model; whether or not the SNP was located on the end of a chromosome was included as a binary fixed effect in the model. Furthermore, whether any difference among breeds existed in the accuracy of imputation was tested also using a fixed effects model where the dependent variable was concordance rate and the fixed class effect was breed.
Results
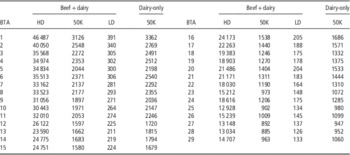
The number of SNPs per chromosome for the three different density panels in the beef+dairy data set and the 50K panel in the dairy-only data set are summarised in Table 1. The number of records included in the reference population including animals that were not direct progeny of the sire to be imputed (sire genotypes to be imputed in parenthesis) for paternal half-sib groups of 4, 5, 6, 7 and 8 in the beef+dairy data set was 2664 (157), 2800 (98), 2893 (69), 2959 (37) and 2997 (25), respectively. The number of records included in the reference population, including animals that were not direct progeny of the sires to be imputed (validation population in parenthesis) for paternal half-sib groups of 4 to 12 in the dairy-only data set was 2506 (258), 2764 (167), 2994 (142), 3193 (87), 3375 (81), 3543 (71), 3699 (64), 3845 (59) and 3976 (55), respectively. A total of 547 dairy animals were common to both the beef+dairy and dairy-only data sets.
Number of single nucleotide polymorphisms for the high-density (HD), medium-density (50K) and low-density (LD) genotyping panels for each chromosome (BTA) in the beef+dairy and dairy-only data setsFootnote †

† Beef+dairy data set includes both beef (n=2403) and dairy (n=719) animals while the dairy-only data set includes 5489 dairy (i.e. Holstein–Friesian) animals with 50K genotypes.
Animal imputation accuracy in beef+dairy data set
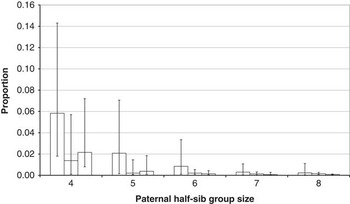
The distribution of the within-animal proportion of genotypes that could not be imputed by the imputation algorithm was positively skewed. The median proportion of genotypes per sire that could not be imputed is illustrated in Figure 1 for the different paternal half-sib progeny groups and genotype density panels. Irrespective of genotype density panel, the median proportion of genotypes per animal that could not be imputed, as well as the variation in proportion of genotypes per animal that could not be imputed, declined as paternal half-sib progeny group size increased. Median proportion of genotypes per animal that could not be imputed was always greatest for the LD genotype panel. For paternal half-sib group sizes of four and five, the median proportion of genotypes that could not be imputed was lowest for the 50K genotyping panel but for paternal half-sib groups of six or greater the lowest proportion of genotypes that could not be imputed was for the HD panel (Figure 1).
Median proportion of genotypes per animal that could not be imputed for each paternal half-sib group size in the beef+dairy data set for each of the genotyping density (from left to right – low density, medium density, high density). Error bars represent individual animals with the greatest and lowest proportion of genotypes not imputed.

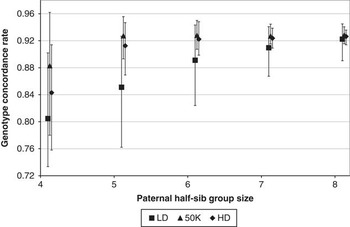
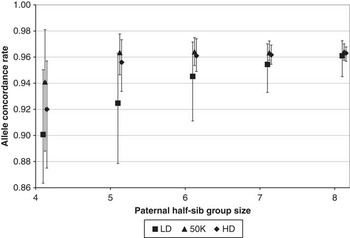
Within-animal genotype and allele concordance rates were normally distributed. Mean animal genotype and allele concordance rate for the three different genotype density panels across different half-sib progeny group sizes in the beef+dairy data set are illustrated in Figures 2 and 3, respectively. Irrespective of the genotype density panel, the concordance rates improved almost consistently with an increase in paternal half-sib progeny group size. Concordance rates were always lowest for the LD genotype panel and were always greatest for the 50K genotype panel. The difference, however, in concordance rates between genotype density panels diminished with increase in paternal half-sib progeny group size to a mean allele concordance rate of 0.96 for all three panel densities with a half-sib progeny group size of eight. These trends in concordance rates both between genotype density panels and differences in paternal half-sib progeny group size, were the same when the concordance rate of only 25 sires with at least 8 progeny were compared across the different scenarios (results not shown). The pair-wise correlation between the animal mean allele concordance rate (paternal half-sib progeny group size of 5; n=98) for the different genotype densities was 0.54 (LD and 50K), 0.49 (LD and HD) and 0.82 (50K and HD). Mean accuracy of imputation per animal did not differ (P>0.05) by breed of animal.
Mean animal genotype concordance rate in the beef+dairy data set for the low-density (square), medium-density (triangle) and high-density (diamond) genotyping panels across different paternal half-sib progeny group sizes. Error bars represent the lowest and greatest mean concordance rate within animal.

Mean animal allele concordance rate in the beef+dairy data set for the low-density (square), medium-density (triangle) and high-density (diamond) genotyping panels across different paternal half-sib progeny group sizes. Error bars represent the lowest and greatest mean concordance rate within animal.

Animal imputation accuracy in dairy-only data set
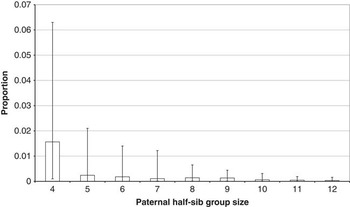
The median proportion of genotypes per animal that could not be imputed was inversely related to paternal half-sib progeny group size (Figure 4) and decreased from a median of 0.015 when only 4 half-sib progeny was available to a median of 0.0003 when 12 half-sib progeny were available. Some sires had up to 0.054 of their genotype not imputed when genotypes on only 4 half-sib progeny were available but this reduced to 0.002 when genotypes were available on 12 half-sib progeny.
Median proportion of genotypes per animal that could not be imputed for each paternal half-sib group size in the dairy-only data set. Error bars represent individual animals with the greatest and lowest proportion of genotypes not imputed.

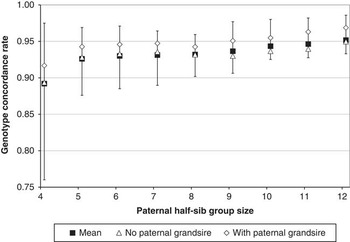
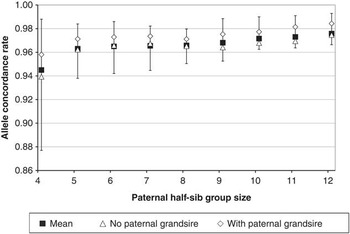
Within-animal genotype and allele concordance rates were normally distributed. Mean animal genotype concordance rate increased from 0.886 when genotypes on 4 half-sib progeny were available to 0.924 when genotypes on 5 half-sib progeny were available (Figure 5) after which the concordance rates increased only slightly, although consistently, with each unit increase in progeny group size; maximum mean genotype concordance rate (0.952) was achieved when genotypes were available on 12 half-sib progeny. Animal genotype concordance rate varied from 0.933 to 0.986 for sires (n=55) with genotypes on 12 half-sib progeny. The allele concordance rate (Figure 6) followed a similar pattern to the genotype concordance rate with a mean allele concordance rate of 0.942, 0.962 and 0.976 for sires with 4, 5, and 12 genotyped half-sib progeny, respectively.
Mean animal genotype concordance rate in the dairy-only data set for the medium-density genotyping panel across different paternal half-sib progeny group sizes. Error bars represent the, within animal, lowest and greatest mean concordance rate. Also represented is the mean animal genotype concordance rate for a subset of the data across different parental half-sib progeny groups sizes when the paternal grand sire’s genotype is (diamond) or is not (triangle) included in the analysis.

Mean animal allele concordance rate in the dairy-only data set for the medium-density genotyping panel across different paternal half-sib progeny group sizes. Error bars represent the, within animal, lowest and greatest mean concordance rate. Also represented is the mean animal allele concordance rate for a subset of the data across different parental half-sib progeny groups sizes when the paternal grand sire’s genotype is (diamond) or is not (triangle) included in the analysis.

Up to eight sires had genotyped half-sib progeny group sizes greater than or equal to four plus their sire genotyped. The impact on imputation of whether or not the genotype of the sire’s sire was included in the imputation process is illustrated in Figures 5 and 6 for genotype and allele concordance rate, respectively. Concordance rate was always better when the genotype of the sire’s sire was also included in the imputation. The benefit in mean animal genotype concordance rate varied from 0.010 to 0.023 while the benefit in mean allele concordance rate per animal was lower and varied from 0.006 to 0.016. Albeit just based on eight sires, the allele concordance rate per animal varied from 0.976 to 0.991 when the genotype of the sire’s sire was included in the imputation process while the allele concordance rate of the same animals varied from 0.927 to 0.974 when the genotype of the sire’s sire was omitted.
Locus imputation accuracy
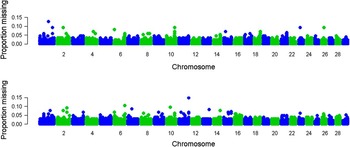
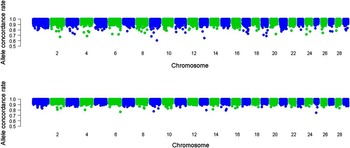
Figure 7 shows the mean proportion of alleles not imputed per SNP, across the genome for the 50K genotyping panel in both dairy+beef and the dairy-only data sets where genotypes on five half-sib progeny per sire were available. The mean genotype concordance rate per SNP locus is also detailed in Figure 8 for the 50K genotyping panel in both dairy+beef and the dairy-only data sets where genotypes on five progeny per sire were available. Several regions existed with a relatively high proportion of SNPs that could not be imputed; for example, the region 59.0 Mb to 61.5 Mb on chromosome 21 contained several SNPs with a relatively high proportion of genotypes that could not be imputed. Of the 45 886 SNPs in common between the 50K panel in the beef+dairy and dairy-only panel, the Spearman rank correlation between the mean allele concordance rate was 0.55 for a paternal half-sib progeny group size of five.
Proportion (*104) of single nucleotide polymorphisms that could not be imputed in the beef+dairy (top figure) and dairy-only (bottom figure) by genome location.

Allele concordance rate per single nucleotide polymorphisms in the beef+dairy (top figure) and dairy-only (bottom figure) by genome location.

The mean proportion of alleles per SNP that could not be imputed was more than double (P<0.001) at the ends of the chromosomes compared with the other chromosomal regions as determined using the fixed effects model. Furthermore, the allele concordance rate was 0.8 percentage units lower (P<0.001) in the chromosomal ends compared with the other chromosomal regions when paternal half-sib families of five on the 50K genotyping panel was used.
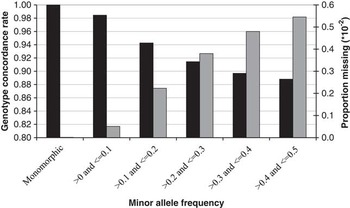
The ability to impute missing genotypes as well as the accuracy of imputation for SNPs varying in minor allele frequency is in Figure 9 for the 50K genotypes in the beef+dairy data set where five half-sib progeny per sire existed. The proportion of genotypes that could not be imputed increased from 0.000015 when the SNP was monomorphic to 0.0055 when the minor allele frequency was >0.4 and ⩽0.5. Mean genotype concordance rate decreased from 0.99999 for monomorphic SNPs to 0.88812 when the minor allele frequency was >0.4 and ⩽0.5.
Mean genotype concordance rate (black bars) and mean proportion (*10−2) of single nucleotide polymorphisms that could not be imputed (grey bars) for different categories of minor allele frequency for the 50K dairy+beef data set with five half-sib progeny per sire.

Discussion
Considerable research now exists in genotype imputation in dairy cattle (Berry and Kearney, Reference Berry and Kearney2011; Dassonneville et al., Reference Dassonneville, Fritz, Ducrocq and Boichard2012) and to a lesser extent in beef cattle (Dassonneville et al., Reference Dassonneville, Fritz, Ducrocq and Boichard2012; Huang et al., Reference Huang, Maltecca, Cassady, Alexander, Snelling and MacNeil2012; Berry et al., Reference Berry, McClure and Mullen2014). These studies primarily consider imputation of missing progeny genotypes from ancestral or population genotypes where the progeny genotypes are of a lower density than the ancestral or population genotypes. Both Pszczola et al. (Reference Pszczola, Mulder and MPL2011) and Pimentel et al. (Reference Pimentel, Wensch-Dorendorf, König and Swalve2013) evaluated the potential to impute a parental genotype from progeny genotypes using simulated data sets. We are not aware, however, of any study that has attempted, using real-life data, to impute parental genotypes from offspring where no genotype whatsoever of the parent was available. Although mean accuracy of imputation would be expected to converge to one if ample genotyped progeny were available, this was not the case in the present study, but the trend of increasing imputation accuracy up to a half-sib progeny group size of 12 was observed implying that possibly an imputation accuracy of one could be achievable if more genotyped progeny were available.
Duplicate 50K genotypes on the same animals in the dairy-only data set were available on 134 animals. Duplicate genotypes were generated either using the same laboratory or were available through international sharing of genotypes (Cromie et al., Reference Cromie, Berry, Wickham, Kearney, Pena, van Kaam, Gengler, Szyda, Schnyder, Coffey, Moster, Hagiya, Weller, Abernethy and Spelman2010). The mean genotype concordance rate per animal was 0.9989 but varied per animal from 0.99300 to 0.99998; the mean allele concordance rate per animal was 0.9993 and varied per animal from 0.99700 to 0.99999. Therefore, the imputation accuracy achieved in the present study was lower than the repeatability of genotypes on the same animal generated in the laboratory, yet it should be recognised that subtle genotype discrepancies exist for the same animal genotyped in different laboratories.
Genotypes that could not be imputed
Genomic selection is now used in national dairy cattle genetic evaluations in most populations (Hayes et al., Reference Hayes, Bowman, Chamberlain and Goddard2009). Genomic selection requires genotypes for all loci so therefore ‘missing’ genotypes are not acceptable. The existence of missing genotypes for individual animals may, however, not be problematic in some algorithms used in genome-wide association studies, for example, when single SNPs are individually included in a regression model (Meredith et al., Reference Meredith, Kearney, Finlay, Bradley, Fahey, Berry and Lynn2012).
Irrespective of the population considered, the median proportion of genotypes per animal that could not be imputed on the 50K genotype panel varied from 0.0003 to 0.015 across the different parental half-sib group sizes. The median missing proportion across half-sib group sizes was similar in both populations. If only paternal half-sib group sizes of at least five animals were considered, the median missing proportion per animal in both populations was <0.0022. The median proportion of autosomal HD SNPs in the 3122 beef+dairy animals where no genotype was called by the laboratory during the genotyping process was 0.0051; this varied per animal from 0.0027 to 0.0486 although a threshold of ⩾0.95 call rate per animal was applied. The median proportion of the autosomal 50K SNPs in the 5489 dairy-only animals where no genotype was called by the laboratory during the genotyping process was 0.012 varying from 0.001 to 0.050, again with a threshold call rate of ⩾0.95 also having been applied. Therefore, the proportion of genotypes that could not be imputed is superior to the proportion of genotypes that were not called by the laboratory during the genotyping process. The genotypes not imputed during the imputation process may be re-imputed using different imputation software (e.g. Beagle; Browning and Browning, Reference Browning and Browning2007 and Reference Browning and Browning2009), which exploits population-based imputation algorithms but will always generate a genotype with a probability. The large reference populations used in the present study as well as the lack of any difference in median proportions not imputed between the beef+dairy or dairy-only data set, which was twice the size of the former, suggests that increasing the reference population of genotyped animals as a whole is unlikely to influence these statistics. However, increasing the number of genotyped half-sib progeny did reduce the median proportion (and variation in the proportion) not imputed, albeit at a diminishing rate with the difference in median proportion missing per animal with 11 half-sib progeny or 12 half-sib progeny being only 0.0001. It is therefore unlikely that increasing half-sib progeny group size >12 will have any noticeable effect on the proportion of SNPs that could not be imputed.
Concordance rates
Most genomic selection algorithms implemented assume that the allele effects are additive and therefore the allele concordance rate may be a more appropriate statistic to evaluate the accuracy of imputation than the genotype concordance rate. The allele concordance rate will always be superior to the genotype concordance rate and the mean differences between these two statistics varied from 0.027 to 0.055 but the difference consistently diminished as the paternal half-sib family size included in the analysis increased. Berry and Kearney (Reference Berry and Kearney2011) showed that the accuracy of imputation calculated using the allele concordance rate was similar to the correlation between the direct genomic values estimated using a GBLUP algorithm with either the imputed or real genotypes; in that study they imputed the 50K genotypes of progeny who had already genotype information for almost 3000 SNPs of the 50K genotype panel. Nonetheless, the impact of the accuracy of imputation, irrespective of whether the genotype or allele concordance rate is used, will be dictated by the genomic prediction algorithm used but also the extent of the true association or effect between that SNP and the phenotype of interest. For example, if only a selection of SNPs are used in the genomic predictions, as is the case in some Bayesian approaches (BayesB – Meuwissen et al., Reference Meuwissen, Hayes and Goddard2001; BayesCπ – Habier et al., Reference Habier, Fernando, Kizilkaya and Garrick2011), then it is the accuracy of imputation for the selected SNPs which is important. However, inaccuracies in imputation may also be a contributing factor to whether or not the SNP is selected to enter the statistical model during the genomic prediction process or contribute fully to improved accuracy of prediction (VanRaden et al., Reference VanRaden, Null, Sargolzaei, Wiggans, Tooker, Cole, Sonstegard, Connor, Winters, van Kaam, Valentini, Van Doormaal, Faust and Doak2013).
The genotype and allele concordance rates for the 50K genotype panel in the same paternal half-sib group sizes in the beef+dairy and dairy-only data sets were almost identical with the difference in mean concordance rates, all being <0.0080. This is somewhat unexpected since the large reference population of the single breed (i.e. Holstein–Friesian) in the dairy-only data set may have been expected to be more beneficial in the exploitation of population-based imputation. It may, nonetheless, suggest an upper limit to imputation accuracy (based on the algorithm used in the present study). The greater concordance rates in the 50K genotype panel compared with both the LD and HD genotype panel is also interesting. No difference in mean minor allele frequency existed between the HD (0.25) and 50K (0.24) panels although the mean minor allele frequency in the LD panel was greater (0.39); imputation accuracy varied by minor allele frequency (Figure 9). Furthermore, the difference in accuracy of imputation between genotype panels persisted even when comparing the same SNPs on the 50K but imputed using the information on either the 50K or HD panels. One possible contributing factor to the differences between genotype panels may be inaccuracies in the reported genomic positional locations of SNPs on the HD panel as suggested by Berry et al. (Reference Berry, McClure and Mullen2014). Also of interest is the fact that the differential in imputation accuracy between the different panel densities diminished to almost zero as the size of the paternal half-sib groups increased. There was little benefit in concordance rate for the 50K genotype panel in the beef+dairy data set once the paternal half-sib group size reached five and although the concordance rate was relatively stable also in the dairy-only data set between paternal half-sib group sizes of five to eight, there was a steady increase in imputation accuracy once the paternal half-sib group size increased beyond eight. This suggests that the greater the genotyped half-sib progeny group size the greater the accuracy of imputation. The expectation is that accuracy of imputation increases to one as the number of progeny goes to infinity although this assumes that (1) the algorithm is sufficiently accurate, (2) the genotypes called in the laboratory are correct (both for all progeny and in the present study also the sire to which the comparisons were made) and (3) the genomic locations of the SNPs are accurately known.
To consistently achieve an allele concordance rate of ⩾0.95 in the beef+dairy data set then half-sib progeny groups of at least six were required increasing further to at least eight half-sib progeny in the dairy-only data set. These statistics are based on a population of sires where some of their sires also had genotypes available as well as genotypes on their progeny. Because an animal inherits half its genome from its sire, having access to the genotype of the sire’s sire is expected to improve the accuracy of imputation as observed in this study.
Conclusions
Where biological material or genotypes are not available on individual animals, but at least five progeny can be genotyped (on either a medium-density or HD genotyping platform) the parental alleles can be imputed with, on average, ⩾96% accuracy. This is considerably greater than the accuracy of imputing ungenotyped parents previously reported in simulation studies (Pszczola et al., Reference Pszczola, Mulder and MPL2011; Pimentel et al., Reference Pimentel, Wensch-Dorendorf, König and Swalve2013) but are, nonetheless, not directly comparable because of differences in half-sib progeny groups sizes between studies. The accuracy of imputing parental genotypes from genotyped half-sib progeny groups in the present study was, on average, 98% when 12 genotyped half-sib progeny were available. Hence, even if phenotypic information of individual animals is not available in a population, the genotypes of these descendants may still be very useful in imputing the genotypes of ancestral animals with phenotypes. Possible improvements in imputation algorithms over time may improve further the accuracy of imputation. In addition, improvements in the annotation of the bovine genome may also increase further the accuracy of imputation.
Acknowledgements
Funding of the genotypes from the Irish dairy and beef industry, the Irish Department of Agriculture Research Stimulus Fund (RSF-06-0353; RSF-06-0428; 11/SF/311), EU FP7 Robustmilk (http://www.robustmilk.eu) and Science Foundation Ireland (09/IN.1/B2642) are gratefully acknowledged as well as the sharing of dairy genotypes with international collaborators. This study was part-funded by Genome Canada.