Implications
In early lactation, automatic live weight recordings can be used to adjust feeding of individual cows managed for 16 months extended lactation. An energy-enriched diet in early lactation reduced the magnitude of the negative energy balance as indicated by the plasma NEFA concentration. A carry-over effect from the early lactation high energy density diet to the remaining lactation period was detected as an increased plasma NEFA.
Introduction
Some intensively managed European dairy farms have started to use an extended lactation strategy to avoid unsuccessful early rebreeding (Osterman and Bertilsson, Reference Osterman and Bertilsson2003). Indeed in the traditional 12 months lactation cycle systems, insemination occurs during peak milk yield when most of the cows are in negative energy balance and mobilize body reserves leading to high reproduction failure (Santos et al., Reference Santos, Rutigliano and Sa2009). However, Holstein cows respond individually to the extended lactation management regarding their propensity to gain weight and in their level of feed intake (Kolver et al., Reference Kolver, Roche, Burke, Kay and Aspin2007; Grainger et al., Reference Grainger, Auldist, O'Brien, Macmillan and Culley2009). This means that for use in high yielding dairy herds, the extended lactation strategy needs to be individually modified in order to obtain any potential advantages in improving peak milk yield using high energy diets and keep the absolute milk yield higher for a longer period. Some automatic milking systems are generating data, such as the live weight (LW), that are rarely used by the farmers. One way to utilize these data would be to provide automated individual feeding strategies for cows, especially during early lactation. It has been shown that an individualized and LW adjusted feeding strategy imposed in early lactation increased the lactation milk yield in early and mid-lactation, and also increased persistency of lactation in cows on a 12 months lactation cycle without changing the feed efficiency and with reduced LW loses (Bossen and Weisbjerg, Reference Bossen and Weisbjerg2009; Bossen et al., Reference Bossen, Weisbjerg, Munksgaard and Hojsgaard2009). Nevertheless, the effect of this individualized feeding strategy on metabolism and energy balance has not been studied in an extended lactation scenario. Additional knowledge on the interaction between the physiology of the dairy cow and the feeding strategy is needed to optimize the diet composition. Previous studies showed a strong relationship between the diet composition, the energy status of the cow, and the concentration of plasma metabolites and hormones (Sorensen and Knight, Reference Sorensen and Knight2002; Delany et al., Reference Delany, Macmillan, Grainger, Thomson, Blache, Nicholas and Auldist2010). Plasma concentrations of beta-hydroxybutyrate (BHBA), non-esterified fatty acids (NEFA), glucose, urea, uric acid, insulin, and insulin growth factor 1 (IGF-1) are considered to be relevant indicators of negative energy balance in dairy cows (Aeberhard et al., Reference Aeberhard, Bruckmaier and Blum2001; Kessel et al., Reference Kessel, Stroehl, Meyer, Hiss, Sauerwein, Schwarz and Bruckmaier2008).
The objective of this study was to determine the impact of an individualized feeding strategy on indicators of energy balance (glucose, BHBA, NEFA, insulin and IGF-1) in Holstein cows. An energy-enriched diet was distributed to half of the cows until each cow reached a constant or positive LW gain based on a 5-days average. First, it was hypothesized that an energy enriched feeding strategy in early lactation would reduce the intensity of the mobilization, increase plasma glucose, and decrease plasma NEFA and BHBA. Second, it was hypothesized that after the shift, the effects would be carried-over, prolong energy mobilization, and decrease energy deposition.
Material and methods
Facilities and animals
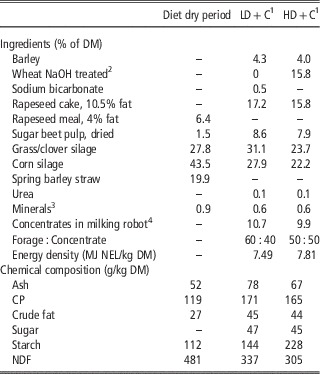
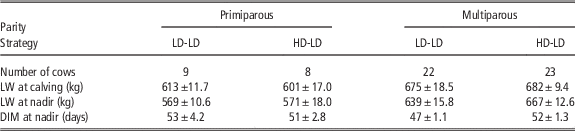
The experiment, approved by The Animal Experiments Inspectorate under the Danish Veterinary and Food Administration, was carried out at the Danish Cattle Research Centre at Aarhus University, AU-Foulum, Denmark. Sixty-two Holstein pregnant cows and heifers entered the experiment 8 weeks before expected calving, from October 2012 to September 2013. Cows and heifers received the same dry cow standard diet (Table 1) through the last 8 weeks of pregnancy, which corresponded to the dry period. Dry cows and heifers were housed on slatted floor with cubicles the first 5 weeks of dry-off, on straw-bedded litter the next 3 weeks and in a calving pen for the last 6 to 24 h before calving. After calving, they entered the experimental group section. All cows were fed the same dry cow ration during this pre-experimental period. At calving, they were blocked according to parity (primiparous or multiparous) (Table 2) and expected calving time, and allocated to one of two feeding strategies. All cows were housed in a common loose-housing system with slatted floor, cubicles with mattresses and bedding, and access to water. The cows had access to one automatic milking unit (DeLaval AB, Tumba, Sweden). The milking frequency was not influenced by the feeding strategy (P=0.34), and was on average 2.77±0.18 per day for the period studied (from calving to 36 weeks). The milking robot was equipped with a device that delivered a restricted amount of concentrate per cow per milking per day and recorded the concentrate refusals. The milking robot was also equipped with a platform scale (Danvaegt, Hinnerup, Denmark) to record the live weight of the animal at each milking. Feed intake of the partially mixed ration was recorded by the Insentec RIC system (Insentec, Marknesse, the Netherlands).
Planned composition of dry period ration, LD and HD rations including concentrates in the milking robot (% of DM), and associated chemical composition (g/kg DM)

LD=lower energy density; HD=high energy density; DM=dry matter.
1 LD+C/HD+C: partially mixed ration/partially mixed ration enriched in energy+concentrates (C) in the milking robot.
2 The NaOH treated wheat was used to increase the proportion of by-pass starch, and was prepared by adding 30 kg of NaOH and 100 l water to 1000 kg of whole wheat kernels and mixing for 10 min.
3 Minerals (per kg): Ca 203.5 mg, Mg 78.2 mg, K 0.5 mg, Na 0.1 mg, Cl 0.1 mg, S 12.6 mg, I 184.2 mg, Se 36.8 mg, Mn 3,684 g, Zn 5,263 g, Co 26.3 mg, Cu 1,052 mg. Vitamins (per kg): A 526 1000 IU, D3 116 1000 IU, alfa-tocopherol 2874 mg, E 3158 IU.
4 Composition of the concentrates in milking robot (%DM): 16.9% sugar beet pulp, dried; 16.8% rapeseed meal, 14.6% barley, 14.6% wheat, 9.0% soybean meal, dehulled; 7.0% sunflower meal, dehulled; 7.0% citrus pulp, dried; 5.0% wheat bran, 5.0% alfalfa meal, 3.0% molasses, cane; 0.7% sodium chloride, 0.3% mineral premix, 0.1% magnesium oxide.
Minerals (kg): Fe 59 mg, Zn 46 mg, Mn 38 mg, Cu 8 mg, J 0.7 mg, Se 0.30 mg, Co 0.11 mg. Vitamins (per kg): A 1000 IU, D3 1000 IU, alfa-tocopherol 45 mg, E 50 mg.
Live weight (±standard error) characteristics of Holstein cows for each strategy (LD-LD or HD-LD) and parity (primiparous or multiparous)

LD=lower energy density; HD=high energy density.
(LD-LD): strategy where Holstein cows were fed LD diet (60 : 40 forage : concentrate ratio).
(HD-LD): strategy where Holstein cows were fed HD diet (50 : 50 ratio) followed by LD diet (60 : 40 ratio).
Experimental design and feeding
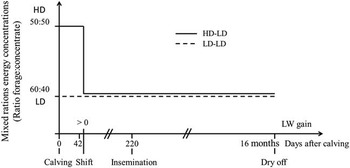
The cows were allocated to one of two feeding strategies at calving with different diets. Two partially mixed rations were used; one with a high energy density (HD) and a 50 : 50 forage : concentrate ratio, and one with a lower energy density (LD, control diet) and a 60 : 40 forage : concentrate ratio. The composition of the diets is shown in Table 1. For both strategies, a maximum of 3 kg concentrate daily was offered in the milking robot. Half of the cows were fed with the HD diet until they reached at least 42 days in milk and a LW gain⩾0 kg/day based on a 5-days LW average, and were then shifted to the LD diet (strategy HD-LD). The other half of the cows were fed the LD diet throughout lactation (control strategy LD-LD) (Figure 1). Both diets, LD and HD, were offered ad libitum. The rations were optimized using the NORFOR model and standards (Volden, Reference Volden2011). Weekly analyses of dry matter content in forages were performed for adjustment of ration composition.
Mixed ration energy concentration during lactation on the two feeding strategies. The graph for the HD-LD Holstein cows represents an example of a cow shifted at 42 days after calving. LD-LD: strategy where Holstein cows were fed LD diet (60 : 40 forage : concentrate ratio). HD-LD: strategy where Holstein cows were fed HD diet (50 : 50 ratio) followed by LD diet (60 : 40 ratio). HD=high energy density; LD=lower energy density.

At the first heat detected after 220 DIM, the insemination started. The cows were dried off 8 weeks before expected calving, or if the milk production dropped below 12 kg per day in two subsequent weeks.
Data recording
Blood samples
Blood was sampled by venipuncture in the tail at 4±1 DIM weekly from calving to 12 weeks in milk (WIM) on Thursday mornings between 10:00 and 12:00. From 14 to 36 WIM, blood samples were taken every second week. The samples were harvested in vacutainers (9–10 ml Sodium-Heparin-vacutainer tube, Becton Dickinson Vacutainer Systems, Plymouth, UK) and put on ice before being centrifuged at 2000× g at 4°C for 10 min. Plasma was harvested to polypropylene tubes and stored at −20°C until analyzed.
Recording
LW was recorded when the cows were visiting the milking robot. Weight recordings (10 times per second) were ‘cleaned up’ following the procedure described in Bossen et al. (Reference Bossen, Weisbjerg, Munksgaard and Hojsgaard2009) to obtain one daily LW per cow. Each time the cow visited the Insentec feeder, feed intake was recorded and daily dry matter intake (DMI R) was calculated. The daily concentrate intake in the milking robot (a maximum of 3 kg/day) was also recorded and daily concentrate dry matter intake calculated (DMI C). Body condition score (BCS) of all cows was scored manually every second week by the same two trained persons. A 1 to 5 points scale with 0.25 points intervals was used (Ferguson et al., Reference Ferguson, Galligan and Thomsen1994). The milk yield was recorded at each individual milking in the milking robot and the milk components (fat, protein, lactose, cells) were measured every week.
Chemical analyses
Metabolites
All the plasma samples (24 per cow) were analyzed for the concentrations of glucose (mmol/l), NEFA (mmol/l), BHBA (mmol/l), uric acid (μmol/l), and urea (mmol/l) by use of an autoanalyzer (ADVIA 1650 Chemistry System; Siemens Medical Solution, Tarrytown, NY, USA). For the quantitative determination of NEFA, the Wako NEFA-HR(2) reagent (Wako Chemicals GmbH, Neuss, Germany), an enzymatic colorimetric method assay, was used. The ADVIA urea nitrogen method is based on the Roch-Ramel enzymatic reaction, using urease and glutamate dehydrogenase. The inverse reaction was used for measuring BHBA. The uric acid method is based on the Fossati enzyme reaction using uricase with a Trinder colorimetric procedure (Fossati et al., Reference Fossati, Prencipe and Berti1980).
Hormones
Plasma samples of 3, 5, 12 and 24 WIM were also analyzed for insulin and IGF-1 (ng/ml). The Mercodia Bovine Insulin ELISA, a solid phase two sites enzyme immunoassay, was used to determine insulin concentrations. The IGF-1 concentration was measured in extracted samples after removal of IGF-binding proteins by use of an in-house double-sandwich FIA (Time-Resolved Fluorescence Immunoassay) validated and described earlier (Frystyk et al., Reference Frystyk, Dinesen and Orskov1995).
Data analysis
Calculation of live weight (LW) gain and energy corrected milk (ECM)
The Wilmink model (Wilmink, Reference Wilmink1987), equation (1) below, was used to fit the daily individual LW measurements, where LW is the live weight (kg); DIM are the days in milk; the factor −0.05 and the parameters a, b and c are associated with the general LW during the lactation, the increase of LW after LW nadir, the decrease of LW toward the LW nadir; and the moment of LW nadir around 50 days after calving calculated from Table 2. The parameters were calculated for each cow by linear regression (lm function in R). Equations for LW gain (2) were found as the derivative of the LW equations for individual cows at 24 time points representative of the 24 blood samples taken per cow. The energy corrected milk (3.14 MJ/kg) was calculated according to the equation (3) (Sjaunja et al., Reference Sjaunja, Baevre, Junkkarinen, Pedersen and Setala1991), with fat, protein and lactose in g/kg; ECM and yield in kg.
 $${\rm LW}{\,=\,}a{\plus}b{\rm }{\times}{\rm DIM}{\plus}c{\rm }{\times}{\rm exp}\left( {{\minus}{\rm }0.0{\rm 5 }{\times}{\rm DIM}} \right)$$
 $${\rm LW \ gain}{\,=\,}b{\rm }-{\rm }0.0{\rm 5 }{\times}{\rm }c{\rm }{\times}{\rm exp}\left( {{\minus}0.0{\rm 5 }{\times}{\rm DIM}} \right)$$
 $$\eqalignno{{\rm ECM}=\,&{\rm yield }{\times}( {38.3}{\times}{\rm fat}{\plus}{24.2}{\times}{\rm protein}{\plus}{15.71} \cr &{\times}{\rm lactose}{\plus}{20.7} )\,/\,{3.14}$$
Calculation of energy balance
Daily energy balance (EB, in MJ NEL/day) was calculated using the following basic equation:
 $${\rm EB}{\,=\,}{\rm E}_{{{\rm intake}}} -{\rm }\left( {{\rm E}_{{{\rm lact}}} {\plus}{\rm E}_{{{\rm maint}}} {\plus}{\rm E}_{{{\rm act}}} } \right)$$
 $${\rm E}_{{{\rm lact}}} {\,=\,}{\rm ECM }{\times}{\rm 3}.{\rm 14},{\rm E}_{{{\rm maint}}} {\,=\,}{\rm LW}^{{0.{\rm 75}}} {\times}{\rm }0.0{\rm 8 }{\times}{\rm }a,\atop\!\!\!\!\!\!\!\!\!\!\!\!\!\!\!\!\!\!{\rm E}_{{{\rm act}}} {\,=\,}{\rm LW}\,{\times}\,0.0{\rm 1}\,{\times}\,b$$
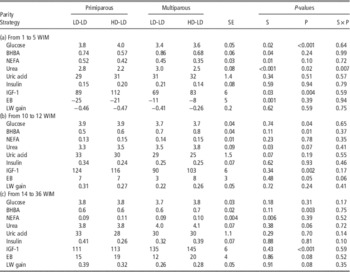
The Eintake is the total energy intake (MJ NEL/day, with 1 Scandinavian Feed Units=7.89 MJ NEL/kg, Strudsholm et al., Reference Strudsholm, Skovbo, Flye, Kjeldsen, Weisbjerg, Søegaard, Kristensen, Hvelplund and Hermansen1997). The Elact is the daily energy required for the milk production (MJ NEL/day) with ECM the energy corrected milk (kg ECM/day), and 3.14 the energy needed to produce 1 kg ECM (MJ NEL/kg ECM) (Sjaunja et al., Reference Sjaunja, Baevre, Junkkarinen, Pedersen and Setala1991). The Emaint is the daily energy required for maintenance (MJ NEL/day), where the maintenance requirement for NEL is set at 0.08 Mcal/kg LW0.75 (NRC, 2001), ‘a’ is the coefficient of conversion from Mcal to MJ, equal to 4.184, and LW is the live weight (kg/day). The Eact is the energy required for activity of loose housed cows (MJ NEL/day), 0.01 corresponds to the 10% activity for voluntary activity (MJ ME/kg) (NRC, 2001), and ‘b’ is the coefficient of conversion from ME to NEL, equal to 0.65. The energy used for growth was not included as it has been shown to be <1% of the energy output and only for the first and second parity (Friggens et al., Reference Friggens, Berg, Theilgaard, Korsgaard, Ingvartsen, Lovendahl and Jensen2007). The cows were not inseminated before 8 months of lactation so the energy for conception was not included in the calculation as the period studied was from calving to insemination. The EB calculated per period is shown in Table 3.
Plasma concentrations of glucose (mmol/l), BHBA (mmol/l), NEFA (mmol/l), urea (mmol/l), uric acid (μmol/l), insulin (ng/ml), IGF-1 (ng/ml), LW gain (kg/day) and energy balance (EB, MJ NEL/day) of Holstein cows in three periods; (a) before the shift, (b) after the shift, (c) further after the shift, according to strategy (LD-LD or HD-LD) and parity (primiparous or multiparous)Footnote 1

BHBA=beta-hydroxybutyrate; NEFA=non-esterified fatty acids; LD=lower energy density; HD=high energy density; LW=live weight; S=strategy; P=parity; WIM=weeks in milk.
LD-LD: strategy where Holstein cows were fed LD diet (60 : 40 forage : concentrate ratio).
HD-LD: strategy where Holstein cows were fed HD diet (50 : 50 ratio) followed by LD diet (60 : 40 ratio).
1 Least squares means (LS Means) values are presented.
Calculation of RQUICKI values
RQUICKI values were calculated to indicate insulin sensitivity:
 $${\rm RQUICKI}{\,=\,}{\rm 1}\,/\,\left( {{\rm log}\left( {{\rm Gl}} \right){\plus}{\rm log}\left( {{\rm In}} \right){\plus}{\rm log}\left( {{\rm NEFA}} \right)} \right)$$
where Gl represents the plasma concentration of glucose (mg/dl), In the plasma concentration of insulin (µU/ml), and NEFA the plasma concentration of NEFA (mmol/l) (Holtenius and Holtenius, Reference Holtenius and Holtenius2007).
Statistical analyses
As the cows shifted diet individually, the data were divided and analyzed separately for three different periods of the lactation, reflecting the shift in diet. The first period was from calving to 5 WIM before the shift in diet. The second period was right after the shift from 10 to 12 WIM. The third period was further after the shift from 14 to 36 WIM. The cows were randomly allocated to a given feeding strategy and sampled for blood several times during the lactation. The influence of the feeding strategy on the metabolites, hormones and production data (daily averages per cow), was analyzed applying a linear mixed-effects model before and after the shift:
 $$Y_{{ijkl}} {\,=\,}\mu {\plus}S_{i} {\plus}P_{j} {\plus}W_{k} {\plus}\left( {SP} \right)_{{ij}} {\plus}C_{{ijl}} {\plus}{\epsilon}_{{ijkl}} $$
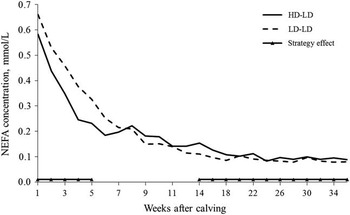
where µ is the overall mean within cows, the effects of the i th feeding strategy S (i=LD-LD, HD-LD), the j th parity P (j=primiparous, multiparous), and W is the k th WIM (k=1 to 36). The (SP) ij , denotes the two-factors interactions, C ijl is the random effect of the l th cow within i strategy and j parity, and ɛ ijkl is the random residual error. With R version 3.0.0, the LME function, from the NLME package (Pinheiro et al., Reference Pinheiro, Bates, DebRoy, Sarkar and Team2015), was used to fit the linear mixed-effects model (Laird and Ware, Reference Laird and Ware1982). The correlation over weeks within each cow was calculated with the temporal corAR1 function, representing an autocorrelation structure of order 1 (Pinheiro and Bates, Reference Pinheiro and Bates2000). For the three periods before and after the shift, the results are presented as LS means values for concentrations of metabolites, hormones, EB, and production data for each strategy and parity, indicating if these two factors had an effect on the variables (Table 3). An example of the NEFA graph is presented in Figure 2.
Evolution of the NEFA plasma concentration of Holstein cows, from week 1 to 36 after calving, for both feeding strategies (LD-LD dash line, HD-LD full line). Weeks in which the effect of the strategy is significant are indicated by the horizontal line on the graph (Strategy effect). LD-LD: strategy where Holstein cows were fed LD diet (60 : 40 forage : concentrate ratio). HD-LD: strategy where Holstein cows were fed HD diet (50 : 50 ratio) followed by LD diet (60 : 40 ratio). NEFA=non-esterified fatty acids; LD=lower energy density; HD=high energy density.

Simple correlations between EB, LW gain, NEFA, BHBA, glucose, urea, uric acid, insulin and IGF-1, were calculated at 3, 12 and 24 WIM, using the Pearson’s method.
Results
Metabolites in blood plasma
From 1 to 5 WIM
Before the shift in diet, the strategy had an effect on plasma glucose, BHBA, NEFA, and urea concentrations. The HD-LD cows had higher concentrations of glucose than the LD-LD cows. From 1 to 2 WIM, glucose decreased and then slightly increased for both strategies until WIM 5. The BHBA and NEFA concentrations were lower for the HD-LD cows. From 1 to 5 WIM, NEFA decreased. For BHBA, the concentrations were not influenced by the week. Urea was lower for the HD-LD multiparous cows but there was no effect of strategy on primiparous cows. Concentrations of urea were higher and stable for the LD-LD cows compared with the HD-LD cows, in which a decrease of the urea concentration occurred from 1 to 2 WIM followed by an increase until 4 WIM. Uric acid was not influenced by the strategy, but changes occurred over weeks of lactation: the concentration dropped from 2 to 3 WIM from around 34 to 29 μM. Regarding parity, the primiparous had a lower concentration of urea but a higher concentration of glucose than the multiparous. No other effect of parity was found (Table 3).
From 10 to 12 WIM
After the shift in diet for the HD-LD cows, the concentrations of glucose, BHBA, and urea were not different between strategies (Table 3). The NEFA concentrations decreased over WIM and were numerically higher for the HD-LD cows than the LD-LD cows, but the difference was not significant. The HD-LD compared with LD-LD cows tended to have a higher concentration of uric acid. Parity influenced the concentrations of glucose and tended to affect urea; the primiparous having numerically higher concentrations of glucose and lower concentrations of urea than the multiparous.
From 14 to 36 WIM
A few weeks after the shift in diet, some changes appeared in metabolite concentrations. The glucose concentration was numerically higher for the HD-LD cows compared with the LD-LD cows. The glucose concentration increased with DIM for both strategies. The concentrations of BHBA were only influenced by parity; the multiparous cows had higher concentrations than the primiparous cows. Numerically, the NEFA concentrations were similar to the previous period, but in this period, the strategy had an effect on NEFA concentrations, as the HD-LD cows had a higher concentration of NEFA than the LD-LD cows. Moreover, NEFA concentrations decreased for both strategies until week 22, and were then low (<0.1 mmol/l) and stable until 36 weeks. Urea tended to be higher for the multiparous compared with the primiparous, and the concentration increased with DIM. Finally, uric acid was not affected by parity, week, or strategy (Table 3).
Hormones
Insulin and IGF-1
The insulin concentration increased with time, from 5 to 24 WIM (P<0.002) but was not affected by strategy or parity. Nevertheless, at 3 WIM, the multiparous LD-LD cows had a numerically higher insulin concentration than the multiparous HD-LD cows or the primiparous from both strategies (0.5 ng/ml for the multiparous LD-LD v.<0.15 ng/ml for the other). The same observation was made for week 24, where the primiparous LD-LD cows also had a higher concentration than the primiparous HD-LD cows. The IGF-1 increased over time until week 24 (P<0.001). Before the shift from 1 to 3 WIM, the HD-LD cows had a higher concentration of IGF-1 than the LD-LD cows, but after the shift from 12 to 24 WIM, the strategy had no effect. Parity also influenced IGF-1. The primiparous had higher concentrations of IGF-1 than the multiparous.
RQUICKI
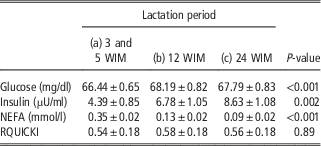
Table 4 shows the means values of glucose, insulin, NEFA and RQUICKI. The period had an effect on the plasma concentrations of glucose, insulin and NEFA, but had no effect on RQUICKI values. The strategy (P=0.23) and parity (P=0.63) had no effect on RQUICKI. The Pearson correlation between BCS and RQUICKI was negative (r=−0.23, P<0.002), showing that RQUICKI increased with decreased BCS.
RQUICKI values for the three periods studied; (a) before the shift, (b) after the shift, and (c) further after the shift; and P-values showing the effects of lactation period (Means±SE)

NEFA=non-esterified fatty acids; WIM=weeks in milk.
Energy balance and indicators of energy balance
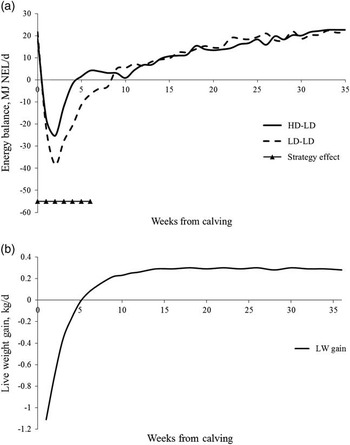
The EB was not influenced by parity during the periods studied (Table 3). From calving to 5 WIM, the EB was negative, and was more negative for the LD-LD cows than for the HD-LD cows (P=0.001). From 10 to 12 WIM, the EB was not influenced by the feeding strategy anymore, and was positive. From 14 to 36 WIM the EB kept being positive for all the cows (Table 3, Figure 3a). The LW characteristics of the cows regarding the parity are shown in Table 2. The LW gain, calculated by deriving the LW equations of the Wilmink model, was not influenced by strategy (P=0.71) or the parity (P=0.42) (Table 3). It increased with time, starting to be negative from calving until around WIM 5, which defines the mobilization period. Then it was kept positive and stable, while the cows entered the deposition period (Figure 3b).
(a) Energy balance (MJ NEL/day) of Hostein cows regarding feeding strategies (LD-LD dash line, HD-LD full line). Weeks in which the effect of the strategy is significant are indicated by the horizontal line on the graph (Strategy effect). (b) Average live weight gain (kg/day) of Holstein cows regarding the week after calving. There was no effect of strategy or parity on live weight and live weight gain. LD-LD: strategy where Holstein cows were fed LD diet (60 : 40 forage : concentrate ratio). HD-LD: strategy where Holstein cows were fed HD diet (50 : 50 ratio) followed by LD diet (60 : 40 ratio). LD=lower energy density; HD=high energy density.

At week 3, NEFA and BHBA were negatively correlated with the LW gain (r=−0.38, P<0.002 and r=−0.34, P<0.006, respectively), while the EB was correlated with glucose (r=0.40, P<0.001), NEFA (r=−0.53, P<0.001), BHBA (r=−0.32, P=0.01), insulin (r=0.39, P=0.02), and IGF-1 (r=0.25, P=0.05). At week 3, the EB and LW gain were positively correlated (r=0.40, P=0.001). At week 12, the LW gain was positively correlated with glucose and IGF-1 (r=0.36, P=0.003, and r=0.35, P=0.004, respectively) while EB was correlated with urea and insulin (r=0.45, P<0.001, and r=0.33, P=0.01, respectively). At week 12, there was no correlation between the EB and LWG (r=−0.08, P=0.52). At week 24, the LW gain was positively correlated with IGF-1 and insulin (r=0.23, P=0.06, and r=0.32, P=0.01, respectively) while the EB was correlated with the BHBA (r=−0.29, P=0.03). The EB and LW gain were positively correlated at week 24 (r=0.31, P=0.02).
Sum milk yield, sum feed intake and mean BCS
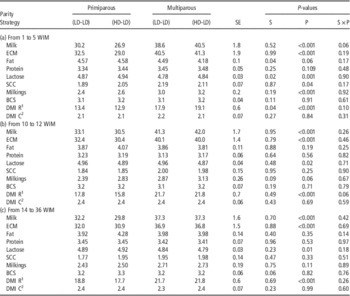
The feeding strategy had no effect on the averages ECM, and DMI of concentrates (DMI C) in milking robot, for the three periods studied from 0 to 36 WIM (Table 3). The DMI R intake (partially mixed ration without the concentrates at the milking robot) of LD or HD was different from 0 to 42 days between LD-LD and HD-LD cows (15.6 v. 16.0 kg DM/day, respectively) but this difference was quite small; 0.38±0.49 kg DM/day higher for the HD-LD cows. The primiparous had lower LD or HD intake and ECM than the multiparous (P<0.001), but similar DMI of concentrates and BCS (Table 5).
Milk yield (kg/day), fat in milk (%), protein in milk (%), lactose in milk (%), cells in milk (log(cells)), ECM (kg ECM/day), milking frequency (Milkings/day), BCS, and DMI (kg DM/day) of Holstein cows for three periods (WIM) (a) before the shift, (b) after the shift, (c) further after the shift, regarding strategy (LD-LD or HD-LD) and parity (primiparous or multiparous)

LD=lower energy density; HD=high energy density; S=strategy; P=parity; DMI R1=DMI of the partially mixed rations (LD and HD); DMI C2=DMI of the concentrates at the milking robot; WIM=weeks in milk; SCC=somatic cell counts.
LD-LD: strategy where Holstein cows were fed LD diet (60 : 40 forage : concentrate ratio).
HD-LD: strategy where Holstein cows were fed HD diet (50 : 50 ratio) followed by LD diet (60 : 40 ratio).
Discussion
Early lactation
During early lactation, plasma glucose was higher, and NEFA and BHBA were lower for the HD-LD cows compared with the LD-LD cows, when the HD-LD cows were fed a high energy diet. Moreover, correlations were found between LW gain and NEFA as well as BHBA. These results confirmed our first hypothesis indicating that the HD diet reduced the magnitude of negative energy balance in early lactation. Results from previous studies on the effect of increasing the amount of concentrate in early lactation are in accordance with ours. Cows fed a high energy diet by increasing the amount of concentrates in the ration had a higher concentration of plasma glucose (Jenny and Polan, Reference Jenny and Polan1975; Sutton et al., Reference Sutton, Hart, Broster, Elliott and Schuller1986) and a lower concentration of plasma BHBA (Andersen et al., Reference Andersen, Larsen, Nielsen and Ingvartsen2004) and NEFA (Dhiman et al., Reference Dhiman, Kleinmans, Tessmann, Radloff, Vanevert and Satter1991; Nachtomi et al., Reference Nachtomi, Halevi, Bruckental and Amir1991) than cows fed a diet lower in energy. Increased energy intake by supplementing diets with glycerol or propylene glycol increased plasma glucose and decreased NEFA and BHBA as well (Lomander et al., Reference Lomander, Frossling, Ingvartsen, Gustafsson and Svensson2012). These results confirm that the energy balance can be improved by feeding an energy-enriched diet in early lactation. In addition, our results indicated that HD-LD cows had lower plasma concentrations of urea compared with LD-LD cows. One explanation is that this result suggests a smaller protein mobilization and oxidation as previously found (Cucunubo et al., Reference Cucunubo, Strieder-Barboza, Wittwer and Noro2013). The multiparous had higher urea concentrations than the primiparous. Another study found no effect of parity on urea, but that urea was low at the beginning of the lactation and then increased (Dhiman et al., Reference Dhiman, Kleinmans, Tessmann, Radloff, Vanevert and Satter1991). Finally, in early lactation, we found that the primiparous had higher concentrations of glucose than the multiparous in accordance with Dhiman et al. (Reference Dhiman, Kleinmans, Tessmann, Radloff, Vanevert and Satter1991).
After the shift
After the shift from 10 to 36 WIM, it was expected that the concentrations of BHBA and NEFA for the HD-LD cows would still be similar or higher than those of the LD-LD cows the first week after the shift and then similar, as the cows recovered from the shift. However, from 10 to 12 WIM, there were no statistical differences between the strategies, while from 14 WIM, NEFA concentrations were higher for the HD-LD cows compared with the LD-LD cows. Even so, by looking closely at the differences in NEFA concentrations between the LD-LD cows and the HD-LD cows we found that they were numerically similar from 10 to 12 WIM and from 14 to 36 WIM (the difference between LD-LD and HD-LD cows equals 0.015 mmol/l for both intervals). However, for both LD-LD and HD-LD cows, the variation among the cows at 10 to 12 WIM was larger compared with 14 to 36 WIM (SEM=0.01 and 0.004 mmol/l, respectively) explaining the non-significance of the difference between the LD-LD and HD-LD cows from 10 to 12 WIM (Table 3). The HD-LD cows were not shifted from HD to LD on the same day and, consequently, the adaptation to the new feeding strategy and the duration of the mobilization period of each cow were different, which induced a metabolic variation among the cows. These results are in accordance with Kessel et al. (Reference Kessel, Stroehl, Meyer, Hiss, Sauerwein, Schwarz and Bruckmaier2008), where it was indicated that the changes of metabolites and hormones concentrations differ among animals depending on their ability to cope with their metabolic stress.
Our results from 10 to 12 WIM are in accordance with other results. In a previous study, some cows were restricted for 4 days, and the metabolic changes occurred during these restriction days. Then the cows were shifted back to the standard TMR diet ad libitum, and 1 week after, there were no metabolic differences between the groups (Bjerre-Harpoth et al., Reference Bjerre-Harpoth, Friggens, Thorup, Larsen, Damgaard, Ingvartsen and Moyes2012). This result is similar to our result, where metabolic changes were detected during the shift period, but not 1 week after the last cow had been shifted to the control diet (from 10 to 12 WIM). This could indicate that the cows needed at least one week to adjust to the change of diet. The general decline in NEFA during the lactation period in our experiment can be related to a decrease in milk synthesis and rates of lipolysis, as well as an increase of re-esterification of fatty acids (Ronge et al., Reference Ronge, Blum, Clement, Jans, Leuenberger and Binder1988). This decrease in plasma NEFA is in accordance with some previous work (Marett et al., Reference Marett, Auldist, Grainger, Wales, Blache, Macmillan and Leury2011).
From 14 to 36 WIM, the HD-LD cows had higher NEFA concentration compared to the LD-LD cows. The same pattern was found for cows fed ad libitum before parturition and then fed restrictively according to requirements after calving (Kunz et al., Reference Kunz, Blum, Hart, Bickel and Landis1985). These cows had higher concentrations of NEFA after parturition than cows fed the same restricted diet before and after parturition and indicated an increase in ketone bodies (Kunz et al., Reference Kunz, Blum, Hart, Bickel and Landis1985). This could indicate a difference of ability between the HD-LD cows and the LD-LD cows to maintain extended lactation. It has previously been shown that the concentrations of growth hormone, IGF-1 and NEFA in the late stage of extended lactation can give information about the persistency of the lactation of a cow and indicate its ability to maintain lactation (Marett et al., Reference Marett, Auldist, Grainger, Wales, Blache, Macmillan and Leury2011). Plasma NEFA have previously been used as an indication of increased adipose tissue mobilization through lipolysis (McNamara and Hillers, Reference McNamara and Hillers1986) and cows with high concentrations of NEFA could have a better persistency than cows with lower NEFA concentrations (Kay et al., Reference Kay, Phyn, Roche and Kolver2009). However, Marett et al. (Reference Marett, Auldist, Grainger, Wales, Blache, Macmillan and Leury2011) found no evidence of this, maybe because all the cows in their study were in a positive energy balance or because the differences were too small to be detected.
Hormones
Insulin was not affected by feeding strategy but increased over the time in accordance with previous results. Similarly, Sorensen and Knight (Reference Sorensen and Knight2002) found that insulin was unaffected by nutrition (one group fed 3 kg extra concentrates compared to another group). A low plasma insulin concentration reduces glucose uptake by the muscles and the adipose tissue and consequently saves glucose for uptake by the mammary gland (van Knegsel et al., Reference van Knegsel, van den Brand, Dijkstra, van Straalen, Jorritsma, Tamminga and Kemp2007). With low concentrations of insulin, the secretion of the hormone-sensitive lipase is stimulated, increasing lipolysis with the subsequent release of NEFA to the bloodstream (Melendez et al., Reference Melendez, Marin, Robles, Rios, Duchens and Archbald2009). According to Staples et al. (Reference Staples, Burke and Thatcher1998), plasma insulin concentrations reflect the energy intake. In our study, insulin is not reflecting energy intake in early lactation, but this may be the case later in lactation. This finding in early lactation could indicate a resistance to insulin indicated by a reduced insulin responsiveness during this period (Bell and Bauman, Reference Bell and Bauman1997; Sinclair, Reference Sinclair2010). As previously found by Holtenius and Holtenius (Reference Holtenius and Holtenius2007), plasma components vary over the periods but not the RQUICKI index, so it seems a good indicator to identify changes in insulin sensitivity for these cows. Moreover, we found a correlation between BCS and RQUICKI, in accordance with Holtenius et al. (Reference Holtenius, Agenas, Delavaud and Chilliard2003) suggesting that cows with high BCS should have a lower RQUICKI and be more insulin resistant than the thin cows (Holtenius et al., Reference Holtenius, Agenas, Delavaud and Chilliard2003). Our RQUICKI values were not affected by the period of the lactation. However, the RQUICKI was lower in the first weeks of lactation than later around 36 weeks (0.54 and 0.56±0.18, respectively) which supports our hypothesis of insulin resistance.
As lactation progressed IGF-1 tended to increase, which has also been found in many other studies (Sorensen and Knight, Reference Sorensen and Knight2002; Marett et al., Reference Marett, Auldist, Grainger, Wales, Blache, Macmillan and Leury2011). In early lactation, it has been shown that cows fed a high energy diet had higher plasma IGF-1 concentrations than cows fed a low energy diet (Andersen et al., Reference Andersen, Friggens, Larsen, Vestergaard and Ingvartsen2002; Andersen et al., Reference Andersen, Larsen, Nielsen and Ingvartsen2004). This is in accordance with our results as IGF-1 for the HD-LD cows was higher than for the LD-LD cows at least until five WIM. Finally, we found that the primiparous cows had higher concentrations of IGF-1 than the multiparous cows while another study found no effect of parity on IGF-1 (Kang et al., Reference Kang, Kim, Kim, Han, Lee, Imm, Oh, Park, Moon and Kim2007).
LW gain, NEFA, and BHBA, relevant indicators of energy balance
In early lactation, the LW gain is positively correlated with the EB. Both are correlated with NEFA and BHBA, which points out that the negative energy balance, or the loss of weight, is related with an increase in NEFA and BHBA concentrations indicating an increase of mobilization. Thus, the LW gain, NEFA and BHBA are good indicators of EB in early lactation. This result has been established previously like in Kessel et al. (Reference Kessel, Stroehl, Meyer, Hiss, Sauerwein, Schwarz and Bruckmaier2008), where the concentrations of BHBA were chosen as the single best indicator of energy balance. The inexistent correlation between LW gain and EB right after the shift period may indicate that the model used to describe the LW data may not be the most accurate tool to characterize the adaptive capability of the cows, as the variation in LW measures within and between individuals is high during this period. Moreover, the lack of correlations between LW gain and the metabolites could also indicate a delay between the metabolic response and the LW gain response, as the change in diet induced a change in metabolite concentrations, which was later seen as LW gain changes. Further after the shift, from 14 to 36 WIM, the positive correlation between LW gain and EB is restaured. Even so we found an effect of the feeding strategy on the NEFA concentration, there was no correlation between this metabolite and EB or LW gain. The differences in NEFA concentrations between the groups might be too small to traduce an effect on the LW gain or EB.
Conclusions
The aim was to study the effects of an individualized live weight adjusted feeding strategy on plasma indicators of energy balance in Holstein cows managed for extended lactation. From calving to 5 weeks after calving, the energy-enriched diet reduced the negative energy balance of HD-LD cows indicating a reduced mobilization of HD-LD cows compared with LD-LD cows. The energy-enriched diet in early lactation had some carry-over effects in later lactation metabolism, from 14 to 36 WIM. The LW gain is highly related to energy balance in early lactation and in mid-lactation. Nevertheless, the LW gain was unable to detect small changes in energy induced by diets. In this case, metabolites such as BHBA and NEFA are better indicators of energy balance. To conclude, these results indicate that the HD-LD strategy with an increased dietary energy concentration in early lactation followed by an individually managed reduction in dietary energy concentration at weight nadir reduces the magnitude of the mobilization during early lactation, slightly sustain the mobilization for a longer period of time, and induces metabolic changes in later lactational stages. Moreover, the individual feeding adjustment in early lactation managed using the live weight data can be improved by measuring weekly plasma BHBA, NEFA, and glucose.
Acknowledgments
The authors wish to thank The Danish Council for Strategic Research, The Programme Commission on Health, Food and Welfare for the financial support of this experiment, and Novo Nordisk A/S for supplying one of the two antibodies used in the IGF-1 assay. They acknowledge the staff at the Danish Cattle Research Centre for their highly committed effort to run the experiment as well as the team involved in the blood samples, technician Torkild Nyholm Jakobsen, and master students Jo Depandelaere, Jibon Basar, and Hélène Barbu. They acknowledge the technicians Connie H. Middelhede and Martin Bjerring for their effective efforts to bring about data as well as Carsten Berthelsen and Kasper Bøgild Poulsen for their efficiency and quality work on the laboratory analyses.