Introduction
In a recent paper we described nematode distributions at Cape Hallett and Gondwana Station, Antarctica (Raymond et al. Reference Raymond, Wharton and Marshall2013). Four species were found: Panagrolaimus davidi Timm, Scottnema lindsayae Timm, Eudorylaimus sp. and Plectus sp. In this paper we describe morphological and genetic studies that determine species or genus identity and relationships.
There are 57 species of Antarctic nematodes (all endemic) of which 25 are from continental Antarctica (Andrassy Reference Andrassy2008a, Kito & Ohyama Reference Kito and Ohyama2008). Identification using morphological characters has often been problematic, as illustrated by Antarctic Eudorylaimus species. Andrassy recently identified two new species and clarified some past misidentifications (Andrassy Reference Andrassy2008a). As more specimens become available, variation initially ascribed to population-level differences has led to two additional Eudorylaimus morphospecies being described: E. glacialis Andrassy and E. quintus Andrassy (Andrassy Reference Andrassy2008a).
The 18S rRNA gene has been widely used for the identification of nematode species, construction of phylogenies and for barcoding (Floyd et al. Reference Floyd, Abebe, Papert and Blaxter2002). This gene has some highly conserved regions facilitating primer design, but enough variation to make it useful for taxonomy (Blaxter et al. Reference Blaxter, De Ley, Garey, Liu, Scheldeman, Vierstraete, Vanfleteren, Mackey, Dorris, Frisse, Vida and Thomas1998, Powers Reference Powers2004). Primers have been developed that amplify ∼1 kb of 18S sequence specifically from nematodes, reducing contamination problems (Floyd et al. Reference Floyd, Rogers, Lambshead and Smith2005). 18S sequences have been used to build a number of nematode phylogenies that have led to significant improvements in our understanding of this phylum (Blaxter et al. Reference Blaxter, De Ley, Garey, Liu, Scheldeman, Vierstraete, Vanfleteren, Mackey, Dorris, Frisse, Vida and Thomas1998).
Genetic data are used in phylogeographical studies to give insight into the historic processes that explain current geographical distributions. In terrestrial Antarctica, phylogeographical studies have the potential to help explain the relative roles of vicariance and dispersal in the evolution of the extant fauna, add to, or contest, the geological evidence for the extent of historical glaciation events, and give a time-frame for the evolution of the observed physiological adaptations of the fauna.
There are few phylogeographical studies on Antarctic nematodes. Courtright et al. (Reference Courtright, Wall, Virginia, Frisse, Vida and Thomas2000) applied a phylogeographical approach to populations of S. lindsayae in the McMurdo Dry Valleys and Adams et al. (Reference Adams, Wall, Gozel, Dillman, Chaston and Hogg2007) reported no differences in ITS1 region sequences between S. lindsayae from the McMurdo Dry Valleys and from the Beardmore Glacier, which are 700 km apart. Studies on E. antarcticus (Steiner) populations suggest that there are at least three cryptic species (Barrett et al. Reference Barrett, Virginia, Wall, Cary, Adams, Hacker and Aislabie2006).
A study employing 18S sequences from various Panagrolaimus species and strains suggests that P. davidi (CB1 culture strain) is a recent colonizer of Antarctica (Lewis et al. Reference Lewis, Dyal, Hilburn, Weitz, Liau, LaMunyon and Denver2009). We investigate this further by sequencing genes from field populations of P. davidi. We also investigated the phylogenetics of species from Cape Hallett and Gondwana Station that have previously only been morphologically defined. Before applying molecular techniques it was important to confirm that the species match current morphological descriptions. The 18S and D3 genes were sequenced. Together with morphological measurements and images, these provide an identification for each species. This analysis also provides an opportunity to identify any cryptic species.
Materials and methods
Sample sources
Nematodes were isolated from soil samples collected as part of a study of the distribution of nematodes in the Cape Hallett and Gondwana Station areas (Victoria Land coast, Antarctica). For site details and extraction methods see Raymond et al. (Reference Raymond, Wharton and Marshall2013). An additional soil sample was obtained from the Adélie penguin colony at Cape Bird, Ross Island (collected by J. Banks). Laboratory cultures of Panagrolaimus davidi isolated from Ross Island in 1988 (Wharton & Brown, Reference Wharton and Brown1989) and later designated as strain CB1 (Lewis et al. Reference Lewis, Dyal, Hilburn, Weitz, Liau, LaMunyon and Denver2009) were grown in liquid culture (Wharton et al. Reference Wharton, Judge and Worland2000).
Nematode preparation and morphological measurements
Nematodes were fixed using hot formalin/acetic acid fixative, identified to species level under a dissecting microscope, processed into glycerol by the Seinhorst method and permanent mounts prepared using the wax-ring method (Hooper Reference Hooper1986a). Slides were observed on a Zeiss Axiophot photomicroscope and images captured using a Canon Powershot A640 digital camera. Measurements were made using the image processing program Image J vers. 1.38x (http://rsb.info.nih.gov/ij/) and de Man ratios calculated (Hooper Reference Hooper1986b). Morphological measurements were compared with those from published descriptions for Scottnema lindsayae, Panagrolaimus davidi, Plectus murrayi Yeates 1970 and Eudorylaimus spp. (Timm Reference Timm1971, Andrassy Reference Andrassy1998, Reference Andrassy2008a).
DNA extraction and sequencing
DNA was extracted from live nematodes as described by Floyd et al. (Reference Floyd, Abebe, Papert and Blaxter2002). Individual nematodes were identified to species level and transferred to 0.2 ml PCR (polymerase chain reaction) tubes containing 20 μl of 0.25 M NaOH. Each tube was then centrifuged briefly to ensure submersion of the nematode and stored at -80°C. Tubes were incubated at 25°C for 3–5 h, heated in a thermocycler (Eppendorf Mastercycler Gradient, Eppendorf, Hamburg, Germany) to 95°C for 3 min and allowed to cool to room temperature before the addition of 4 μl of 1 M HCl, 10 μl of 0.5 M Tris-HCl (pH 8.0) and 5 μl of 2% Triton X-100. The samples were mixed briefly and centrifuged. They were then reheated to 95°C for 3 min and allowed to cool to room temperature. This digest was used directly in the PCR reactions as template DNA (Floyd et al. Reference Floyd, Abebe, Papert and Blaxter2002).
Nematode-specific primers for the nuclear 18S small subunit (SSU) ribosomal RNA gene have been successfully employed for a large range of nematode species (Blaxter et al. Reference Blaxter, Mann, Chapman, Thomas, Whitton, Floyd and Abebe2005, Floyd et al. Reference Floyd, Rogers, Lambshead and Smith2005). Primers Nem_18S_F 5′- CGCGAATRGCTCATTACAACAGC-3′ and Nem_18S_R 5′- GGCGATCAGATACCGCCC-3′ (Floyd et al. Reference Floyd, Rogers, Lambshead and Smith2005) were used to amplify an internal fragment of around 900 bp of 18S.
The nuclear D3 expansion segment of the 28S large subunit (LSU) rRNA gene and approximately 140 bp of 3′ core sequence have successfully been amplified in a range of nematode species using two primers situated in conservative flanking regions: D3A 5′- GACCCGTCTTGAAACACGGA-3′ and D3B 5′-TCGGAAGGAACCAGCTACTA- 3′ (Nunn et al. Reference Nunn, Theisen, Christensen and Arctander1996, Shannon et al. Reference Shannon, Browne, Boyd, Fitzpatrick and Burnell2005). These primers have previously been used on Eudorylaimus sp. (Barrett et al. Reference Barrett, Virginia, Wall, Cary, Adams, Hacker and Aislabie2006) and P. davidi CB1 (Shannon et al. Reference Shannon, Browne, Boyd, Fitzpatrick and Burnell2005) and were therefore used in this study. All primers were ordered online from Sigma Aldrich (www.sigmaaldrich.com).
The desired D3 PCR product of about 320 bp was reliably amplified in suitable quantities, resulting in good quality sequences. The D3 PCR products were therefore only sequenced using the forward primers. Sequences were aligned and trimmed to equal length, giving a sequence length of 275 bp without gaps.
Polymerase Chain Reaction (PCR) amplifications were carried out in a thermocycler with the following conditions: 1 cycle of 2 min at 94°C, 40 cycles of: 15 s at 94°C, 30 s at 45°C and 2 min at 72°C, and 1 cycle of 2 min at 72°C. All PCR reactions were carried out in 50 μl volumes containing 1 unit of 1U/μl BIOTAQTM red DNA polymerase (Bioline), 5 μl of 10x NH4 Buffer (Bioline), 5 μl of 50 mM MgCl2, 1.2 μl of 100 mM dNTP, 5 pmol of each primer and 3–5 μl genomic DNA from single nematode extractions. The volume was then made up to 50 μl with sterile distilled water.
The presence and size of the amplification products were checked by electrophoresis on 1% agarose gels stained with Sybr Safe (Invitrogen). PCR amplification products were purified using a High Pure PCR Purification Kit (Roche Diagnostics GmbH). The DNA concentration of the clean product was determined with an ND-1000 spectrophotometer (NanoDrop Technologies Inc.) and samples were sent to the Allan Wilson Centre Genomic Services (www.allanwilsoncentre.ac.nz) for cycle sequencing and scanning.
Alignment and phylogenetic analyses
Sequence alignment and phylogenetic analyses were performed with MEGA4 (Tamura et al. Reference Tamura, Dudley, Nei and Kumar2007). For all sequences, sequencer files were checked for errors and any primer sequences removed. For the 18S sequences, alignment was performed in the ClustalW function of MEGA4, using the nematode 18S sequence alignment dataset available from Blaxter as a reference (Blaxter Reference Blaxter1998). This alignment had been created by hand with respect to a secondary structure model (Blaxter et al. Reference Blaxter, De Ley, Garey, Liu, Scheldeman, Vierstraete, Vanfleteren, Mackey, Dorris, Frisse, Vida and Thomas1998). For the D3 sequences, alignments were also done using ClustalW, with gap opening penalties set at 15 and gap extension penalties at 6.66 (Tamura et al. Reference Tamura, Dudley, Nei and Kumar2007). Alignments were then checked through visually and minor manual adjustments were made before the alignments were trimmed to the same length.
Maximum parsimony (MP) and neighbour joining (NJ) phylogenetic analyses were performed on both sequence alignments using MEGA4 (Tamura et al. Reference Tamura, Dudley, Nei and Kumar2007). For both MP and NJ analyses, bootstrap consensus trees were computed with 1000 bootstrap replicates.
Results
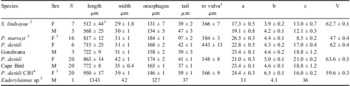
Morphological measurements and de Man ratios of Scottnema lindsayae, Panagrolaimus davidi, Plectus murrayi and Eudorylaimus sp. are summarized in Table I. This table also compares P. davidi from Gondwana with fresh material from Cape Bird and with the culture strain, P. davidi CB1.
Measurements and de Man ratios for Antarctic nematodes from Gondawana Station, Cape Bird and laboratory culture.

1mean ± SE, 2Gondwana Station, 3only females found, 4laboratory culture strain, 5distance from anterior to vulva
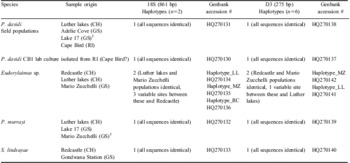
The rDNA small subunit (18S) and the D3 expansion region of the 28S rDNA subunit genes were successfully amplified and sequenced from the four species. For each species, two (18S) and six (D3) individuals from each of two geographically distinct populations (Cape Hallett and Gondwana Station) were sequenced. A third population of P. davidi from Cape Bird, Ross Island was sequenced, as was the laboratory strain P. davidi CB1 (Table II).
Origin of nematodes and results of 18S and D3 sequencing of Antarctic nematodes.

1D3 sequence only, CH = Cape Hallett area, GS = Gondwana Station area, RI = Ross Island.
Two haplotypes were identified for Eudorylaimus sp. 18S sequences: the two individuals from the Redcastle population had different sequences to those from Luther lakes (unofficial name) and Mario Zucchelli Station, with three variable sites in the sequences. There was one variable site in the 275 bp D3 sequence between populations of Eudorylaimus sp. The D3 sequences of Redcastle and Mario Zucchelli Station individuals were identical to each other but different to those from Luther lakes. This pattern was the same for all six individuals from each of the three populations.
Whereas all individuals from the three (18S) or four (D3) field P. davidi populations had identical 18S and D3 sequences, large differences were identified between these sequences and those from P. davidi CB1. In an alignment of 18S sequences between a representative individual from a field population and one from P. davidi CB1, 81 out of 861 sites were different (9.4%). D3 sequences from field populations varied at 30 sites (10.5%) when aligned to those of P. davidi CB1.
A tree inferred using a 1000 bootstrap replicate neighbour-joining model groups the species into the same five main clades as in the study of Blaxter et al. (Reference Blaxter, De Ley, Garey, Liu, Scheldeman, Vierstraete, Vanfleteren, Mackey, Dorris, Frisse, Vida and Thomas1998), with the Antarctic species from this study representing different major lineages (Fig. S1 which will be found at http://dx.doi.org/10.1017/S0954102013000230).
Discussion
Morphological measurements
Identifications of Scottnema lindsayae, Panagrolaimus davidi, Plectus murrayi and Eudorylaimus sp. were confirmed by reference to published descriptions. The original species descriptions are from the McMurdo Sound area, and this study supports observations that their range extends over the Victoria Land coast (Adams et al. Reference Adams, Bardgett, Ayres, Wall, Aislabie, Bamforth, Bargagli, Cary, Cavacini, Connell, Convey, Fell, Frati, Hogg, Newsham, O'Donnell, Russell, Seppelt and Stevens2006).
Gondwana Station (GS) S. lindsayae were considerably shorter than those from populations near Lacroix Glacier and the Strand Moraines (Timm Reference Timm1971). However, the de Man ratios are similar, and the GS individuals are within the range of reported ‘a’ values. Our GS specimens match Andrassy's description (Andrassy Reference Andrassy1998) better than the original species description (Timm Reference Timm1971), and the GS de Man indices are within reported ranges (Andrassy Reference Andrassy1998, Boström et al. Reference Boström, Holovachov and Nadler2011), although some are a little shorter in length. This suggests that there can be considerable variation in the body length of S. lindsayae individuals, which may be an age effect rather than a population-level difference.
Plectus antarcticus de Mann (Timm Reference Timm1971) has been renamed Plectus murrayi by authors who consider that P. antarcticus is found in the maritime Antarctic only (Andrassy Reference Andrassy1998, Convey et al. Reference Convey, Gibson, Hillenbrand, Hodgson, Pugh, Smellie and Stevens2008, Maslen & Convey Reference Maslen and Convey2006). The GS specimens are within the range of reported measurements. No males were found, consistent with their rarity (Andrassy Reference Andrassy2008b). Plectus frigophilus Kirjanova is the other Plectus species found in Victoria Land, being much larger than P. murrayi and preferring more aquatic habitats (Andrassy Reference Andrassy1998). We did not distinguish between P. murrayi and P. frigophilus but our specimens appear to all belong to the same species (confirmed by genetic studies below). Yeates et al. (Reference Yeates, Scott, Chown and Sinclair2009) considered that Plectus sp. collected from Cape Hallett were P. murrayi. We conclude that the Plectus that we collected are P. murrayi also.
Field samples of Panagrolaimus davidi from Cape Bird, have been compared to P. davidi CB1 from laboratory cultures (Wharton Reference Wharton1998). The culture was originally isolated from Ross Island. The strain designation (CB1) presumes its origin is Cape Bird but material was also collected from Cape Royds and Crater Hill (Wharton & Brown Reference Wharton and Brown1989). This nematode has been maintained in culture since November 1988 (Wharton & Brown Reference Wharton and Brown1989). Gondwana Station individuals are considerably shorter in length than the species description (Timm Reference Timm1971), but the de Man indices are all within the range reported in the literature (Wharton Reference Wharton1998). There are significant differences between all measurements from the field-collected P. davidi and P. davidi CB1, which also had a longer and more pointed tail. The most obvious difference was the lack of males in P. davidi CB1 and no males have been observed since the culture was established (Wharton Reference Wharton1998). Gondwana Station individuals are closer in morphology to those from wild populations than to P. davidi CB1. The characteristic dorsal metastomal tooth of P. davidi was observed in both males and females of the GS population, and in P. davidi CB1 strain.
Among Antarctic Eudorylaimus species, E. glacialis, E. shirasei Kito, Shishida & Ohyama and E. antarcticus have been described from Victoria Land (Adams et al. Reference Adams, Bardgett, Ayres, Wall, Aislabie, Bamforth, Bargagli, Cary, Cavacini, Connell, Convey, Fell, Frati, Hogg, Newsham, O'Donnell, Russell, Seppelt and Stevens2006). Eudorylaimus sp. was the least abundant species in GS soils (Raymond et al. Reference Raymond, Wharton and Marshall2013). Few Eudorylaimus individuals are found in surveys and species descriptions are based on very few individuals (Andrassy Reference Andrassy2008a). In our study, morphological measurements were carried out on a single GS male and we did not have enough material to identify to species level.
Molecular diagnostics for Antarctic nematode taxonomy
The 18S gene is used as a genetic barcode for nematodes and individuals from the same species are expected to have identical 18S sequences (Floyd et al. Reference Floyd, Abebe, Papert and Blaxter2002). For S. lindsayae, P. murrayi and P. davidi individuals from field populations identified morphologically as the same species had identical 18S and D3 sequences across populations.
The level of difference at both the 18S and D3 gene loci strongly indicates that P. davidi CB1 is a different species from that of field populations of P. davidi. The morphological comparisons of P. davidi field strains and P. davidi CB1 show differences that had previously been considered insignificant (Wharton Reference Wharton1998), may now clearly be of importance in distinguishing these two species. However, they have a very similar appearance, including the presence of the dorsal metastomal tooth that distinguishes P. davidi from P. magnivulvatus Boström (Boström Reference Boström1995), the other Panagrolaimus species endemic to continental Antarctica (Andrassy Reference Andrassy1998). The two species designated as P. davidi are thus different species best distinguished by molecular techniques. The only other species of Panagrolaimus known to possess a dorsal metastomal tooth is P. superbus Fuchs (De Ley et al. Reference De Ley, Van de Velde, Mounport, Baujard and Coomans1995, Eyualem & Blaxter Reference Eyualem and Blaxter2003), which is considered to be almost morphologically identical to P. davidi (Abolafia & Pena-Santiago Reference Abolafia and Pena-Santiago2005).
Phylogenetic analyses
Panagrolaimus davidi (field strain) and P. davidi CB1 (laboratory strain) group together in our phylogeny (Fig. S1 which will be found at http://dx.doi.org/10.1017/S0954102013000230), and form a sister group to Panagrellus redivivus. These species are members of Clade IV, which includes members of the Rhabditida (Blaxter et al. Reference Blaxter, De Ley, Garey, Liu, Scheldeman, Vierstraete, Vanfleteren, Mackey, Dorris, Frisse, Vida and Thomas1998). Scottnema lindsayae groups with Zeldia punctata Thorne and falls within Clade IV. Plectus murrayi is a sister taxon to P. minimus Cobb and P. aquatilis Andrassy. These taxa are members of the Chromadorida, a diverse group dominated by bacteriovores, which forms a paraphyletic group (C) in Blaxter's phylogeny. All three of the populations of Eudorylaimus sp. group closely with Aporcelaimellus obtusicaudatus Bastian and Xiphinema rivesi Dalmasso. They form members of Clade I, which includes plant parasites from the Dorylaimida (X. rivesi) and the intertidal free-living species A. obtusicaudatus.
A recent study of the genus Panagrolaimus sequenced part of the 18S gene from over 30 species and strains (Lewis et al. Reference Lewis, Dyal, Hilburn, Weitz, Liau, LaMunyon and Denver2009). Figure 1 shows the position of the two Victoria Land Panagrolaimus species (P. davidi field strain and P. davidi CB1) in Lewis et al.'s MP bootstrap consensus tree with Caenorhabditis elegans and C. briggsae Dougherty & Nigon as outgroups. Panagrolaimus davidi CB1 groups with other parthenogenetic species, while P. davidi field strain forms a sister group to most of the other species.
Evolutionary relationships of 30 Panagrolaimus species, including P. davidi field strain and P. davidi CB1 (asterisks), inferred from 18S sequence data from this study and that of Lewis et al. (Reference Lewis, Dyal, Hilburn, Weitz, Liau, LaMunyon and Denver2009). Branches corresponding to partitions reproduced in less than 50% bootstrap replicates are collapsed. The percentage of replicate trees in which the associated taxa clustered together in the bootstrap test (1000 replicates) are shown next to the branches (Felsenstein Reference Felsenstein1985). The tree is drawn to scale, with the branch lengths calculated using the average pathway method (Nei & Kumar Reference Nei and Kumar2000). There were a total of 362 positions in the final dataset, out of which 143 were parsimony informative.

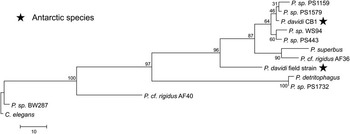
The two Victoria Land Panagrolaimus species were also related to other species/strains from the genus using the D3 sequences available from the study of Shannon et al. (Reference Shannon, Browne, Boyd, Fitzpatrick and Burnell2005). This MP bootstrap consensus tree shows the level of difference between P. davidi CB1 and P. davidi field strain (Fig. 2).
Evolutionary relationships of 12 Panagrolaimus species, including P. davidi field strain and P. davidi CB1 (asterisks), inferred from D3 sequence data from this study and that of Shannon et al. (Reference Shannon, Browne, Boyd, Fitzpatrick and Burnell2005). Branches corresponding to partitions reproduced in less than 50% bootstrap replicates are collapsed. The percentage of replicate trees in which the associated taxa clustered together in the bootstrap test (1000 replicates) are shown next to the branches (Felsenstein Reference Felsenstein1985). The tree is drawn to scale, with branch lengths calculated using the average pathway method (Nei & Kumar Reference Nei and Kumar2000). There were a total of 269 positions in the final dataset, out of which 116 were parsimony informative.

In the two Panagrolaimus phylogenies presented here (Figs 1 & 2), P. davidi CB1 appears to be closely related to P. sp. PS1579, a parthenogenetic Californian strain from Huntington Gardens, USA (Lewis et al. Reference Lewis, Dyal, Hilburn, Weitz, Liau, LaMunyon and Denver2009). In the 18S phylogeny, the other closely related species to P. davidi CB1 is P. sp. PS3966, another parthenogenetic Californian strain from Pasadena (Lewis et al. Reference Lewis, Dyal, Hilburn, Weitz, Liau, LaMunyon and Denver2009) and in the D3 phylogeny P. sp. PS1159, a parthenogenetic strain from North Carolina (Shannon et al. Reference Shannon, Browne, Boyd, Fitzpatrick and Burnell2005). The field strain of P. davidi, however, forms a distinct clade well separated from other species and strains of Panagrolaimus; including from P. davidi CB1. Both 18S and D3 phylogenies show considerable divergence between P. davidi CB1 and P. davidi field strain.
Lewis et al. (Lewis et al. Reference Lewis, Dyal, Hilburn, Weitz, Liau, LaMunyon and Denver2009) applied a molecular clock approach to estimate the divergence date between P. davidi CB1 and the closely related P. sp. 1579, externally calibrated using Denver et al.'s estimates of mutation rates in C. elegans (Denver et al. Reference Denver, Morris, Lynch and Thomas2004), and concluded a rough time to most recent common ancestor of only 140 206 nematode generations. The authors used an estimate that these nematodes may experience ten generations per year in Antarctica to yield a very surprising divergence date of only approximately 14 000 years ago (Lewis et al. Reference Lewis, Dyal, Hilburn, Weitz, Liau, LaMunyon and Denver2009).
In our study, sequence data were compared from 24 wild P. davidi individuals from Cape Hallett, Gondwana Station and Cape Bird, the latter is thought to be the original source of P. davidi CB1. All individuals had identical 18S and D3 sequences, and the P. davidi CB1 sequence was not found in any of the wild populations, including the Cape Bird samples.
There are several explanations for the differences between P. davidi field strain and P. davidi CB1. The laboratory culture may have become contaminated with a different species. Since it was established in 1988, the culture strain has been maintained in isolation, with all efforts made to avoid contamination. Only one Panagrolaimus species has been recorded from New Zealand, P. australis Yeates (Yeates Reference Yeates2010). However P. australis has a distinctly different morphology to P. davidi CB1 and is strictly gonochoristic in culture (Yeates Reference Yeates1969). There could be contamination with an undescribed parthenogenetic Panagrolaimus strain from New Zealand, since new Panagrolaimus strains/species are easy to isolate and the diversity of the genus may be considerably undersurveyed (Lewis et al. Reference Lewis, Dyal, Hilburn, Weitz, Liau, LaMunyon and Denver2009). Although contamination of our culture with a temperate species cannot be ruled out it seems unlikely that the extreme cold tolerance abilities of P. davidi CB1 (Smith et al. Reference Smith, Wharton and Marshall2008) would have evolved in an environment where they are unlikely to be exposed to very low temperatures, but it is to be expected for an Antarctic species.
The remarkably close genetic relationship of P. davidi CB1 to three North American Panagrolaimus strain (P. sp. PS1579, P. sp. PS3966 and P. sp. PS1159) needs to be considered, particularly given the amount of human activity in this area of Antarctica. Lewis et al. (Reference Lewis, Dyal, Hilburn, Weitz, Liau, LaMunyon and Denver2009) concluded that P. davidi CB1 colonized Antarctica in the very recent past and that it must have either evolved its extreme cold-tolerance very rapidly, or arrived in a “pre-adapted” state. Anhydrobiotic strains of Panagrolaimus form a single phylogenetic lineage, which includes P. davidi CB1 and its two closest relatives: P. sp. PS1579 and P. sp. PS1159 (Shannon et al. Reference Shannon, Browne, Boyd, Fitzpatrick and Burnell2005). The colonization of polar regions by anhydrobiotic nematodes from other parts of the world, or vice versa, is a possibility. However, the field strain of P. davidi is well separated from other species and strains genetically, suggesting that it is an endemic Antarctic species.
Although the culture process will clearly have had both phenotypic and genetic effects, it does not seem possible that genetic differences of the level seen between P. davidi field strain and P. davidi CB1 (>9% at two nuclear loci) could have arisen solely from the culture process. P. davidi CB1 could be an Antarctic species that is less common than P. davidi field strain in the wild, but rapidly dominates in culture due to its parthenogenetic reproductive mode. We are currently conducting an extensive survey of Ross Island sites to test this hypothesis.
Acknowledgements
This work was generously supported by a Fanny Evans Post-Graduate Scholarship for Women and a scholarship from Antarctica New Zealand and Kelly Tarlton's, awarded to MRR. We are grateful for the logistical support of Antarctica New Zealand (event KO66), technical support from Karen Judge and Tania King, and field assistance from Justine Marshall, Francesca Cunninghame and Konstanze Gebauer. We also thank Jonathan Banks for the Cape Bird sample, Graham Wallis, Sven Bostrøm and an anonymous referee for their comments on the manuscript.