Implications
Glucagon-like peptide-2 (GLP-2) is a hormone secreted by intestinal endocrine cells in response to dietary nutrients. This hormone increases small intestinal epithelium growth in ruminant calves. Post-absorptive ruminant calves that were given GLP-2 for 10 days had increased uptake of amino acids, but not glucose, by the portal-drained viscera. Intestinal growth stimulated by GLP-2 reduces the availability of amino acids for other purposes but does not affect glucose metabolism in post-absorptive ruminant calves.
Introduction
Glucagon-like peptide-2 (GLP-2) is a 33-amino acid hormone secreted from the gastrointestinal tract in response to luminal nutrients (Massimino et al., Reference Massimino, McBurney, Field, Thomson, Keelan, Hayek and Sunvold1998). Two established actions of GLP-2 are increased small intestinal mass (Brubaker et al., Reference Brubaker, Izzo, Hill and Drucker1997; Drucker et al., Reference Drucker, DeForest and Brubaker1997; Tsai et al., Reference Tsai, Hill and Drucker1997a and Reference Tsai, Hill, Asa, Brubaker and Drucker1997b; Orskov et al., Reference Orskov, Hartmann, Poulsen, Thulesen, Hare and Holst2005) and increased blood flow, specifically of vessels supplying and draining the small intestine such as the superior mesenteric artery (SMA) and portal vein (Guan et al., Reference Guan, Stoll, Lu, Tappenden, Holst, Hartmann and Burrin2003 and Reference Guan, Karpen, Stephens, Bukowski, Niu, Zhang, Stoll, Finegold, Holst, Hadsell, Nichols and Burrin2006; Stephens et al., Reference Stephens, Stoll, Cottrell, Chang, Helmrath and Burrin2006; Deniz et al., Reference Deniz, Bozkurt and Kurtel2007; Bremholm et al., Reference Bremholm, Hornum, Henriksen, Larsen and Holst2009). The vast majority of published research (referenced above) investigating the effects of GLP-2 on intestinal growth and blood flow has been conducted in non-ruminant species (rodents, pigs, humans) and consistent results have been obtained across these non-ruminant species. However, the effect of GLP-2 on blood flow only has been investigated in experiments utilizing short-term infusions (<4 h) of GLP-2 (Guan et al., Reference Guan, Stoll, Lu, Tappenden, Holst, Hartmann and Burrin2003 and Reference Guan, Karpen, Stephens, Bukowski, Niu, Zhang, Stoll, Finegold, Holst, Hadsell, Nichols and Burrin2006; Stephens et al., Reference Stephens, Stoll, Cottrell, Chang, Helmrath and Burrin2006; Deniz et al., Reference Deniz, Bozkurt and Kurtel2007; Bremholm et al., Reference Bremholm, Hornum, Henriksen, Larsen and Holst2009); no experiments in any species have been conducted evaluating the blood flow response to GLP-2 after chronic GLP-2 administration.
Recently, we demonstrated that GLP-2 has similar actions in ruminant calves as those previously established for non-ruminants (Taylor-Edwards et al., Reference Taylor-Edwards, Burrin, Holst, McLeod and Harmon2011). Small intestinal mass was increased with 10-day GLP-2 administration, with observed increases in epithelial mass, villus height, crypt depth and 5-bromo-2′-deoxyuridine (BrdU) labeling in small intestinal segments, particularly the jejunum. Importantly, we also demonstrated that short-term infusion of GLP-2 increased blood flow in ruminant calves, but this blood flow effect in response to GLP-2 was attenuated after the extended 10-day GLP-2 administration. These observations indicate that GLP-2 induces similar increases in small intestinal blood flow and growth in ruminants as observed in non-ruminants.
Much of the focus of GLP-2 research has been on the short-term effects of GLP-2 on blood flow or the long-term effects of GLP-2 on gut growth. Very little research has investigated the changes in nutrient utilization by the gut with GLP-2 treatment. In non-ruminants, a 4-h GLP-2 infusion increased portal-drained viscera (PDV) glucose and indispensable amino acid uptake (Guan et al., Reference Guan, Stoll, Lu, Tappenden, Holst, Hartmann and Burrin2003). The significant effects of GLP-2 on gut growth could influence energy and protein metabolism in the splanchnic tissues. Tissues of the gut have a high metabolic rate and energy and amino acid metabolism of these tissues accounts for a large proportion of whole body metabolism (McBride and Kelly, Reference McBride and Kelly1990). Indeed, changes in nutrient utilization by the gut could alter the availability of nutrients for other purposes, such as growth.
Therefore, the objectives of this experiment were to examine the effects of exogenously administered GLP-2 on splanchnic blood flow and net PDV, hepatic and total splanchnic (TS) nutrient fluxes in the ruminant. The blood flow response to GLP-2 was investigated at the beginning and end of the experiment to evaluate the response of splanchnic blood flow to a 1-h intravenous GLP-2 infusion before and after 10 days of GLP-2 administration. We hypothesized that GLP-2 infusion would increase blood flow of the portal and hepatic veins in calves treated with GLP-2 but that this blood flow response may be diminished after 10 days of exogenous GLP-2 administration. We hypothesized that GLP-2-induced increases in gastrointestinal growth would increase the PDV utilization of energy and amino acids compared with control calves.
Material and methods
Animals and surgical procedures
All experimental procedures were approved by the University of Kentucky Institutional Animal Care and Use Committee. Eight Holstein calves (41 ± 3 days old) were obtained for use in this experiment. Calves were fed milk replacer twice daily, with water and calf starter available ad libitum before weaning (50 ± 3 days of age), at which point they were gradually adjusted to a 50 : 50 (by weight) mixture of alfalfa cubes and calf starter, as previously described (Taylor-Edwards et al., Reference Taylor-Edwards, Burrin, Holst, McLeod and Harmon2011). Calves were fed this diet at 2.75% of BW before and throughout the experiment; their daily allotment was fed in two equally sized meals at 0730 and 1730 h. When calves were 97 ± 7 days of age, they were surgically prepared with chronic indwelling catheters in a carotid artery, mesenteric vein, the hepatic portal vein and the hepatic vein. Surgical procedures and care are described in detail elsewhere (Taylor-Edwards et al., Reference Taylor-Edwards, Burrin, Holst, McLeod and Harmon2011). Experimental procedures began ∼16 days after surgery (113 ± 8 days of age), once animals had maintained pre-surgery, ad libitum levels of feed intake for a minimum of 5 days. At the beginning of the experiment, calves weighed 126 ± 7.7 kg, were ∼113 ± 8 days of age and had been weaned for more than 60 days.
Experimental design
Calves were paired by age before being assigned randomly to treatment, control (n = 4) or GLP-2 (n = 4). Only two calves (one per treatment) began experimental periods at any one time. Experimental periods were 11 days in length. On day 1, a blood flow experiment was performed as described below. After the blood flow measurements, calves were given subcutaneous injections of either vehicle (0.5% bovine serum albumin in saline, Control) or GLP-2 (100 μg/kg BW per day GLP-2 in vehicle, GLP-2) in two equal portions daily for 10 days. The GLP-2 used for both daily injections and the blood flow experiment was synthesized (California Peptide Research Inc., Napa, CA, USA) on the basis of the native bovine GLP-2 sequence (Lopez et al., Reference Lopez, Frazier, Su, Kumar and Saunders1983; Burrin et al., Reference Burrin, Stoll and Guan2003). On day 10, blood flow was again measured as described below.
Blood flow measurements
On days 1 and 10 of the experiment, blood flow was monitored for 2.5 h using p-aminohippuric acid (pAH) to measure portal vein, hepatic vein and hepatic artery plasma flow. Blood flow measurements were conducted after withholding the morning feeding to minimize prandial blood flow changes; thus, animals were fasted for ∼12 h before the experiment. Beginning 1 h before the blood flow experiment and continuing throughout the sampling period, pAH (2.0% wt/vol, pH 7.4) was continuously infused into the mesenteric vein catheter (0.98 ml/min) with a peristaltic pump (Watson Marlow 205U, Wilmington, MA, USA). The blood flow experiment consisted of 3 periods: (1) baseline infusion (B1 or B10 for baseline measurements on day 1 or 10, respectively) to establish baseline blood flow and nutrient flux during a 30-min infusion of physiological saline; (2) treatment challenge infusion (C1 or C10) in which calves were infused intravenously with their assigned treatment, either control or GLP-2 (3.76 μg/kg BW per h) for 60 min; and (3) saline infusion (S1 or S10) in which calves were infused with physiological saline for 60 min to observe the recovery of blood flow and net nutrient flux after treatment challenge infusion. On day 10, the blood flow experiment was started 3 to 7 h after the subcutaneous injection of treatment for that morning. Infusion solutions (saline or treatment) were infused into the mesenteric vein catheter at a rate of 0.70 ml/min with a syringe pump (Harvard Apparatus model 22, Holliston, MA, USA).
In addition, on day 10, a continuous intravenous infusion of [U13-C]glucose was used to measure PDV metabolism of glucose. The [U13-C]glucose infusate was prepared by dissolving d-[U13-C]glucose (99% 13C, Cambridge Isotopes, Woburn, MA, USA) in sterile saline and infused to achieve an atomic percent excess of ∼0.2%. Approximately 12 h before sampling, temporary jugular catheters were inserted for labeled glucose infusion. On day 10, after sampling blood for background label abundance, a priming dose (50 ml) of [U13-C]glucose infusate was administered into the jugular catheter. The priming dose of [U13-C]glucose was immediately followed by continuous infusion of [U13-C]glucose into the jugular catheter (0.98 ml/min) to achieve an infusion rate of 0.384 mmol/h of [U13-C]glucose. [U13-C]glucose was infused with a peristaltic pump (Watson Marlow 205U), concurrent with the infusion of pAH (e.g. beginning 1 h before the blood flow experiment and continuing throughout the sampling period).
Portal and hepatic venous and arterial blood samples (5 ml each) were collected from their respective catheter every 15 min during the entire 2.5-h recording period. This sampling frequency was chosen to ensure that several points would be obtained for any infusion period (B, C, or S). Blood samples were drawn into a chilled syringe containing sodium ethylenediaminetetraacetic acid (EDTA; final concentration 10 mg EDTA/ml blood). Blood was immediately analyzed for hematocrit using a microhematocrit centrifuge (Autocrit Ultra 3, Becton Dickinson, Franklin Lakes, NJ, USA) at 13 700 × g for 3 min. Remaining whole blood was centrifuged (3000 × g for 10 min) to obtain plasma and was stored at −20°C.
Plasma metabolite analysis
Plasma concentrations of pAH and urea-N were determined by automated analysis (AutoAnalyzer II, Technicon Industrial Systems, Tarrytown, NY, USA) according to the methods described by Harvey and Brothers (Reference Harvey and Brothers1962) and Marsh et al. (Reference Marsh, Fingerhut and Miller1965), respectively. The standard curve for pAH assay was developed from the pAH infusion solution used each day. Plasma samples were analyzed by membrane-immobilized enzymes (YSI Inc., Yellow Springs, OH, USA) for l-lactate (coupled to l-lactate oxidase), d-glucose (coupled to glucose oxidase), l-glutamate (coupled to l-glutamate oxidase) and l-glutamine (coupled to glutaminase and l-glutamate oxidase). Plasma concentrations of β-hydroxybutyrate were determined using an enzymatic assay (Stanbio Laboratory, Boerne, TX, USA) adapted for use on a Konelab 20XTi Analyzer (Thermo Electron Corporation, Waltham, MA, USA). Portal venous and arterial plasma samples from day 10 were analyzed for amino acid concentrations by reverse-phase HPLC of their phenyl isothiocyanate derivatives (PicoTag, Waters, Woburn, MA, USA) using the methods reported in Stoll et al. (Reference Stoll, Chang, Fan, Reeds and Burrin2000). The HPLC analysis included analysis for glutamate and glutamine; therefore, for these two amino acids both the enzymatic analysis and HPLC analysis results are presented. Portal and hepatic venous and arterial plasma samples from day 10 were also analyzed for [U13-C]glucose by gas chromatography/isotope ratio mass spectrometry (GC/IRMS) after pentaacetate derivitization (Kristensen et al., Reference Kristensen, Danfaer, Rojen, Raun, Weisbjerg and Hvelplund2002).
Calculations and statistical analysis
Means were calculated for pAH and metabolite concentrations in arterial, portal venous and hepatic venous blood samples and were used to determine blood plasma flows and nutrient fluxes. Therefore, each measurement had 6 means per calf: 3 for the B, C and S periods on days 0 (B1, C1 and S1, respectively) and 3 for the B, C and S periods on day 10 (B10, C10 and S10, respectively). Flow as a percent of baseline was determined by dividing the absolute flow rate (determined at 15 min intervals) during the treatment or saline infusions by the mean of the absolute flow rate determined three times during the baseline infusion.
The following equations were used to calculate blood flow and net nutrient flux:
1. Plasma flow = pAH infusion rate/(CV − CA) where CV is the pAH concentration in portal or hepatic plasma and CA is the pAH concentration in arterial plasma.
2. Hepatic arterial flow = hepatic plasma flow − portal plasma flow.
3. Net PDV flux = portal plasma flow × (CP − CA) where CP and CA are metabolite concentrations in portal and arterial plasma, respectively.
4. Net TS flux = hepatic plasma flow × (CH − CA) where CH and CA are metabolite concentrations in hepatic and arterial plasma, respectively.
5. Net hepatic flux = net TS flux − net PDV flux.
A positive net flux indicates net release or production by the PDV or liver and a negative net flux indicates net extraction or uptake by the PDV or liver.
6. Net PDV extraction ratio (PER) = 1 − (net PDV flux/(portal plasma flow × arterial nutrient concentration)) × 100.
7. Hepatic extraction ratio (HER) = 1 − (net hepatic flux/((portal plasma flow × portal nutrient concentration) + (arterial plasma flow × arterial nutrient concentration))) × 100.
Four blocks of two calves (paired by age) were used in the experiment. Data were analyzed using the MIXED procedure of SAS (SAS Institute Inc., Cary, NC, USA). The statistical model for analyzing baseline blood flow and area under the curve included treatment (T; control or GLP-2), day (D; 1 or 10) and their interaction as fixed effects and block as a random effect. The statistical model for analyzing blood flow (% of baseline), plasma nutrient concentrations and net nutrient flux included Treatment (T; control or GLP-2), Infusion (I; B1, C1, S1, B10, C10 or S10) and their interaction as fixed effects and block as a random effect; infusion was included as a repeated measure with the subject as calf (treatment). Multiple t-tests were used to compare the effect of treatment (control or GLP-2) within each infusion period (B1, C1, S1, B10, C10 or S10). In addition, t-tests were used to compare the differences between baseline on day 0 (B1) for the GLP-2 treatment and baseline on day 10 (B10) for the GLP-2 treatment, between treatment challenge on day 0 (C1) for the GLP-2 treatment and treatment challenge on day 10 (C10) for the GLP-2 treatment, and between saline on day 0 (S1) for the GLP-2 treatment and saline on day 10 (S10) for the GLP-2 treatment. A Bonferroni correction was used to correct P-values for multiple comparisons to achieve a familywise error rate of 0.05. Plasma concentrations and PDV flux of amino acids determined by HPLC and [U13-C]glucose measures were only measured on day 10, and thus the statistical model for analyzing these parameters included treatment (T; control or GLP-2), infusion (baseline, treatment and saline) and their interaction as fixed effects and block as a random effect. Measures for [U13-C]glucose were not conducted during the first block of calves, and thus those measures represent the responses of only three animals for the GLP-2 and control treatments. Pearson correlation coefficients were determined between calf observations for some parameters. Results are expressed as means ± s.e., and significance for treatment effects and correlations was declared at P < 0.05.
Results
Days 0 and 10 blood flows
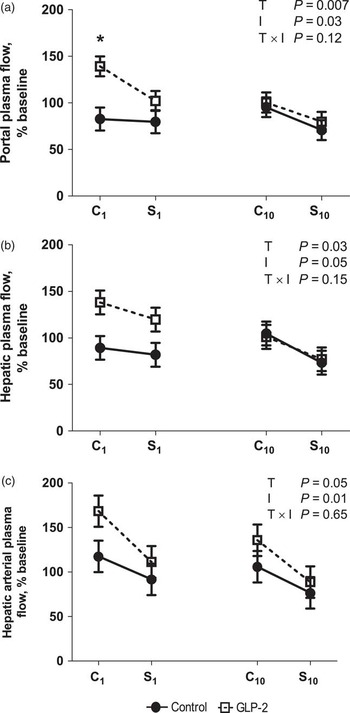
Because of significant animal variation in absolute plasma flows, calculating flow as a % of baseline more effectively demonstrates effect of treatment on plasma flow. Portal and hepatic plasma flows, as a % of baseline (Figure 1a and b, respectively), were increased (T; P = 0.007 and P = 0.03, respectively) by GLP-2 infusion in calves on day 1 but not on day 10. Hepatic arterial plasma flow (% of baseline) also follows this trend (Figure 1c).
Plasma flow (% of baseline) of the portal vein (a), hepatic vein (b) and hepatic artery (c) in calves treated with Control (•; n = 4) or glucagon-like peptide-2 (GLP-2; □; n = 4). Response to treatment challenge or saline infusion in calves not previously exposed to treatment (C1 and S1) or after 10 days of treatment exposure (C10 and S10) was evaluated. Calves in the Control group were given vehicle (bovine serum albumin) during both the treatment challenge infusion period (C1 and C10) and as subcutaneous injection for 10 days. Calves in the GLP-2 treatment group were given 3.76 μg/kg BW per h GLP-2 during the treatment challenge infusion period (C1 and C10) and 100 μg/kg BW per day GLP-2 as subcutaneous injection for 10 days. Values are expressed as percent of the blood or plasma flow during the baseline infusion period (means ± s.e.). Fixed effect P-values for Treatment (T; Control or GLP-2), Infusion period (I; C1, S1, C10 or S10) and their interaction are shown for each figure. Significant differences between T (Control v. GLP-2) within I are denoted by * (α < 0.05).

Analysis of the area above the baseline for portal plasma flow demonstrated that GLP-2 infusion (compared with control infusion) tended to increase (T × D; P = 0.10) blood flow in calves on day 1 (417 ± 89 v. 130 ± 106 l/h) but not on day 10 (110 ± 65 v. 93 ± 30 l/h). A similar pattern (T × D; P = 0.27) was observed for the area above the baseline for hepatic plasma flow on day 1 (407 ± 61 v. 174 ± 144 l/h) and day 10 (122 ± 96 v. 113 ± 53 l/h). There were no differences for the area above the baseline for arterial plasma flow.
Days 0 and 10 energy and protein metabolite fluxes
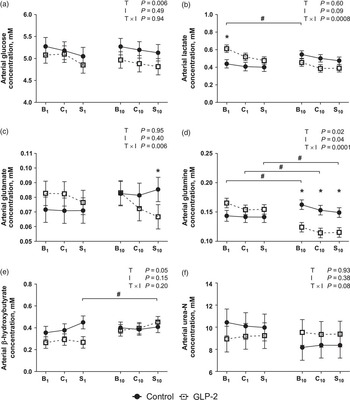
Infusion of GLP-2 affected the arterial concentrations of several metabolites. Arterial glucose concentrations in calves in the GLP-2 treatment group were lower (T; P = 0.006; Figure 2a) than those in the control group. Arterial lactate concentrations were greater (T × I; P = 0.0008; Figure 2b) in the GLP-2 treatment group than control for the baseline infusion on day 1, but were similar to or numerically less than control during the day 10 infusions. Arterial glutamate concentrations were similar between treatments on day 1 but GLP-2 reduced (T × I; P = 0.006; Figure 2c) arterial glutamate concentrations during the saline recovery infusion on day 10. Similarly, arterial glutamine concentrations did not differ between treatments on day 1, but on day 10 GLP-2 reduced (T × I; P = 0.0001; Figure 2d) arterial glutamine concentrations compared with both the control-treated calves and the values obtained in the GLP-2-treatment group during the corresponding infusion time on day 1. Arterial β-hydroxybutyrate concentrations were lower (T; P = 0.05; Figure 2e) for calves in the GLP-2 treatment group than the control treatment group, although this is primarily due to GLP-2 numerically reducing arterial β-hydroxybutyrate concentrations during the day 1 infusions. Arterial urea-N concentrations tended to be lower (T × I; P = 0.08; Figure 2f) in GLP-2-treated calves than control-treated calves during the day 1 infusions, but tended to be greater in GLP-2-treated calves than control-treated calves during the day 10 infusions. Arterial hematocrit did not differ between treatments (30.3 ± 0.63% v. 29.3 ± 0.61% for CON and GLP-2, respectively).
Arterial concentrations of glucose (a), lactate (b), glutamate (c), glutamine (d), β-hydroxybutyrate (e) and urea-N (f) in calves treated with Control (•; n = 4) or glucagon-like peptide-2 (GLP-2; □; n = 4). Response to baseline, treatment challenge or saline infusion in calves not previously exposed to treatment (B1, C1 and S1) or after 10 days of treatment exposure (B10, C10 and S10) was evaluated. Calves in the Control group were given vehicle (bovine serum albumin) during both the treatment challenge infusion period (C1 and C10) and as subcutaneous injection for 10 days. Calves in the GLP-2 treatment group were given 3.76 μg/kg BW per h GLP-2 during the treatment challenge infusion period (C1 and C10) and 100 μg/kg BW per day GLP-2 as subcutaneous injection for 10 days. Values are expressed as mM (means ± s.e.). Fixed effect P-values for Treatment (T; Control or GLP-2), Infusion period (I; B1, C1, S1, B10, C10 or S10) and their interaction are shown for each figure. Significant differences between T (Control v. GLP-2) within I are denoted by * (α < 0.05). Within GLP-2 treatment, significant differences between baseline (B1v. B10), treatment challenge (C1v. C10) or saline (S1v. S10) infusions are denoted by # (α < 0.05).

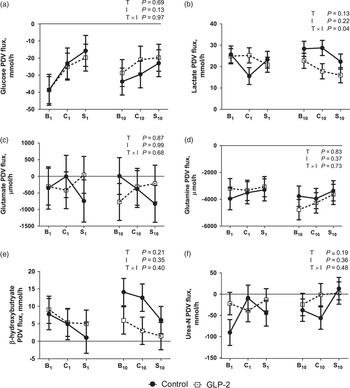
Treatment did not affect net PDV flux of glucose (Figure 3a). Net PDV lactate flux in GLP-2-treated calves did not differ from control-treated calves during the day 1 baseline or saline infusions and was numerically greater than control-treated calves during the day 1 treatment challenge infusion, but was numerically lower than control-treated calves during the day 10 infusions (T × I; P = 0.04; Figure 3b). Net flux of glutamate, glutamine, β-hydroxybutyrate and urea-N by the PDV did not differ between treatments (Figure 3c, d, e and f, respectively).
Net portal-drained viscera (PDV) flux of glucose (a), lactate (b), glutamate (c), glutamine (d), β-hydroxybutyrate (e) and urea-N (f) in calves treated with Control (•; n = 4) or glucagon-like peptide-2 (GLP-2; □; n = 4). Response to baseline, treatment challenge, or saline infusion in calves not previously exposed to treatment (B1, C1 and S1) or after 10 days of treatment exposure (B10, C10 and S10) was evaluated. Calves in the Control group were given vehicle (bovine serum albumin) during both the treatment challenge infusion period (C1 and C10) and as subcutaneous injection for 10 days. Calves in the GLP-2 treatment group were given 3.76 μg/kg BW per h GLP-2 during the treatment challenge infusion period (C1 and C10) and 100 μg/kg BW per day GLP-2 as subcutaneous injection for 10 days. Values are expressed as mmol/h or μmol/h (means ± s.e.). Fixed effect P-values for Treatment (T; Control or GLP-2), Infusion period (I; B1, C1, S1, B10, C10 or S10) and their interaction are shown for each figure.

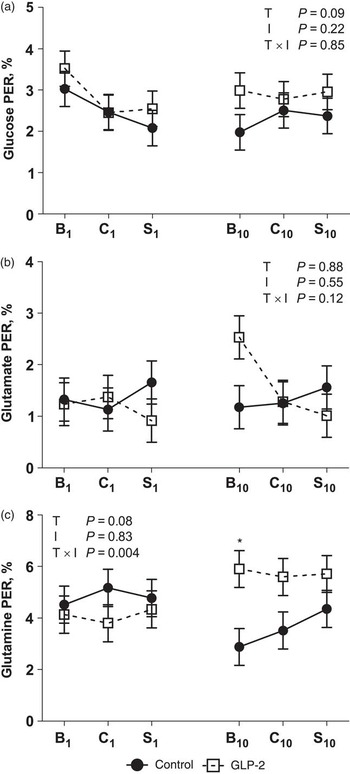
Treatment with GLP-2 tended to increase the net PDV extraction of glucose (T; P = 0.09; Figure 4a). The net PER of glutamate did not differ between treatments (Figure 4b). During the day 10 infusions, GLP-2-treated calves had greater (T × I; P = 0.004; Figure 4c) net PDV extraction of glutamine, especially in the baseline period, than control-treated calves.
Net PDV extraction ratio (PER) of glucose (a), glutamate (b) and glutamine (c) in calves treated with Control (•; n = 4) or glucagon-like peptide-2 (GLP-2; □; n = 4). Response to baseline, treatment challenge or saline infusion in calves not previously exposed to treatment (B1, C1 and S1) or after 10 days of treatment exposure (B10, C10 and S10) was evaluated. Calves in the Control group were given vehicle (bovine serum albumin) during both the treatment challenge infusion period (C1 and C10) and as subcutaneous injection for 10 days. Calves in the GLP-2 treatment group were given 3.76 μg/kg BW per h GLP-2 during the treatment challenge infusion period (C1 and C10) and 100 μg/kg BW per day GLP-2 as subcutaneous injection for 10 days. Values are expressed as % (means ± s.e.). Net PER = 1 – (net PDV flux/(portal plasma flow × arterial nutrient concentration)) × 100. Fixed effect P-values for Treatment (T; Control or GLP-2), Infusion period (I; B1, C1, S1, B10, C10 or S10) and their interaction are shown for each figure. Significant differences between T (Control v. GLP-2) within I are denoted by * (α < 0.05).

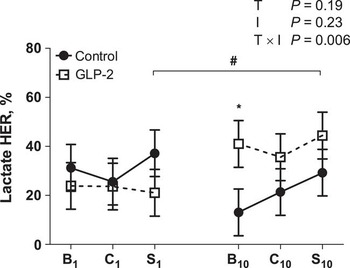
Treatment with GLP-2 tended to reduce (T; P = 0.09; 70.7 ± 10.42 v. 93.7 ± 7.01 mmol/h) net hepatic glucose flux compared with control-treated calves because hepatic flux was numerically lower for GLP-2-treated calves during the day 10 treatment challenge and saline infusion periods. There were no treatment differences observed for net hepatic flux of lactate, glutamate, glutamine, β-hydroxybutyrate or urea-N (data not shown). The HER of lactate did not differ between treatments during the day 1 infusions, but the lactate hepatic extraction ratios of GLP-2-treated calves were greater (T × I; P = 0.006; Figure 5) than those of control-treated calves during the day 10 baseline infusion.
Net hepatic extraction ratio (HER) of lactate in calves treated with Control (•; n = 4) or glucagon-like peptide-2 (GLP-2; □; n = 4). Response to baseline, treatment challenge or saline infusion in calves not previously exposed to treatment (B1, C1 and S1) or after 10 days of treatment exposure (B10, C10 and S10) was evaluated. Calves in the Control group were given vehicle (bovine serum albumin) during both the treatment challenge infusion period (C1 and C10) and as subcutaneous injection for 10 days. Calves in the GLP-2 treatment group were given 3.76 μg/kg BW per h GLP-2 during the treatment challenge infusion period (C1 and C10) and 100 μg/kg BW per day GLP-2 as subcutaneous injection for 10 days. Values are expressed as % (means ± s.e.). HER = 1 – (net hepatic flux/((portal plasma flow × portal nutrient concentration) + (arterial plasma flow × arterial nutrient concentration))) × 100. Fixed effect P-values for Treatment (T; Control or GLP-2), Infusion period (I; B1, C1, S1, B10, C10 or S10) and their interaction are shown for each figure. Significant differences between T (Control v. GLP-2) within I are denoted by * (α < 0.05). Within GLP-2 treatment, significant differences between baseline (B1v. B10), treatment challenge (C1v. C10) or saline (S1v. S10) infusions are denoted by # (α < 0.05).

Because treatment did not affect glucose flux by the PDV but did tend to reduce net hepatic glucose flux, net TS glucose flux followed a similar pattern to hepatic glucose flux, mmol/h (T × I; P = 0.06, data not shown). There were no differences observed for net TS flux of lactate, glutamate, glutamine, β-hydroxybutyrate or urea-N.
Day 10 amino acid analysis
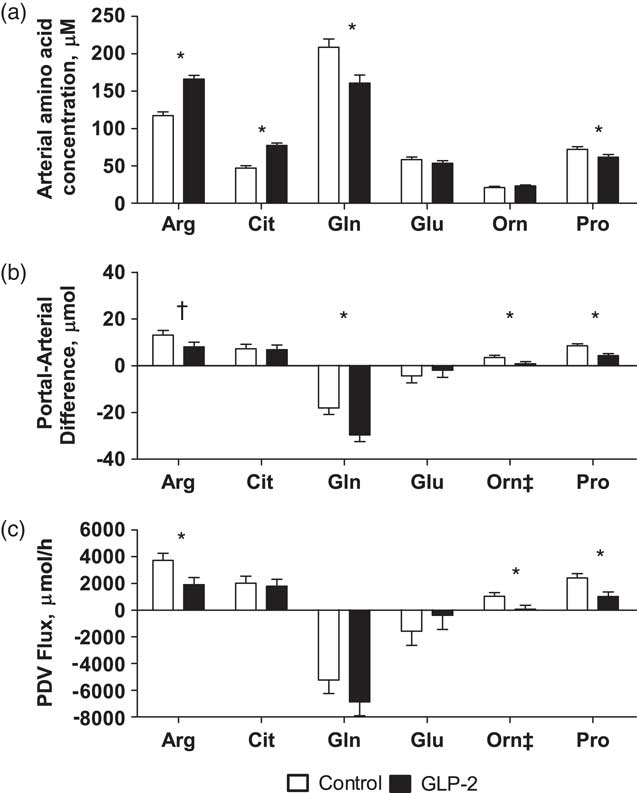
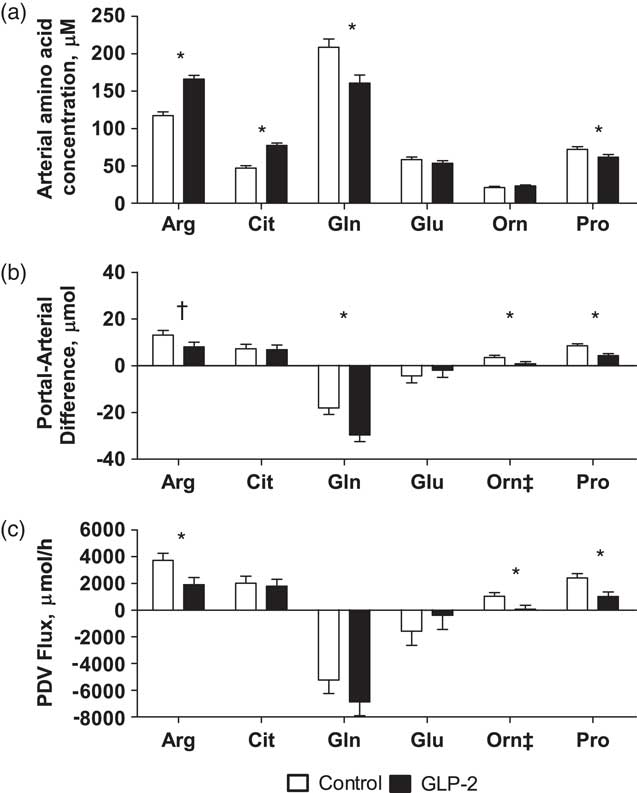
Generally, interactions of treatment and infusion were not observed (P > 0.19), and thus treatment means (GLP-2 v. control) are presented except as noted. Ten days of GLP-2 treatment affected the arterial concentrations, portal–arterial differences and net PDV fluxes of several amino acids important for gut metabolism. Administration of GLP-2 for 10 days increased (T; P < 0.05) arterial concentrations of arginine and citrulline, decreased (T; P < 0.05) arterial concentrations of glutamine and proline and did not affect arterial concentrations of glutamate and ornithine (Figure 6a). Treatment with GLP-2 for 10 days reduced (T; P < 0.05) the portal–arterial concentration differences of glutamine and proline, tended to reduce (T; P < 0.10) the portal–arterial concentration difference of arginine and did not affect the portal–arterial concentration differences of citrulline or glutamate (Figure 6b). Portal–arterial concentration differences of ornithine in control calves were initially high during the baseline period and decreased across the treatment and saline infusion periods, whereas ornithine portal–arterial concentration differences in GLP-2-treated calves remained low across the baseline and treatment infusion periods and increased slightly during the saline infusion period (T × I; P = 0.02, data not shown). These portal–arterial concentration difference changes were reflected in similar results for reduced net PDV flux of arginine and proline (T; P < 0.05) and ornithine (T × I; P = 0.02, data not shown) in GLP-2-treated calves; citrulline, glutamine and glutamate net PDV fluxes were unaffected by treatment (Figure 6c).
Arterial concentrations (a), portal–arterial difference (b) and net portal-drained viscera (PDV) flux (c) of amino acids important for gut maintenance in calves treated with Control (open bars; n = 4) or glucagon-like peptide-2 (GLP-2; closed bars; n = 4). Response to baseline, treatment challenge or saline infusion in calves after 10 days of treatment exposure was evaluated; treatment means across infusion period are presented. Calves in the Control group were given vehicle (bovine serum albumin) during both the treatment challenge infusion period and as subcutaneous injection for 10 days. Calves in the GLP-2 treatment group were given 3.76 μg/kg BW per h GLP-2 during the treatment challenge infusion period and 100 μg/kg BW per day GLP-2 as subcutaneous injection for 10 days. Values are expressed as μM or μmol/h (means ± s.e.). Significant differences between Treatment (Control v. GLP-2) are denoted by * (α < 0.05) and tendencies are denoted by † (α < 0.10). ‡ denotes that a significant treatment by infusion interaction occurred; these interactions are described in the ‘Results’ section.
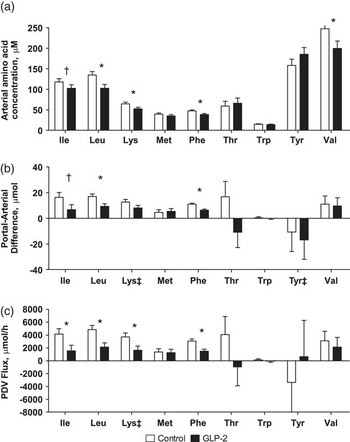
Arterial concentrations of the essential amino acids leucine, lysine, phenylalanine and valine were reduced (P < 0.05) and isoleucine tended to be reduced (P < 0.10) by 10-day GLP-2 treatment, whereas GLP-2 had no effect on arterial concentrations of tyrosine (Figure 7a). Ten days of GLP-2 decreased (P < 0.05) portal–arterial concentration differences of leucine and phenylalanine, and tended to decrease (P < 0.10) portal–arterial concentration differences of isoleucine, whereas GLP-2 had no effect on portal–arterial concentration differences of valine (Figure 7b). Portal–arterial concentration differences of lysine in control calves were initially high during the baseline period and decreased across the treatment and saline infusion periods, whereas lysine portal–arterial concentration differences in GLP-2-treated calves remained low across the baseline and treatment infusion periods and increased slightly during the saline infusion period (T × I; P = 0.07, data not shown). These portal–arterial concentration difference changes were reflected in similar results for reduced net PDV flux of lysine (T × I; P = 0.07, data not shown) in GLP-2-treated calves. Portal–arterial concentration differences of tyrosine in control-treated calves were initially negative during the baseline period and increased to positive values across the treatment and saline infusion periods, whereas tyrosine portal–arterial concentration differences in GLP-2-treated calves were positive during the baseline period and decreased to negative values across the treatment and saline infusion periods (T × I; P = 0.02, data not shown). These portal–arterial concentration difference changes were reflected in similar results for net PDV flux of tyrosine (T × I; P = 0.03, data not shown). Net PDV flux of isoleucine, leucine and phenylalanine was reduced (P < 0.05) by 10-day GLP-2 treatment, whereas valine net PDV flux was unchanged by treatment (Figure 7c). All measures of methionine, threonine and tryptophan (arterial concentrations, portal–arterial concentration differences and PDV fluxes) were unaffected by 10-day GLP-2 treatment (Figure 7a to c).
Arterial concentrations (a), portal–arterial difference (b) and net portal-drained viscera (PDV) flux (c) of essential amino acids in calves treated with Control (open bars; n = 4) or glucagon-like peptide-2 (GLP-2; closed bars; n = 4). Response to baseline, treatment challenge or saline infusion in calves after 10 days of treatment exposure was evaluated; treatment means across infusion period are presented. Calves in the Control group were given vehicle (bovine serum albumin) during both the treatment challenge infusion period and as subcutaneous injection for 10 days. Calves in the GLP-2 treatment group were given 3.76 μg/kg BW per h GLP-2 during the treatment challenge infusion period and 100 μg/kg BW per day GLP-2 as subcutaneous injection for 10 days. Values are expressed as μM or μmol/h (means ± s.e.). Significant differences between Treatment (Control v. GLP-2) are denoted by * (α < 0.05) and tendencies are denoted by † (α < 0.10). ‡ denotes that a significant treatment by infusion interaction occurred; these interactions are described in the ‘Results’ section.

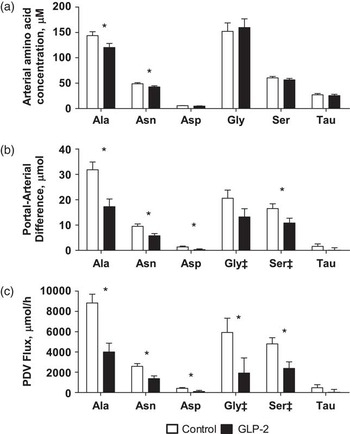
Arterial concentrations of alanine and asparagine were reduced (P < 0.05) by 10-day GLP-2 treatment, but arterial concentrations of aspartate, glycine and serine were not affected by GLP-2 (Figure 8a). Ten-day GLP-2 administration reduced (P < 0.05) portal–arterial concentration differences of alanine, asparagine and aspartate (Figure 8b). Portal–arterial concentration differences of glycine and serine in control-treated calves were initially high during the baseline period and decreased across the treatment and saline infusion periods, whereas glycine and serine portal–arterial concentration differences in GLP-2-treated calves remained low across the baseline and treatment infusion periods and increased slightly during the saline infusion period (glycine T × I; P = 0.007, serine T × I; P = 0.07, data not shown). These portal–arterial concentration difference changes were reflected in similar results for reduced net PDV flux of glycine (T × I; P = 0.02, data not shown) and serine (T × I; P = 0.09, data not shown) in GLP-2-treated calves. Net PDV fluxes of alanine, asparagine and aspartate were decreased (P < 0.05) by 10-day GLP-2 treatment (Figure 8c). No measures of taurine (arterial concentration, portal–arterial concentration difference and PDV flux) were affected by 10-day GLP-2 treatment (Figure 8a to c).
Arterial concentrations (a), portal–arterial difference (b) and net portal-drained viscera (PDV) flux (c) of non-essential amino acids in calves treated with Control (open bars; n = 4) or glucagon-like peptide-2 (GLP-2; closed bars; n = 4). Response to baseline, treatment challenge or saline infusion in calves after 10 days of treatment exposure was evaluated; treatment means across infusion period are presented. Calves in the Control group were given vehicle (bovine serum albumin) during both the treatment challenge infusion period and as subcutaneous injection for 10 days. Calves in the GLP-2 treatment group were given 3.76 μg/kg BW per h GLP-2 during the treatment challenge infusion period and 100 μg/kg BW per day GLP-2 as subcutaneous injection for 10 days. Values are expressed as μM or μmol/h (means ± s.e.). Significant differences between Treatment (Control v. GLP-2) are denoted by * (α < 0.05). ‡ denotes that a significant treatment by infusion interaction occurred; these interactions are described in the ‘Results’ section.

Day 10 [U13-C]glucose analysis
Glucose irreversible loss was not affected by treatment, although irreversible loss was highest during the baseline period and decreased with the treatment and saline infusions (I; P = 0.002; Table 1). Glucose utilization by PDV and non-PDV tissues was similar among treatments. Thus, the percent of glucose irreversible loss that was accounted for by PDV glucose utilization was also similar among treatments with a mean of 39%. Portal recovery of labeled glucose was decreased (T; P = 0.04) by 10-day of GLP-2 treatment, but hepatic recovery of labeled glucose was not affected by GLP-2 treatment.
Glucose irreversible loss and utilization of PDV and non-PDV tissues in calves treated with Control (n = 3) or GLP-2 (n = 3)
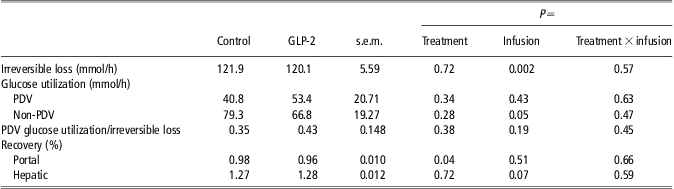
PDV = portal-drained viscera; GLP-2 = glucagon-like peptide-2.
Response to baseline, treatment challenge or saline infusion in calves after 10 days of treatment exposure was evaluated; treatment means across infusion period are presented. Calves in the Control group were given vehicle (bovine serum albumin) during both the treatment challenge infusion period and as subcutaneous injection for 10 days. Calves in the GLP-2 treatment group were given 3.76 μg/kg BW per h GLP-2 during the treatment challenge infusion period and 100 μg/kg BW per day GLP-2 as subcutaneous injection for 10 days.
Discussion
Blood flow
We investigated the effects of GLP-2 on blood flow and nutrient metabolism of the PDV and liver after no or 10-day exposure to exogenous GLP-2. The purpose of this design was to determine whether long-term administration of GLP-2 (10 days) would attenuate the responsiveness of blood flow and nutrient metabolism to a short (1 h) continuous infusion of GLP-2. We previously reported effects of GLP-2 on blood flow of the SMA (Taylor-Edwards et al., Reference Taylor-Edwards, Burrin, Holst, McLeod and Harmon2011), but hepatic portal and venous blood flows are reported here because they are key components in the calculation of net PDV, hepatic and TS nutrient fluxes. Both the short-term infusion and long-term subcutaneous injections were able to achieve pharmacological plasma GLP-2 concentrations (Taylor-Edwards et al., Reference Taylor-Edwards, Burrin, Holst, McLeod and Harmon2011).
An important finding of this experiment was that a short continuous infusion of GLP-2 increased portal blood flow in calves not previously exposed to exogenous GLP-2 (day 0) but not calves that had received GLP-2 for 10 days. The increase in portal blood flow, and similar trend for hepatic blood flow, with the 1-h infusion of GLP-2 in calves not previously exposed to exogenous GLP-2 confirms the increases in SMA blood flow we previously observed in this experiment (Taylor-Edwards et al., Reference Taylor-Edwards, Burrin, Holst, McLeod and Harmon2011) and agrees with effects previously reported in rats and pigs (Guan et al., Reference Guan, Stoll, Lu, Tappenden, Holst, Hartmann and Burrin2003; Deniz et al., Reference Deniz, Bozkurt and Kurtel2007). The diminished treatment effect of GLP-2 on portal and hepatic plasma flow compared with the more significant increase in SMA flow previously observed (Taylor-Edwards et al., Reference Taylor-Edwards, Burrin, Holst, McLeod and Harmon2011) is consistent with observations in rats, pigs and humans, observing that the effects of GLP-2 on blood flow is typically restricted to vessels supplying and draining the intestine, such as the SMA, rather than other vessels such as the celiac artery (Stephens et al., Reference Stephens, Stoll, Cottrell, Chang, Helmrath and Burrin2006; Deniz et al., Reference Deniz, Bozkurt and Kurtel2007; Bremholm et al., Reference Bremholm, Hornum, Andersen and Holst2010). Thus, the increase in portal vein flow with GLP-2 is not as great as the increase observed for SMA blood flow with GLP-2 because of the contribution of blood from non-affected vessels draining into the portal vein. The reduced ability of GLP-2 to increase blood flow in the portal and hepatic veins after a 10-day exposure to exogenous GLP-2 also confirms our observations in the SMA in ruminant calves as previously discussed (Taylor-Edwards et al., Reference Taylor-Edwards, Burrin, Holst, McLeod and Harmon2011).
Nutrient uptake and release on day 0
Despite the significant alterations in blood flow in response to a 1-h infusion of GLP-2 in calves not previously exposed to exogenous GLP-2, few changes in short-term nutrient uptake and release were observed. Short-term GLP-2 infusion did not appear to alter net PDV or hepatic nutrient uptake and release of multiple metabolites. Notably, net PDV glucose and glutamine uptakes were not affected by GLP-2 infusion in calves on day 0. This is in contrast to results observed in piglets fed via total parenteral nutrition (TPN), in which acute (4 h) GLP-2 infusion increased both PDV glucose and glutamine uptake and glucose extraction (Guan et al., Reference Guan, Stoll, Lu, Tappenden, Holst, Hartmann and Burrin2003). Differences between experiments may be the result of several factors. One possibility is the difference in species and physiological status of the animals; the experiment by Guan et al. (Reference Guan, Stoll, Lu, Tappenden, Holst, Hartmann and Burrin2003) utilized neonatal piglets that had been fed exclusively by TPN, whereas our experiment utilized enterally fed calves that, although fasted for 12 h before the infusion protocol, likely had a small amount of nutrient absorption from the gastrointestinal tract because of the long retention time of feedstuffs in the rumen. Because the TPN model is associated with intestinal atrophy (McCauley et al., Reference McCauley, Heel, Christiansen and Hall1996), nutrient uptake and utilization could be substantially different than in a healthy animal. Moreover, the larger stomach complex relative to small intestine in the ruminant may have reduced our ability to detect small changes in flux due to GLP-2 effects in the small intestine. In addition, the length of GLP-2 infusion in this experiment was 1 h, whereas in the experiment by Guan et al. (Reference Guan, Stoll, Lu, Tappenden, Holst, Hartmann and Burrin2003) a 4 h infusion was utilized. Perhaps a greater period of time (or greater total amount of GLP-2 infused) is necessary to observe alterations in PDV nutrient uptake.
Nutrient uptake and release on day 10
Marked changes in net nutrient flux, particularly for amino acids, were apparent after 10-day exposure to GLP-2. Treatment with GLP-2 for 10 days reduced arterial concentrations of alanine, asparagine, glutamine, leucine, lysine, phenylalanine, proline and valine. Similarly, 10-day treatment with GLP-2 reduced net PDV release of alanine, arginine, asparagine, aspartate, glycine, isoleucine, leucine, lysine, phenylalanine, proline and serine. Several measures of intestinal growth previously reported (Taylor-Edwards et al., Reference Taylor-Edwards, Burrin, Holst, McLeod and Harmon2011) were negatively correlated with PDV release of amino acids. For example, jejunal crypt cell BrdU labeling was negatively correlated with PDV release of aspartate, glycine, leucine, lysine, phenylalanine, proline, serine and ornithine (range P = 0.01 to P = 0.0002; R 2 = 0.68 to 0.92). These results suggest that GLP-2 increased growth and resulted in greater sequestration of amino acids in the PDV.
In particular, after 10 days of GLP-2 administration, arterial glutamine concentrations over all infusion periods were 23% to 24% lower with GLP-2 treatment, and net PDV uptake of glutamine was unchanged; thus, the net PDV extraction of glutamine was greater after GLP-2. Similar tendencies were observed for glutamate; arterial concentrations over all infusion periods were 8% to 10% lower, and PDV extraction of glutamate was numerically greater with GLP-2 treatment, particularly during the baseline infusion period. In addition, jejunal epithelial mass, previously reported (Taylor-Edwards et al., Reference Taylor-Edwards, Burrin, Holst, McLeod and Harmon2011), was positively correlated with glutamate net PER (P = 0.03, R 2 = 0.56), and a similar relationship was observed between ileal epithelial mass and PDV net extraction ratio of glutamine (P = 0.01, R 2 = 0.71).These observations are consistent with the increased PDV uptake of indispensable amino acids, greater protein synthesis rates and increased intestinal protein mass after a 4-h infusion period observed in GLP-2-treated piglets maintained on TPN (Guan et al., Reference Guan, Stoll, Lu, Tappenden, Holst, Hartmann and Burrin2003). Another study in TPN-fed pigs receiving a low arginine diet and a continuous 7-day GLP-2 infusion showed that GLP-2 tended to reduce arterial concentrations of aspartate, glutamate and glutamine (Urschel et al., Reference Urschel, Evans, Wilkinson, Pencharz and Ball2007). Collectively, these experiments demonstrate that GLP-2 affects concentrations and/or metabolism of several amino acids, most consistently glutamine.
Amino acids, and particularly glutamine and glutamate, are used by the PDV for protein synthesis but also for growth and intestinal function (Windmueller and Spaeth, Reference Windmueller and Spaeth1974), including synthesis of other amino acids such as arginine, proline, ornithine and citrulline (Bertolo and Burrin, Reference Bertolo and Burrin2008). Indeed, in the current experiment, the only two amino acids observed to have increased arterial concentrations with GLP-2 treatment were arginine and citrulline. Increased arterial citrulline concentrations have also been observed after a 7-day infusion of GLP-2 into TPN-fed piglets (Urschel et al., Reference Urschel, Evans, Wilkinson, Pencharz and Ball2007). In the current study, greater arterial glutamine extraction and reduced PDV ornithine flux may have contributed to increased citrulline export from the gut. Although citrulline PDV flux was not increased by GLP-2 at the time of our measurements, portal citrulline concentrations were 30 mM greater in GLP-2-treated calves than control-treated calves, and it is widely accepted that the intestine is the primary endogenous source of citrulline (Curis et al., Reference Curis, Crenn and Cynober2007). As the primary fate of citrulline is renal conversion to arginine (Curis et al., Reference Curis, Nicolis, Moinard, Osowska, Zerrouk, Benazeth and Cynober2005), increased portal citrulline concentrations likely contributed to elevated arginine concentrations in GLP-2-treated calves. However, despite greater arginine concentrations, PDV arginine release was reduced, again suggesting PDV retention in support of small intestinal mucosal growth.
The use of plasma citrulline concentrations as a marker for various measures of gut mass has been explored for many years (Curis et al., Reference Curis, Crenn and Cynober2007). With 7-day GLP-2 treatment in piglets maintained on a low arginine-TPN, a positive linear relationship was observed between plasma citrulline concentrations and villus height, but not mucosal mass (Urschel et al., Reference Urschel, Evans, Wilkinson, Pencharz and Ball2007). In the current experiment, arterial citrulline concentrations were positively correlated with several measures of intestinal growth previously reported (Taylor-Edwards et al., Reference Taylor-Edwards, Burrin, Holst, McLeod and Harmon2011). Arterial citrulline concentrations were positively related with duodenal BrdU labeling (P = 0.04, R 2 = 0.53), jejunal BrdU labeling (P = 0.01, R 2 = 0.71), duodenal crypt depth (P = 0.02, R 2 = 0.62) and jejunal crypt depth (P = 0.06, R 2 = 0.46), but not other measures of gut mass such as epithelial mass or villus height. Thus, exactly which measures plasma citrulline might be a biomarker for is unclear, and is potentially affected by the species, physiological status, diet, age and a variety of other factors. Our results suggest that in the healthy ruminating calf model, plasma citrulline concentrations might be used as a relative marker for comparing treatment effects on small intestinal growth, particularly when the treatment induces relatively large changes in growth, but many more observations are needed to validate the potential usefulness of this marker.
In addition to their use for protein synthesis and amino acid synthesis, glutamine and glutamate are extensively metabolized for energy; this may be a third explanation for the observed increases in PER of glutamine and similar numeric trend for glutamate. The PDV typically extracts 15% to 33% of arterial glutamine, and of this half to two-thirds is oxidized (Bertolo and Burrin, Reference Bertolo and Burrin2008), whereas 10% to 15% of the glutamine C is recovered in protein or other acid-insoluble materials and the remainder is exported from the PDV as amino or organic acids (Windmueller and Spaeth, Reference Windmueller and Spaeth1974). In addition to glutamine as an energy source, the PDV also actively extracts and oxidizes arterial glutamate to CO2; however, a reduction in net glutamate flux is often not observed because of the high conversion of arterially extracted glutamine to glutamate, which is then exported from the PDV (Battezzati et al., Reference Battezzati, Brillon and Matthews1995).
In contrast to the significant effects of GLP-2 on amino acid metabolism, whole body glucose irreversible loss did not differ between treatments. We hypothesized that glucose utilization by the PDV would increase with GLP-2 treatment. However, the fractional utilization by PDV and non-PDV tissues was 0.35 and 0.43 of glucose irreversible loss, respectively, and was not affected by treatment. This contrasts with TPN-fed piglets, where GLP-2 increased PDV glucose uptake and extraction (Guan et al., Reference Guan, Stoll, Lu, Tappenden, Holst, Hartmann and Burrin2003). One possible reason for a lack of an effect of GLP-2 is the high variability in PDV glucose utilization in this study, perhaps related to the small sample size or inherent animal variability. Another possible reason for a lack of an effect of GLP-2 on PDV glucose utilization may be a result of species adaptations in non-ruminants v. ruminants. Although PDV use of glucose is significant, ruminants also rely on energy substrates in addition to glucose to spare glucose for vital functions. Availability of substrates such as glutamate, glutamine, propionate and butyrate reduced glucose oxidation in ovine duodenal mucosal cells without reducing glucose uptake (Oba et al., Reference Oba, Baldwin and Bequette2004). Thus, the energy to support GLP-2-induced small intestinal growth may be preferentially provided by increased glutamine extraction rather than glucose.
However, hepatic glucose and lactate metabolism may have been altered by 10-day exposure to GLP-2. Calves given 10 days of GLP-2 had greater net hepatic lactate extraction but reduced net hepatic glucose release compared with control calves, which may have contributed to the reduced arterial glucose concentrations observed in GLP-2-treated calves. Hepatic glucose release is primarily a result of gluconeogenesis and glycogenolysis, and one major factor influencing the rate of gluconeogenesis is the availability of gluconeogenic substrates such as propionate, lactate, glycerol, and amino acids, primarily alanine and glutamine (Bergman and Heitmann, Reference Bergman and Heitmann1978). Propionate is unlikely to be a large gluconeogenic precursor because of the fasted state of the calves in the present study. In cows fasted for 1 day, the contribution of propionate to hepatic glucose output decreased from 46% to 15%, but the contribution of lactate increased from 16% to 42% (Lomax and Baird, Reference Lomax and Baird1983). Plasma alanine and glutamine arterial concentrations and net PDV flux of alanine were reduced with GLP-2 treatment, thus reducing the availability of these substrates for hepatic gluconeogenesis. Thus, in the fasted state and with increased PDV utilization of amino acids, lactate may have become a primary substrate for hepatic gluconeogenesis. Net hepatic glucose output was positively correlated with net hepatic lactate uptake (P = 0.02, R 2 = 0.18). This reduction in lactate uptake and the reduced availability of alanine and glutamine for gluconeogenesis could explain a lower net hepatic output of glucose. In humans, GLP-2 modestly increases secretion of glucagon from the pancreas (Sorensen et al., Reference Sorensen, Flint, Raben, Hartmann, Holst and Astrup2003; Meier et al., Reference Meier, Nauck, Pott, Heinze, Goetze, Bulut, Schmidt, Gallwitz and Holst2006), which would be expected to increase hepatic glucose output, in contrast to our observations. Although glucagon was not measured in this experiment, our observations of reduced hepatic glucose output with GLP-2 could imply a different response of the ruminant pancreas to GLP-2 than in non-ruminant species.
This research is the first to evaluate both the short- and long-term effects of GLP-2 on blood flow and net nutrient flux. The GLP-2-induced small intestinal growth is mediated by a variety of growth factors that may interact with splanchnic amino acid metabolism. Understanding how GLP-2 interacts with these endocrine and paracrine hormones will occupy many future experiments. In addition, how GLP-2 impacts the availability of nutrients from the gastrointestinal tract may ultimately determine its application.
In summary, this experiment demonstrates that ruminants respond to GLP-2 administration in a similar manner to non-ruminants. We show that GLP-2 infusion increases blood flow of the portal and hepatic veins when administered to calves not previously exposed to exogenous GLP-2. However, we have confirmed our previous observation that a 10 day administration of GLP-2 attenuates this blood flow response substantially. Flux of amino acids across the PDV is affected by GLP-2, potentially by increased small intestinal epithelial growth and thus energy and amino acid requirements of this tissue. Increased PDV extraction of glutamine and alterations in PDV metabolism of arginine, ornithine and citrulline support the concept that intestine-specific amino acid metabolism is affected by GLP-2. However, unchanged glucose utilization suggests that GLP-2 effects on PDV glucose metabolism in ruminants are transient or less significant than for non-ruminants.
Acknowledgments
The authors express gratitude to Julie Cannon, Melissa Hudson, Samer El-Kadi, Alma True, Jimmy Klotz, Anne Koontz and Anne Ballou for assistance with sample collection, to Xioayan Chang and Leiwei Cui for assistance with immunohistochemistry and morphology measurements, and to Winston Lin for plasma analysis assistance. Support for this research was provided by the Kentucky Agricultural Experiment Station and is Publication No. 11-07-061. This work was supported in part by federal funds from the U.S. Department of Agriculture, Agricultural Research Service under Cooperative Agreement Number 58-6250-6-001 between USDA/ARS Children's Nutrition Research Center, Department of Pediatrics, Baylor College of Medicine and Texas Children's Hospital and by Texas Medical Center Digestive Diseases Center (NIH Grant P30 DK-56338). This manuscript was written by C. C. Taylor-Edwards in her private capacity. No official support or endorsement by the FDA is intended or should be inferred.