




I. Introduction
Urbanization fosters social interaction because it concentrates human settlement. This must have been especially true in pre-industrial cities, which were often as densely populated as they were unequal. Conversely, the economic costs of urban sprawl and social separation decreased when industrialization modernized urban planning and transportation infrastructure. As a result, urban sociology incorporated a keen interest in residential segregation during its development, and in its wake housing location has become – through the mediation of such longue durée theorists of urbanization as Gideon Sjoberg, James Vance and Carl Nightingale – one of the primary axes along which urban historians have investigated spatial inequality.Footnote 1
Yet, precisely due to their compactness, the rule in past cities was probably geographic mixing rather than geographic separation. This article therefore hypothesizes that housing scarcity was more important than housing location in the spatial manifestation of socio-economic inequalities. Moreover, unequal access to residential space, unlike its geographic distribution over the city, would have had a clear impact on affordable housing and thus on living standards. This article examines residential inequality in a growing pre-industrial city where housing was mostly organized through the market. The case study is in fact a close approximation of Vance’s ‘capitalist city’, shaped neither by ‘pre-capitalist’ associations like occupational guilds nor by the greater state involvement that characterizes modern ‘post-capitalist’ cities. What form did spatial inequality take in pre-industrial urban housing markets, and what, if any, were the impacts on housing affordability and the standard of living?
Early modern Amsterdam stands out for its spectacular urban growth as well as its high levels of income and wealth inequality.Footnote 2 In the century spanning the Dutch Golden Age, the population of the Dutch city multiplied at least seven-fold, from a maximum of 30,000 inhabitants in 1578 to a minimum of 210,000 in 1680.Footnote 3 In the same period four phases of urban extension sought to accommodate the massive influx of migrants, who spanned the socio-economic spectrum and ranged from wealthy merchants and skilled artisans from the south to poor sailors and labourers from the east.Footnote 4 It was in the seventeenth century, during the so-called Third (1610–13) and Fourth Extensions (1655–63), that Amsterdam’s famous belt of canals was created alongside a number of mixed-purpose neighbourhoods on the urban periphery (see Figure 1). Still, the built surface area of the city ‘only’ expanded by a factor of five, which means that on average households had to make do with less living space – despite, or perhaps because of, the construction of large townhouses for the wealthiest households along the new canals.Footnote 5
Amsterdam’s urban extensions, 1585–1663.
Notes: Landmarks: 1) IJ Estuary, 2) Amstel River, 3) Dam Square, 4) Stock Exchange, 5) Plantage, 6) Golden Bend, 7) House Bartolotti. Streets and canals: D = Damrak, R = Rokin, OB = Oudezijds Voorburgwal and Oudezijds Achterburgwal, GK = Geldersekade, KB = Kloverniersburgwal, S = Singel, HG = Herengracht, KG = Keizersgracht, PG = Prinsengracht, KS = Kerkstraat, WS = Weesperstraat.

Figure 1. Long description
A historical plan of Amsterdam’s urban development. The map uses a colour-coded legend to show growth phases: red for the core before 1500, orange for the first extension (1585 to 1586), yellow for the second extension (1592 to 1593), green for the third extension (1610 to 1613), and blue for the fourth extension (1655 to 1663). White areas represent undeveloped land, and grey areas represent public land.
At the center (red core) are landmarks: 3 (Dam Square), 4 (Stock Exchange), R (Rokin), D (Damrak), and O B (Oudezijds Voorburgwal and Achterburgwal). To the South is 1 (I J Estuary). Moving West and North are the concentric canal rings: S (Singel), H G (Herengracht), K G (Keizersgracht), and P G (Prinsengracht).
To the Northwest, the blue fourth extension includes K S (Kerkstraat) and landmark 6 (Golden Bend). To the East, the green third extension includes landmark 7 (House Bartolotti). On the far West side, a large grey area marked 5 (Plantage) sits near W S (Weesperstraat). The Amstel River (2) enters from the Northwest. A scale bar in the top right indicates 0 to 500 meters, and a North arrow points toward the top right corner.
Indications like this, which suggest a causal relation between urban growth and disparities in housing size, have received little attention from social historians of the pre-industrial city. Their interest in housing inequality has focused instead on residential segregation.Footnote 6 Amsterdam and Holland have figured prominently in this research, which, however, has so far remained limited to analysing the degree of spatial separation at the neighbourhood (macro) and street (meso) level.Footnote 7 On the basis of geolocated distributions of buildings’ rental values in six towns in Holland, Amsterdam included, Clé Lesger has demonstrated that the consistent effort of commercial elites to create socially homogeneous neighbourhoods over the early modern period was largely thwarted by the existence of side streets that housed members of the middle and a part of the working classes. This was no less true in Amsterdam’s canal belt, which nonetheless achieved ‘the highest possible level of residential segregation’ in Holland.Footnote 8 In a large and growing city like Amsterdam, urban expansion would have created an opportunity for rich and powerful residents to carve out a more homogenous elite quarter and push industrial activity and cheap housing to the edge of town.
This article innovates empirically by adding a micro-level view to this body of research, as it constitutes the first systematic study incorporating residential inequality ‘behind the façade’ before the nineteenth century.Footnote 9 This innovation is called for, especially in Amsterdam, as there the manifold existence of single-room homes is revealed by contemporary sources. At the close of the Fourth Extension in 1665, Tobias van Domselaer observed that residential buildings were often compartmentalized into separate housing units, particularly, but not exclusively, in lower-class neighbourhoods.Footnote 10 And in the notarial archives of the city, witness testimonies and probate inventories suggest that a growing share of the urban population came to live in apartment-style dwellings as the city expanded.Footnote 11 By the time urban growth was over and the population stabilized in the 1730s, as we will see, just over half of Amsterdam’s households lived in a house. By 1805 that majority had turned into a minority. This situation would only start to reverse with modern urban expansion at the turn of the twentieth century.Footnote 12
In this context, clearly, a fine-grained analysis incorporating the micro-level alone can give a full picture of residential segregation.Footnote 13 It also permits an exploration of other aspects of residential inequality beyond location, such as population density and housing affordability. Although a variety of sources are employed to this end, a register containing the rental values of Amsterdam’s complete housing stock published in 1734 lies at the empirical heart of this article.Footnote 14 The source originated from a tax reform whereby the States of Holland ordered the town magistrate to update the rental values of residential buildings, which had long served as a basis for taxation. In 53 out of 60 urban districts, compartmentalization was systematically reported; and in 45 districts, evenly distributed across the city, tax officials recorded (or, in case of home ownership, estimated) rental values at the building level as well as the actual residential unit level. For around three-quarters of the city, then, more than 35,000 rental prices reveal Amsterdam’s near complete housing distribution. The supplementary Appendix describes these and comparable data from 1561 and 1805 in further detail.
Despite its unique window into the urban hierarchy, it should be stressed that the 1734 distribution of housing rents is limited to Amsterdam’s household population. The sick, elderly and orphaned inhabitants of civic institutions are not included, nor are mobile urban dwellers residing in lodging houses or on anchored ships. The source does not discriminate between renting and home-owning households, but nor does it offer any insights into variations in household size and composition. Domestic servants living in with their masters were part of the residential space occupied by wealthier families, for instance, while on the other end of the socio-economic spectrum, unrelated paupers could have pooled their meagre incomes and huddled together in a one-room dwelling. Tax officials accepted the prevailing market framework of housing configurations: rental contracts delineated residential units and thus also defined the contours of the household. Housing could also have varied according to the lifecycle. These demographic factors obviously may nuance or strengthen the empirical results, but unfortunately they cannot be controlled for here.Footnote 15 So long as it is remembered that the analysis is limited to socio-economic (not demographic) inequalities between households, however, it remains true that the micro-level data provide an unprecedented view of housing conditions in pre-industrial towns. Other studies have shed more light on patterns of cohabitation in early modern urban households but miss the granular spatial variation of housing typologies examined in this article.Footnote 16
Theoretically, the case study fits in a larger ambition to understand spatial inequality in capitalist cities. When urban land comes to be treated primarily as a source of income, Vance proposed in a seminal article from 1971, compartmentalization is incentivized, leading to the mixing of social and economic classes. But because signifying status is less self-evident for commercial than for aristocratic elites, the desire for social distinction simultaneously stimulates the quest for an exclusive residential quarter among these mercantile elites.Footnote 17 The tension between the two contrary forces is here investigated in a prime example of a capitalist city. Amsterdam functioned as the centre of global capitalism in the seventeenth and a large part of the eighteenth centuries. Moreover, unlike cities that occupied this position earlier or later, like Venice and London, it did not house a significant landed aristocracy.Footnote 18 The city council consequently operated on thoroughly capitalist principles, as seen, for instance, in its open-door policy towards immigration but also in Holland’s provincial tax system, which, as we will see, presupposed real estate’s income function.Footnote 19 In urban planning, too, profit maximization often overruled the wishes of wealthy residents. After building plots were sold housing regulation was limited, but less so during the Fourth than during the Third Extension.Footnote 20 This enables a comparative analysis that seems virtually impossible in ‘post-capitalist’ modern cities, formed as they are by extensive planning and regulation.
Section II disentangles income and housing inequality, which have been confounded in housing rent studies about the pre-industrial Low Countries. The inequality of rental values remained remarkably stable in early modern Amsterdam, which, on the one hand, understates the rise in income inequality and, on the other, overlooks the emerging contrast between canal townhouses and compartmentalized dwellings. Section III qualifies meso-level research, showing that all but the most limited ‘around the corner’ segregation was impossible considering the scarcity of private urban space and the capitalist embedding of housing markets. Micro-level compartmentalization conformed to the known meso-level pattern because its market incentives were greatest for property owners in alleys and lesser streets, yet a clearcut social segmentation by street was nonetheless only achieved with the extensive urban planning and zoning regulations of the Fourth Extension. To the extent that it was shaped by private housing markets, in short, residential inequality in growing pre-industrial cities was more likely to have been expressed in housing size than in geographic separation. The final section demonstrates that urban growth alone cannot account for this process, at least in the present case study, as housing inequality kept growing in tandem with income inequality after Amsterdam’s population and building stock had stopped expanding. Housing costs consequently remained elevated in the second half of the eighteenth century, resulting in a crisis of housing affordability that contributed to a lowering of living standards for a majority of the urban population. This, in turn, paved the way for urban decline starting around the turn of the nineteenth century.
II. Urban growth and housing size
In pre-industrial cities demographic growth is a simple, but also a reliable, indicator of economic performance. Urban growth was only possible to the extent that there was an increase in the demand for labour, and thus ultimately in production, consumption and commerce. From this perspective alone, economic growth must have been spectacular in Golden Age Amsterdam, which exploded demographically from 25,000–30,000 inhabitants when the city joined the Dutch Revolt in 1578 to 160,000–175,000 at the height of its power in 1650.Footnote 21 At that point the only bigger European cities were Constantinople, Paris and London, which unlike Amsterdam were all capital cities as well as commercial metropoles. After the mid-seventeenth century, urban and economic growth slowed down but continued until the 1730s, when the population peaked at 220,000–240,000 inhabitants.Footnote 22 Comparative research with London, which would overtake Amsterdam’s position as the centre of European finance and trade towards the end of the eighteenth century, has demonstrated that urban stagnation was in the first place a result of the declining availability of immigrant labour reserves in Amsterdam’s hinterland. It was, in other words, the supply of, rather than the demand for, labour that started to decrease in the second half of the seventeenth century.Footnote 23 Labourers could therefore bargain for relatively high wages until deep into the eighteenth century, as Amsterdam became a ‘safety valve’ for poor migrants when other towns in Holland started to restrict immigration and enter a process of demographic and economic decline.Footnote 24
The relative stability of working-class purchasing power did not prevent a rise in inequality, however. The former was a remarkable feat for early modern Europe, where the overall trend was one of decreasing real incomes for wage labourers. But even if the poor did not get poorer, the growing gap that separated the rich from the societies in which they were rooted was a defining trend of the times.Footnote 25 In Amsterdam it found its most visible expression on the social level in the form of conspicuous consumption. In the third quarter of the seventeenth century the construction boom of the Fourth Extension helped alleviate a temporary setback in the city’s international trade. And in the last quarter of the century, when commerce found new sources of growth in transit and colonial trade, Amsterdam’s occupational structure reveals that the display of wealth shifted from the construction of splendid townhouses to the luxury industries more broadly.Footnote 26 This is confirmed by demand-side research into notarial probate inventories, which show a clear shift towards investment in quality and ornamentation in the domestic material culture of the upper middle classes and elites around the turn of the eighteenth century.Footnote 27 In the public domain, too, more and more carriages appeared on the streets connecting the canal townhouses with life outside the city, and in 1736 long-standing attempts to ban wheeled vehicles in favour of sledges were abandoned.Footnote 28
Rising social inequality was grounded in rising economic inequality. To measure changes in income disparities, historians of the pre-industrial Low Countries have long used tax records based on residential rental values. These Verpondingen did not discriminate between leased and owner-occupied housing, because as a rule tax officials used existing rental contracts as a point of departure and subsequently relied on that market knowledge to estimate the rent that would have been charged if the remaining properties were sublet instead of being used by the owners themselves.Footnote 29 The taxation methodology thus reveals that the allocation of housing, like much of Holland’s economy, was organized by markets, for the apparent ubiquity of rental markets enabled the estimation of adjacent non-rental homes.Footnote 30 This is also implicitly clear from the tax instructions, which, in wanting to stress that no type of building was to be exempted, found it useful to stipulate that all real estate out of which ‘any fruit or income’ could feasibly be derived was to be charged.Footnote 31 Whether ‘small or big’, the States of Holland declared in their announcement of the Verponding reform in 1730, ‘all houses […] out of which rent or profit comes’ had to be taxed.Footnote 32 In practice this meant all non-public buildings, including commercial ones, which were discarded from the sample wherever possible.
Yet, the rent-based tax registers still underestimate inequality, as the rich generally spend a smaller share of their earnings on housing than less affluent households. On the assumption that the income elasticity of the demand for housing stayed stable over time, these fiscal sources have nonetheless laid the foundation for economic inequality comparisons within and beyond the Low Countries.Footnote 33 I have shown elsewhere that this assumption does not hold for early modern Amsterdam by calculating alternative estimates constructed from data on wages, salaries and occupational structure. This more direct measure of what we might term ‘labour income inequality’, which may still underestimate actual inequality due to the absence of capital earnings, shows a rise in the Gini-coefficient from 0.73 in 1620 to 0.79 in 1665 and 0.81 in 1710.Footnote 34 These Ginis are far above those of any contemporary country worldwide and rank among the highest income inequality estimates recorded in all of history.Footnote 35
For their part, the available early modern rental value distributions show housing inequality to already have been much higher in Amsterdam than elsewhere in the region in 1561, but from the eve of the first urban extension all the way until the end of the population boom in 1734 it appears to have barely grown further – from 0.55 to 0.56. The distribution of rents may in fact have widened more during urban stagnation, with the Gini reaching 0.59 in 1805. Due to gaps in the data, however, these estimates have to be interpreted with caution (see Appendix).
Suffice it to conclude that, despite the parallel rise in population and income inequality, the five-fold multiplication of Amsterdam’s built surface area did not lead to a commensurate increase in the already high inequality of housing rents over the seventeenth century. At the top of the urban hierarchy, this means that the splendour of canal townhouses reveals only the tip of the iceberg of the commercial elite’s enrichment. In its bottom half, by contrast, the rental value distributions mask monumental changes in the urban morphology. When turning the focus of analysis from housing costs to housing types, indeed, a marked increase in spatial inequality emerges.
Table 1 shows the typological distribution of housing as far as it is discernible from early modern rent-based tax records. The changes over time should be interpreted carefully because the 1734 and 1805 micro-level data do not cover the whole city, but the basic pattern is clear.Footnote 36 In 1561 a mere 2.3 per cent of households can be identified as occupants of rooms, basements or attics, although underestimation in this source is plausible because housing unit types may not have been systematically identified.Footnote 37 This low percentage was probably not far from reality, however, because the number of housing plots on the eve of the First Extension (1585–86) has been estimated at around 6,000, similar to the number of housing units recorded in the 1561 tax.Footnote 38 The subsequent jump to 39.6 per cent by 1734 is thus unmistakable. Attics generally retained their function as storage rather than living space, but when Amsterdam reached its demographic peak, one out of every eight households lived in a basement. More than a quarter even had to make do with nothing more than a kamer (room), although it is unclear whether this was in fact always a one- rather than a multiple-room apartment. The ‘other’ group represents intermediary housing typologies extending over parts of a building (e.g. backhouses), while unidentified sub-building dwellings (e.g. ‘in three parties’) are included in the ‘unspecified’ column. Both of these miscellaneous categories refer to compartmentalized housing. According to the 1734 records, in short, only a slim majority of Amsterdam households lived in a proper house in the second quarter of the eighteenth century.
Distribution (%) of housing typologies in rent-based taxes, 1561–1805.

Table 1. Long description
The table contains nine columns: Year, Obs. (Observations), percent of building stock, House, Room, Basement, Attic, Other, and Unspecified.
* Year 1561: 5,906 observations representing 100.0 percent of building stock. Typology distribution is 97.7 percent House, 1.2 percent Room, 0.9 percent Basement, and 0.2 percent Attic. Other and Unspecified are not recorded.
* Year 1734: 42,176 observations representing 88.5 percent of building stock. Typology distribution is 50.9 percent House, 26.5 percent Room, 12.3 percent Basement, 0.8 percent Attic, 2.5 percent Other, and 7.0 percent Unspecified.
* Year 1805: 35,987 observations representing 75.8 percent of building stock. Typology distribution is 48.3 percent House, 35.5 percent Room, 12.6 percent Basement, 1.3 percent Attic, 1.5 percent Other, and 0.8 percent Unspecified.
The data shows a significant shift from houses being the dominant typology in 1561 to a more diverse mix including rooms and basements by 1805.
Notes: Out of a total of 60 districts, 53 are included in the 1734 and 44 in the 1805 calculations. Total building stock is not known for 1805 due to missing building level data in the excluded districts, so the third column is based on the 1734 building stock, which can only have been marginally different from the reality in 1805.
Source: See Appendix.
By 1805 the share of households residing in a house had dropped below 50 per cent, but the most significant change arising from the sources was the expansion of room dwellings to more than one-third of the housing stock. Part of that change is a statistical artefact, for many of these additional rooms probably already existed in the 1730s but had been left unspecified by tax officials. Still, in Table 1 the ‘room’ category gains more percentage points than the ‘unspecified’ group loses, which indicates that urban stagnation failed to halt the compartmentalization process completely. While the relative decline of houses points to enduring downward housing mobility among the middling sorts, the fact that both the ‘unspecified’ and ‘other’ categories lose ground in favour of rooms, basements and attics suggests that households lower down the urban hierarchy continued to downsize as well. Larger compartmentalized housing units, for instance covering one floor of a building, may have been further broken up into several dwellings. This is corroborated by the evolution in the number of housing units per building in the districts covered by micro-level data in both 1734 and 1805. The average unit-to-building ratio between these overlapping districts increases slightly, from 1.90 to 1.96, although the city-wide pattern conceals a larger degree of local variation. The compartmentalization onslaught seems to have strongly persisted, especially in districts within the medieval bounds of the city but also in parts of the town erected during the Fourth Extension. In many of the western districts dating from the Third Extension, in contrast, the average number of housing units per building actually declined over the second half of the eighteenth century (see Table A.1 in the Appendix).
It is clear, at any rate, that the lower classes bore the brunt of the growing scarcity of living space. While in the sixteenth century labouring households could still occupy a small house, for instance in a side street or alley, new generations of working-class families were crowded into the basements and rooms that proliferated in alleyways, side streets and even along the canals. This is evident from Figure 2, which pinpoints all addresses from the 1734 distribution that contained more than one home against the backdrop of a heatmap visualizing the geographic distribution of household density. The general complementarity of the two layers is striking: compartmentalization was most common where many households already congregated, not where there was most space for it. The fragmentation of the housing stock thus had no levelling effect on housing size inequality. Instead, it amplified unequal access to residential space.
Heatmap of household density and buildings accommodating multiple households in Amsterdam, 1734.
Note: Non-residential buildings and units were included in the heatmap to mitigate distortions resulting from the geographic clustering of commercial and storage facilities.
Source: See Appendix.

Figure 2. Long description
A geographical heatmap of Amsterdam in 1734, bounded by a jagged, fortified outer wall and the IJ river to the North. The density is represented by a colour gradient where dark red and black dots indicate high household density, transitioning through orange and yellow to light blue for low density.
* At the centre of the map, the medieval core shows the highest density, with concentrated dark red and black clusters.
* Moving outward to the West and South, the three main concentric canal rings (Herengracht, Keizersgracht, and Prinsengracht) show high density along the canal fronts, with lower density (blue and yellow) in the interior garden spaces of the blocks.
* In the East and Southeast, density remains high but more fragmented, with several large black rectangular blocks indicating non-residential or high-occupancy industrial zones.
* To the West, a large grey rectangular area represents an undeveloped or non-residential district.
* The harbour area to the North and the various islands in the Southwest show lower density, with many buildings rendered in white or light green.
* A scale bar in the top right corner indicates 0, 250, and 500 m, accompanied by a North arrow pointing toward the top right.
Urban expansion, too, facilitated this spatial inequality. Subdivided buildings could be found everywhere in the medieval town, but they were especially concentrated in side streets and alleys. Here, as in the extended city, owners of canal townhouses generally resisted the incentives to compartmentalize their real estate. The dense concentration of multi-household buildings to the east of the centre and beyond the canal belt demonstrates that the urban extensions of the late sixteenth and seventeenth centuries alleviated part of this demographic pressure. Room and basement residences nonetheless penetrated the canal district, particularly in the outer two belts of housing blocks enclosed between the Singel and Herengracht and between the Keizersgracht and Prinsengracht, and especially on their perpendicular streets where traffic and shopping concentrated. But even in some parts of the inner belt between the Herengracht and Keizersgracht, which constituted the prestigious core of the canal district, the degree of compartmentalization rivalled or even surpassed that along the Damrak/Rokin-axis in the city centre. It was especially pronounced in some of the western sections built during the Third Extension, while the Fourth Extension parts of the Herengracht and Keizersgracht in the south of the city remained virtually free of subdivided housing units.
Yet, the entire canal belt clearly stands out for its low household density. Even in the western sections where basements or attics were sometimes rented out, the sheer size of townhouse plots provided a share of scarce urban space for luxury housing and back gardens that had not been accessible to the rich within the medieval walls. Population density was comparably sparse only in some peripheral mixed-purpose areas that remained underdeveloped in the 1730s and were meant for port and industrial activities as well as cheap housing. In general, however, the canal belt contrasts sharply with other town additions, and it is in the extended city that both the most spacious and most crowded neighbourhoods were to be found. Amsterdam’s expansion, in other words, enabled its growing income inequality to be spatially manifested in unequal access to living space. But did it also enable a greater degree of residential segregation?
III. Urban planning and social segregation
When nineteenth- and twentieth-century historians looked back in awe at seventeenth-century Amsterdam, one of the fastest growing cities of its time, they imagined it as the ‘Versailles of the North’, the outcome of a masterplan designed by a small number of architectural geniuses, including Daniel Stalpaert and Hendrick de Keyser. The reality was more complex, as archival research into the decision-making process has shown. Amsterdam’s expansion was ‘not an autonomous piece of art’, according to Jaap Evert Abrahamse, but rather ‘the result of interaction, and sometimes confrontation, of spontaneous urbanization and planned intervention’.Footnote 39 A large degree of urban planning was necessary to extend the town’s surface, but in this, various military, environmental, logistic, legal, economic and social interests had to be accounted for. The solution to this balancing exercise was to largely restrict post-planning government intervention to constructing streets and digging canals, which was already a momentous and costly undertaking. Once the new building plots were auctioned off, regulation was limited, and on the whole urbanization was allowed to proceed spontaneously.
It is true that the authorities envisioned that ‘the properties on the Herengracht should be built with nice residences and houses for people of private means and other wealthy people’ during the Third Extension.Footnote 40 But the only action they initially undertook at the policy level was to prohibit the parcellation of building plots by means of private alley construction on this canal and its slightly less prestigious counterpart, the Keizersgracht. Everywhere else in the city alleyways were allowed to proliferate for decades or (in the case of its medieval bounds) centuries before a general ban was issued in 1643. From that point onwards, the explicit approval of the city council was needed for the construction of new streets and pathways. Similarly, it was not until 1652 that all industrial establishments were banned from the ‘middle and best part of the city’ – that is, from the Keizersgracht in the west to the Kloverniersburgwal and Geldersekade in the east. Again, it concerned only new developments, not the existing urban fabric. As a result, factories had emerged during the Third Extension along the newly erected canals. There was, for example, a sugar refinery in operation in the early seventeenth century next to House Bartolotti, one of the largest and most prestigious residences of the Herengracht, which was bought, torn down and replaced with a fashionable house by the merchant and Dutch West India Company director Michiel Pauw in 1638. The area around this townhouse stood out for its persistently low level of compartmentalization, too (see Figure 2). Most other existing industrial establishments in the western canal belt disappeared in the first half of the seventeenth century through similar processes of wealthy residents buying out factory owners. The development of the Third Extension sections of the inner canal belt as a purely residential district was thus first and foremost a consequence of self-regulation.Footnote 41
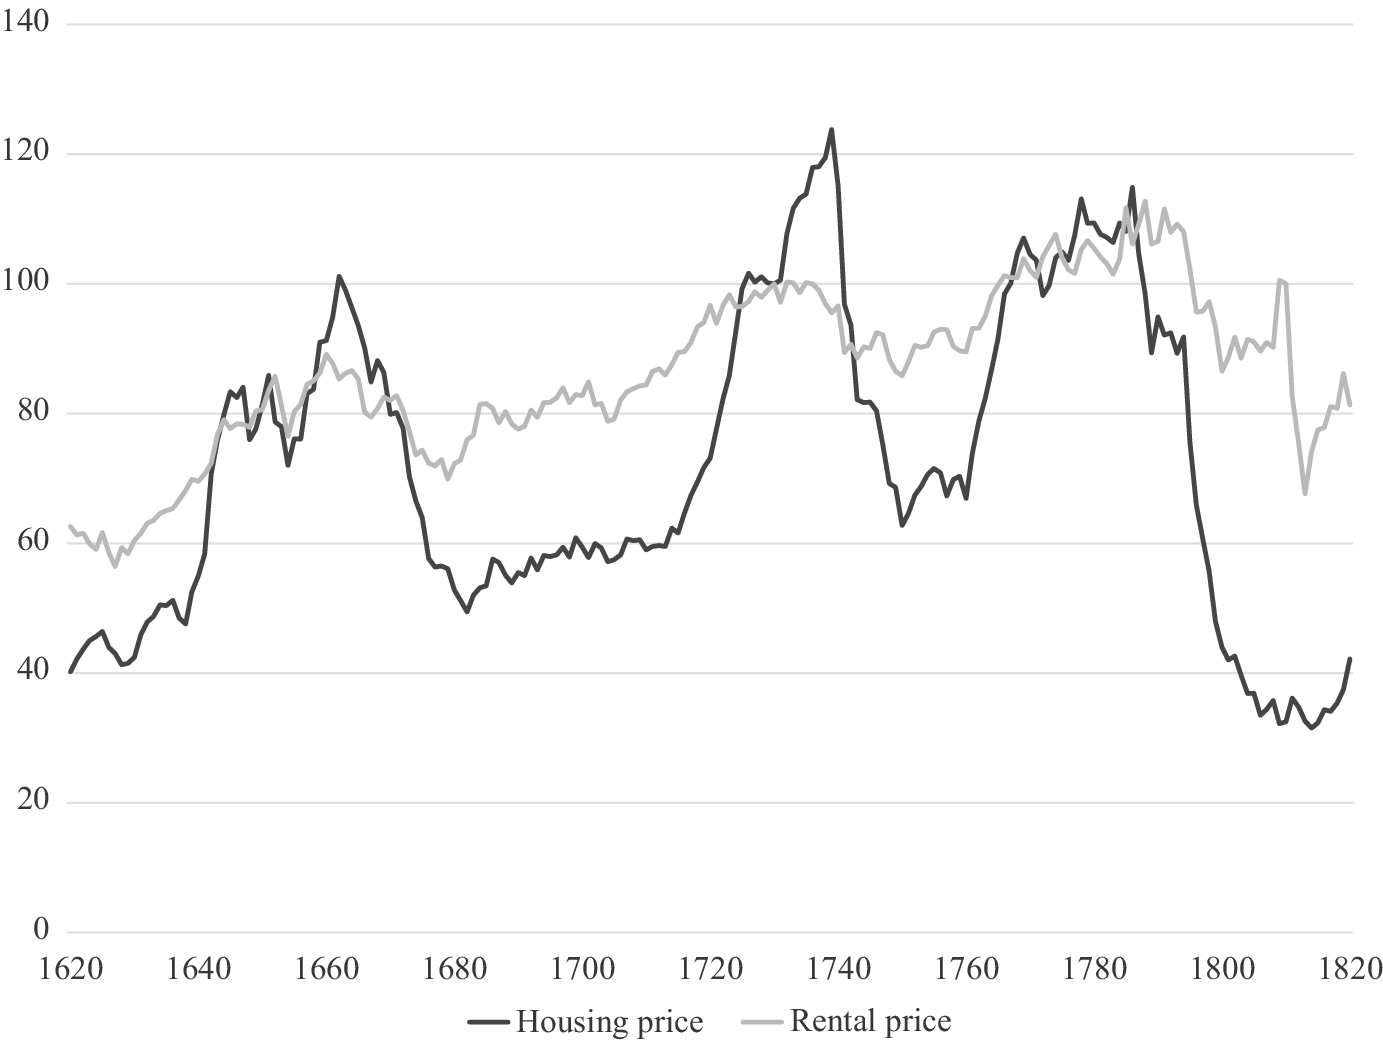
Although an industry-free zone at the macro-level and a city-wide prohibition on ‘horizontal’ parcellation on the meso-level were legislated in the mid-seventeenth century, throughout the early modern period there appear to have been no clear micro-level restrictions on the ‘vertical’ compartmentalization of residential buildings once they had come into existence. Wealthy residents were allowed to buy several adjacent plots to construct canal palaces, but in the course of time real estate owners could also divide their property into several rental units that housed one or more families on each floor. The fact that such a large part of the housing stock consisted of subdivided buildings by the 1730s indicates that the acquisition of real estate must have often been motivated by investment rather than consumption purposes. Indeed, already by 1561 a minority of housing units were owner-occupied, at 41.2 per cent, and by 1805, that figure had shrunk to 19.0 per cent.Footnote 42 These shares were much lower than the concurrent percentage of houses in the city (see Table 1), so renting must have been common across the urban hierarchy. From the property owners’ perspective, real estate was therefore a potential source of income, made more lucrative by the scarcity of living space. Housing rents accordingly grew steadily over the early modern period in Amsterdam, as Figure 3 shows, while the boom-and-bust evolution of housing prices suggests that the market was beset by speculation practices.
Index of housing and rental prices in Amsterdam, 1620–1820 (1730=100).
Source: M. Korevaar, P. Eicholtz and M. Franke, ‘Dure huizen maar geen zeepbel in Amsterdam’, Economische Statistische Berichten, 106 (2021), 32–4; P. Eicholtz, M. Korevaar and T. Lindenthal, ‘Limited growth: 500 years of urban rents’, SSRN Working Paper (2019). See also P. Eicholtz, S. Straetmans and M. Theebe, ‘The Amsterdam rent index: the housing market and the economy, 1550–1850’, Journal of Housing Economics, 21 (2012), 269–82. Both datasets can be downloaded from Matthijs Korevaar’s website: https://sites.google.com/view/matthijskorevaar/data.

Figure 3. Long description
The x-axis represents years from 1620 to 1820 in 20-year increments. The y-axis represents an index value from 0 to 140 in increments of 20. Two lines are plotted.
* The Housing price line, shown in black, exhibits high volatility. It starts near 40 in 1620, peaks around 100 in 1660, and drops to 50 by 1680. It rises sharply to its highest peak of approximately 125 around 1740, followed by a steep decline to 65 by 1750. It recovers to 115 around 1790 before crashing to its lowest point of 30 by 1810.
* The Rental price line, shown in light grey, is more stable with a gradual upward trend. It starts near 60 in 1620, fluctuates between 70 and 90 throughout the 1600s, and reaches a plateau near 100 between 1720 and 1740. It remains relatively steady between 90 and 110 until 1800, where it shows a sharp dip to 70 before recovering toward 85 by 1820.
The two lines intersect multiple times, notably around 1645, 1725, and 1785.
Real estate capitalists faced conflicting demands for housing, however. The uptick in conspicuous consumption during the seventeenth century reflects the growing desire among the rich for an elite quarter composed exclusively of large townhouses. The creation of a residential zone encompassing ‘the middle and best part of the city’ made the medieval town and canal belt district equally attractive to less well-off households, however. Their settlement around the corner from the luxurious canal townhouses was made possible by the existence of cross and back streets for the middling sorts and of alleyways for the working classes, as meso-level research has shown. A micro-level analysis confirms this residential mixing but highlights the proximity of rich and poor housing even more.
This can be seen in Figure 4, which uses inverse distance weighting to interpolate the most probable rental value of pixel-sized surfaces based on surrounding data points. The idea behind this mapping methodology is to make a cluttered GIS-layer of noisy quantitative data with a lot of local variation more readable by averaging out individual values. The raw data and inverse distance weighting both create a mosaic, but the latter uses larger pixels and generates a result that is more easily interpretable – or picturesque, metaphorically speaking. The relative influence of the rental values of proximate versus distant housing units can be regulated in this algorithmic aggregation technique. If this power parameter is set low, the influence of distant but high (outlier) rents increases, smoothing over proximate but low rents. The upshot would be a more levelled macro-picture which pinpoints wealthy enclaves but overlooks smaller concentrations of poor housing that could occur within their borders, for instance in alleyways. Conversely, if the power parameter is maximized, as in Figure 4, proximity is prioritized, rendering a localized result that produces a more disordered picture but brings the map closer to the messiness of historical reality. This option ensures that the map reflects the diversity of households living at close quarters. The fine-grained view of interpolation is complemented by Figure 5, which ranks housing blocks into quartiles according to their median rental value. The percentile medians separating the block distribution in four are 54.5 (25 per cent), 100.1 (50 per cent) and 200.0 (50 per cent) Dutch guilders. This more distant level of analysis brings into view the average household that lived ‘around the corner’ – on side and back streets or in alleys, as well as in upper-floor and basement units – from the wealthier households occupying the best houses on the main streets or along the canals. The 1 per cent highest-priced homes (with rental values above 1,096.2 Dutch guilders) are also geolocated in Figure 5.

Figure 4. Long description
A geographical map of Amsterdam’s urban layout in 1734. The city is bounded to the South by a large body of water and enclosed by a fortified, jagged perimeter wall to the West, North, and East. A scale bar in the Northeast indicates 0, 250, and 500 m.
At the centre of the map is the medieval core, characterized by dense, irregular blocks. Moving outward, the city expands into a semi-circular pattern defined by three major concentric canal rings.
Rental values are represented by a colour gradient: deep red indicates the highest values, orange and yellow represent mid-range values, and blue indicates the lowest values. Solid black areas represent non-residential or unvalued plots.
The highest rental values (deep red) are concentrated along the primary concentric canal rings, particularly in the Western and Southern arcs. The values gradually transition to yellow and blue as the distance from these prestigious canals increases toward the outer perimeter.
In the West, large rectangular blocks are predominantly black or light blue. To the South, the harbour area features several long, thin piers extending into the water, marked with black and white rectangular sections. The Eastern side of the city shows a more fragmented distribution of mid-to-low rental values interspersed with black industrial or utility zones.
Median rents of housing blocks and priciest homes in Amsterdam, 1734.
Source: See Appendix.

Figure 5. Long description
A historical map of Amsterdam divided into housing blocks coloured by rent quartiles in Dutch guilders.
Legend in the Northwest:
* Red square: greater than 1096.2 (top 1 percent).
* Orange: greater than 200.0 (Q 4).
* Yellow: 100.1 to 200.0 (Q 3).
* Light green: 54.5 to 100.1 (Q 2).
* Blue: less than 54.5 (Q 1).
* Black: blocks with no data.
Spatial Distribution:
* The core of the city and the inner canal rings (Grachtengordel) are dominated by orange (Q 4) and yellow (Q 3) blocks.
* The highest concentration of red squares (top 1 percent priciest homes) is found along the Herengracht, Keizersgracht, and Prinsengracht canals, particularly in the Southern and Western arcs.
* Lower-rent blue (Q 1) and green (Q 2) blocks are concentrated in the Jordaan neighbourhood to the West and the eastern islands.
* The city is bounded by a jagged, star-shaped fortification wall to the North, East, and West, with the IJ waterway at the South.
* A scale bar in the Northeast indicates 0 to 500 m, accompanied by a North-pointing arrow.
The interpolation map shows some expected and some surprising results. The concentration of the most expensive locations alongside the city’s canals comes as no surprise. Proximity to waterways was clearly one of the common denominators behind upscale housing. The broad appeal of the centre was less expected, as comparable interpolation maps based on building values were suggestive of a more comprehensive move of the rich towards the canal belt in the course of the eighteenth century.Footnote 43 With the exception of the southern canal belt, however, the centrifugal gravitation of upper-quartile housing blocks in Figure 5 confirms that in the first half of the eighteenth century the centre was still appealing to a broader group of affluent households, which must have counted many petty merchants as well as members of the industrious middle classes among their ranks. Only the top 1 per cent of priciest homes was at this point already largely concentrated in the canal district. A pervasive withdrawal of the upper classes from the commercial and financial heart of the city had not yet transpired, however. Unlike a century later, when it had lost its competitive edge to London, in the 1730s Amsterdam was still first and foremost a commercial city oriented around its economic heart.
If high-income households were spread out between the main streets and canals of the city, the middling sorts were even more dispersed. Wherever red pixels (the most expensive locations) dot Figure 4, orange and yellow pixels (middle-range locations) can be found at close quarters, usually on the cross and back streets from the more prestigious block faces. But so, as a rule, can green and blue pixels indicating a concentration of housing for the bottom half of the urban population. Although the labouring masses most often found a home in peripheral districts beyond the canal belt towards the western and southern edge of town as well as east of the centre in the vicinity of the harbour, pockets of poor housing were scattered across the ‘middle and best part of the city’, too. They could be found in the outer block ranges of the canal belt, between the Prinsengracht and the Keizersgracht and between the Herengracht and the Singel, and in most parts of the medieval town. In these areas, low-rent pixels were generally located on the lesser block faces and especially in the middle of residential blocks, where alleyway housing dominated. Since compartmentalization was more common in these lesser streets and alleys than along the main streets and canals, the ‘around the corner’ segregation of meso-level research is accentuated.
Three upscale ranges of residential blocks were less socially mixed and had a median housing unit rental value of more than 200 Dutch guilders: the inner canal belt between the Herengracht and Keizersgracht, the central Damrak/Rokin axis and the housing blocks enclosed between the Oudezijds Voorburgwal and Oudezijds Achterburgwal. Not coincidentally, these chains of housing blocks were not pierced with alleys, and they also stand out for their relatively low degrees of compartmentalization (see Figure 2). Among the parts covered by the micro-level data, therefore, most of their housing blocks belonged to the upper rental quartile. That was the case for all but three of the 26 blocks alongside the central axis connecting the IJ Estuary to the Amstel River, as well as for all eight blocks between the two burgwallen. In the inner belt of the canal district, however, the predominant household status differed somewhat between the Third and Fourth Extension sections. In the latter all covered blocks were part of the top 25 per cent. In contrast, only four out of six housing blocks of the Third Extension were included in the upper quartile, as the high degree of compartmentalization in the side streets and, to a lesser degree, along the canals gave two western blocks a more middling character. Behind them the blocks between the Keizersgracht and Prinsengracht were even dominated by lower middling sorts belonging to the bottom half of the household population.
The key takeaway here is that, despite the partial ban on alleys, Amsterdam’s Third Extension did not, in the long run, generate a degree of residential segregation which surpassed that of the most prestigious locations in the centre. A more segmented block face structure that consistently separated canal townhouses for the upper classes from the smaller dwellings of shopkeepers and other middling sorts on the side and back streets was only fully realized during the Fourth Extension. In the second half of the seventeenth century many of Amsterdam’s wealthiest inhabitants moved from the western to the newly constructed southern canal belt. On the north side of the Herengracht’s Golden Bend or on the south side of the extended Keizersgracht, they could now build horse stables and entrances for domestic personnel on the backside Reguliersdwarsstraat and Kerkstraat. The Kerkstraat, in turn, functioned as the border of a new high-end residential neighbourhood, beyond which a dense network of streets had to accommodate urban industries as well as cheap housing.Footnote 44 This extensive street planning was preceded by the city-wide zoning regulations and parcellation restrictions introduced just a few years before. Backed up by a greater degree of government intervention, the Fourth Extension came much closer to creating exclusive canal boulevards than self-regulation had allowed for in the Third Extension sections of the Herengracht and Keizersgracht.
Plausibly the western canal belt had initially had a more exclusive character, too, only to fall prey to the compartmentalization onslaught as the urban population kept growing at a dramatic pace in the middle decades of the seventeenth century. That demographic pressure was slowing down as the Fourth Extension got underway, which is an additional factor in the higher degree of segregation of the southern canal belt that should be kept in mind. East of the Amstel, the end of the construction boom is symbolized by the Plantage, which was created to rent out private pleasure gardens after the demand for new upscale residential plots had petered out.Footnote 45 Even with plans to complete the canal hemisphere abrogated and parts of the newly created urban space dedicated to public institutions, however, most of the residential plots between the Weesperstraat and the Plantage were still empty in the 1730s and would remain so for the remainder of the century. Concatenated building blocks only emerged on the Weesperstraat itself, which gradually developed as a traffic artery and shopping street.Footnote 46 Strikingly, above and below the street’s shops, compartmentalized housing proliferated despite the wasteland that lay undeveloped only a few metres away (see Figure 2). Unlike the demand for the construction of high-end townhouses, clearly, the demand for cheap housing was not yet exhausted.
This observation offers qualified support for Vance’s critique of capitalist real estate markets, where, he claimed, new housing is reserved for the rich while the lower classes are left to secure housing through a filtering-down process.Footnote 47 The rapid erection of socially mixed neighbourhoods on the edge of town in tandem with the construction of the canal belt puts the validity of his model into question, as does the failure of affluent households to relocate decisively from the old centre to the newly constructed periphery. Profit was generally more important than status to the merchant elites that dominated both the housing market and the city council. The need for revenue to pay for the urban extensions stimulated the city council to offer much freedom to buyers of residential plots, who were sooner or later incentivized to divide up their property into multiple residences to maximize rental income. This obstructed all but the most limited form of residential segregation. After the demand for new quality housing for the rich receded, on the other hand, capitalists stopped short of building new housing for the poor, which remained in short supply. The building plots were available, and there certainly was no shortage of capital in Amsterdam, but without government subsidy, opportunity costs were apparently stacked against residential projects targeted at the lower classes. Such projects could have alleviated the rising cost of housing for the working classes, but they simply lacked the purchasing power – or rent-paying ability, in Vance’s terms – to channel capital in this direction. The final section turns to the eighteenth-century housing affordability crisis that was consequently not mitigated.
IV. Urban stagnation and housing affordability
In Vance’s model of capitalist cities, rent-paying ability determines the quality and location of housing. The incentive to compartmentalize residential space to augment profit in the form of rental income, mentioned by Vance himself as a product of capitalist housing markets, in fact undermines the efficacy of residential segregation. In early modern Amsterdam, rising income inequality had a much more profound impact on housing size, as has become clear in the previous sections. This section investigates why housing inequality, as understood in this spatial sense, continued to worsen during the eighteenth century. Urban growth alone cannot account for the increasing share of households that came to live in rooms, because this percentage continued to rise when both the built surface area and population of Amsterdam no longer expanded (see Table 1). The inequality of housing rents also appears to have increased further under conditions of stagnation. Was this just a reflection of decreasing living standards, whereby the economic slowdown affected the purchasing power of middling households and hence their ability to hold on to their houses? Or was the crisis in housing affordability also induced from the top down, as a result of conspicuous consumption by urban elites?
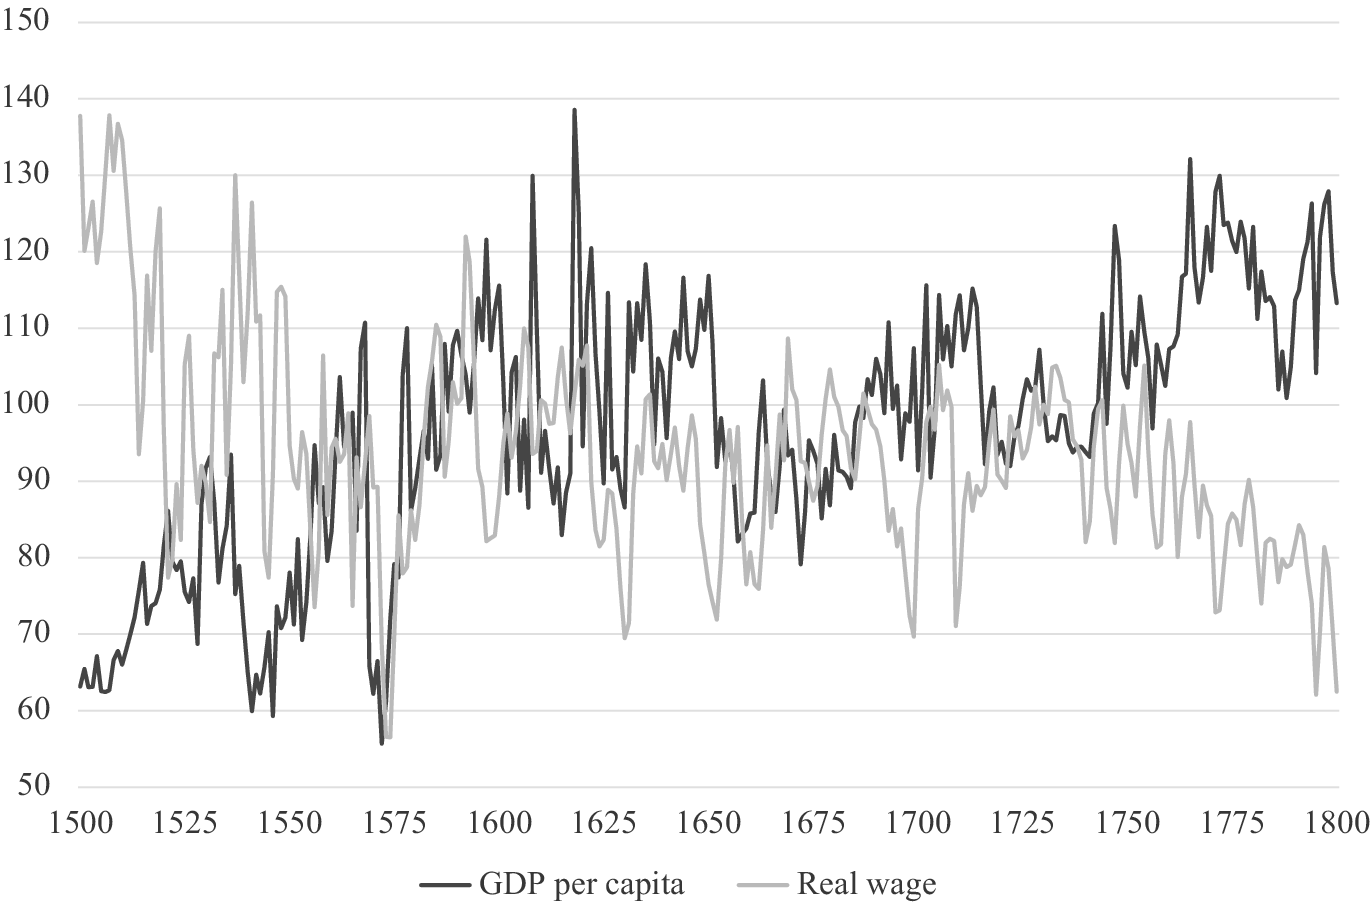
At first glance the second possibility appears unlikely considering the construction stoppage, which would suggest that elite housing demand tapered off in the last decades of the seventeenth century. But why, then, if we turn back to Figure 3, did housing rents continue to increase until the very end of the eighteenth century, save for two setbacks during the economic crises of the 1660s and 1740s? The available data suggest that this trend is representative across the socio-economic spectrum, whereas one would expect decreasing purchasing power to push down rental prices of lower-class dwellings in a context where all else appeared equal.Footnote 48 But all else was not equal. The evidence of decreasing real incomes in the second half of the eighteenth century, resulting from stagnant wages in the face of general price inflation, is unequivocal, but so is that of a renewed round of economic growth centred around the agricultural, colonial and financial sectors from which urban labourers derived little benefit.Footnote 49 In other words, income inequality was still increasing, but this time the poor were getting poorer while the rich were still getting richer (see Figure 6). The stability of the population and the unaltered volume of the housing stock moreover mask changes in supply and demand. On the supply side, the persistent volatility of housing prices shows that real estate investment in the existing housing stock was twice reinvigorated in the eighteenth century, despite the standstill in construction, and Figure 3 also shows that each successive speculation boom temporarily elevated rental prices. But a closer look at the elasticity of demand suggests that pressure on housing markets endured due to patterns in elite consumption as well.
GDP per capita and unskilled wage rate in Holland, 1500–1800 (1730=100).
Source: Van Zanden and Van Leeuwen, ‘Persistent’; Van Zanden, ‘What happened’.

Figure 6. Long description
The horizontal X axis represents years from 1500 to 1800 in 25 year increments. The vertical Y axis represents an index value ranging from 50 to 150 in increments of 10. Two lines are plotted.
* G D P per capita (black line) starts at approximately 65 in 1500 and shows a long-term upward trend with significant volatility. It reaches a major peak near 140 around 1620, fluctuates between 80 and 120 for the next century, and ends with a strong upward surge toward 130 by 1800.
* Real wage (light grey line) starts at a high point near 140 in 1500 and shows a long-term downward trend. It experiences sharp fluctuations, dropping below 60 around 1575, recovering briefly to 120 around 1600, and then gradually declining with several peaks and troughs. By 1800, it falls to its lowest point near 60.
The two lines show an inverse relationship over the long term, particularly visible after 1750 where G D P per capita rises sharply while real wages decline significantly.
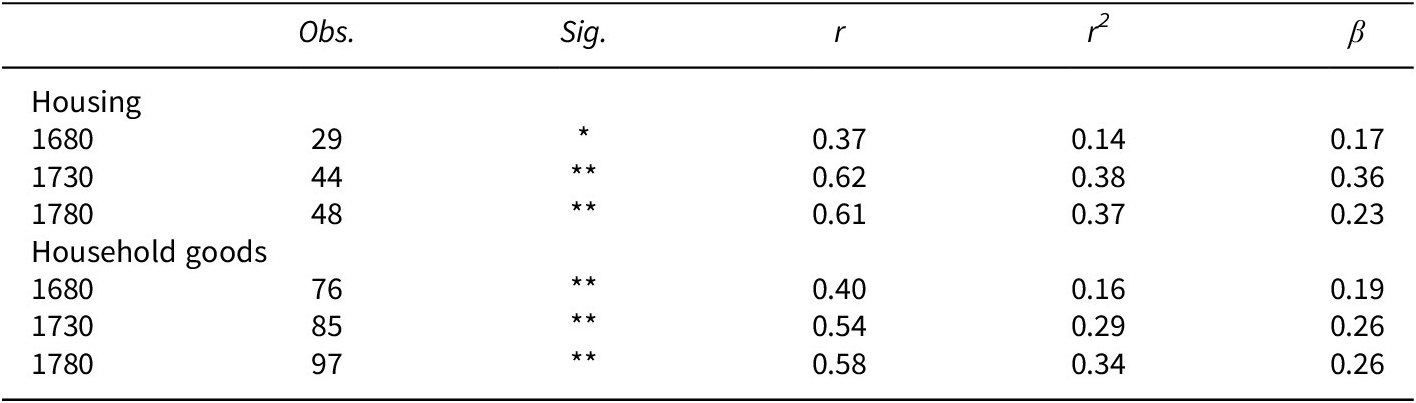
The evolving relation between wealth and housing consumption can be gleaned from a small but detailed dataset of probate inventories from Amsterdam’s notarial archives. Table 2 estimates the wealth elasticity of demand for housing and household goods through two logarithmic regression models that calculate to what extent and how much the rental worth of homes and the value of recorded movables (dependent variables) were determined by the value of assets like real property, government bonds, cash and capital goods (independent variable).Footnote 50 The fact that the regression coefficient (β) was consistently far below unity (i.e. 1) indicates that propertied households spent a decreasing share of their wealth gains on housing and interior decoration as they moved up the economic hierarchy. Unsurprisingly, capital returns were more often reinvested than consumed.Footnote 51 What is surprising, however, is that this decrease slowed downed from the late seventeenth into the eighteenth century for both housing and household goods, while the doubling of the determination coefficient (r2) further indicates that the deviation from the trend line declined in the two models. This implies that a larger share of wealth ‘materialized’ in housing and interior decoration in the eighteenth century, and that fewer wealthy households retained a semblance of frugality. These are clear signs of conspicuous consumption. Moreover its timing indicates that the pressure that the rich exerted on the housing market did not halt with the end of the construction boom in the final decades of the seventeenth century – it merely shifted to the existing housing stock.Footnote 52
Wealth elasticity of demand for housing and household goods

Table 2. Long description
The table is divided into two main sections: Housing and Household goods. Each section contains data for the years 1680, 1730, and 1780 across five statistical columns: Obs. (Observations), Sig. (Significance), r (Pearson’s correlation coefficient), r super 2 (determination coefficient), and beta (regression coefficient).
Section 1: Housing
- 1680: 29 Obs., Sig. asterisk (p < 0.05), r 0.37, r super 2 0.14, beta 0.17.
- 1730: 44 Obs., Sig. double asterisk (p < 0.01), r 0.62, r super 2 0.38, beta 0.36.
- 1780: 48 Obs., Sig. double asterisk (p < 0.01), r 0.61, r super 2 0.37, beta 0.23.
Section 2: Household goods
- 1680: 76 Obs., Sig. double asterisk (p < 0.01), r 0.40, r super 2 0.16, beta 0.19.
- 1730: 85 Obs., Sig. double asterisk (p < 0.01), r 0.54, r super 2 0.29, beta 0.26.
- 1780: 97 Obs., Sig. double asterisk (p < 0.01), r 0.58, r super 2 0.34, beta 0.26.
Notes: * p<0.05, ** p<0.01, r = Pearson’s correlation coefficient, r2 = determination coefficient, β = regression coefficient.
Source: Centre for Urban History, unpublished database of Amsterdam probate inventories.
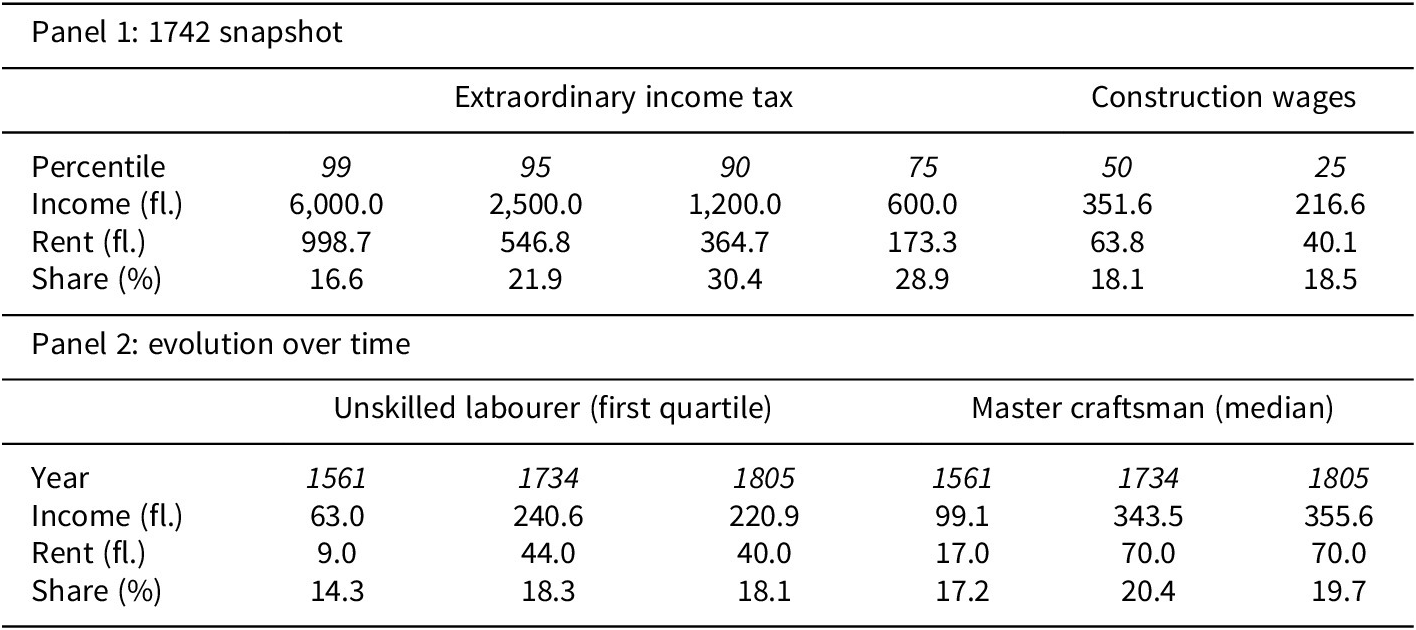
Only a limited share of metropolitan households possessed wealth, of course. The impact of the greater eighteenth-century appetite for luxury housing on the rest of the urban population is better understood by looking at the correlation of income and housing expenditures. Section II has already demonstrated that income inequality grew more than rental inequality over the seventeenth century, implying that only a small share of the growth of upper incomes flowed to housing. For its part, working-class purchasing power stayed constant until the mid-eighteenth century, but this, as we have seen, did not prevent a decrease in housing size for successive generations of labouring families. In 1742, an extraordinary income tax levied on approximately the highest earning quarter of Amsterdam’s population can, when combined with wage data of master craftsmen and unskilled labourers employed in Holland’s construction industries, explicate the elasticity of the demand for housing across the income hierarchy. Table 3 assumes that the wages of these craftsmen and labourers are representative, respectively, of the median and first quartile of the housing/income distribution. On the numerator side, the rental distribution from 1734 was deflated to 1742 values with an existing price index of Amsterdam rents; the small dip in rental prices in this period (see Figure 3) was thus accounted for.Footnote 53 For our quintessential craftsman and labourer, Table 3 also tracks the share of annual earnings allocated to housing costs over the three early modern rental distributions. In this way, the evolution in housing affordability for middle- and lower-income groups can be estimated.
Estimates of housing share of annual income

Table 3. Long description
Panel 1: 1742 snapshot. This panel compares income and rent across six percentiles.
* Percentile 99: Income 6,000.0 fl., Rent 998.7 fl., Share 16.6 percent.
* Percentile 95: Income 2,500.0 fl., Rent 546.8 fl., Share 21.9 percent.
* Percentile 90: Income 1,200.0 fl., Rent 364.7 fl., Share 30.4 percent.
* Percentile 75: Income 600.0 fl., Rent 173.3 fl., Share 28.9 percent.
* Percentile 50: Income 351.6 fl., Rent 63.8 fl., Share 18.1 percent.
* Percentile 25: Income 216.6 fl., Rent 40.1 fl., Share 18.5 percent.
Panel 2: Evolution over time. This panel tracks two worker types across the years 1561, 1734, and 1805.
* Unskilled laborer (first quartile):
- 1561: Income 63.0 fl., Rent 9.0 fl., Share 14.3 percent.
- 1734: Income 240.6 fl., Rent 44.0 fl., Share 18.3 percent.
- 1805: Income 220.9 fl., Rent 40.0 fl., Share 18.1 percent.
* Master craftsman (median):
- 1561: Income 99.1 fl., Rent 17.0 fl., Share 17.2 percent.
- 1734: Income 343.5 fl., Rent 70.0 fl., Share 20.4 percent.
- 1805: Income 355.6 fl., Rent 70.0 fl., Share 19.7 percent.
Notes: 1) Annual income of labourers represent 250 summer day wages. 2) In panel 1, rent is the 1734 distribution deflated with the Amsterdam rent index. 3) Dutch guilders = fl.
Sources: Appendix [rents]; A. de Jong, T. Kooijmans and P. Koudijs, ‘Going for broke: bank reputation and the performance of opaque securities’, Journal of Finance (forthcoming, 2026) [extraordinary income tax]; J. de Vries and A. van der Woude, The First Modern Economy: Success, Failure, and Perseverance of the Dutch Economy, 1500–1815 (Cambridge, 1997), 610–1 [construction wages].
The 1742 snapshot in panel 1 of Table 3 shows that the pressure of housing costs on household expenditures rose across the income distribution but peaked and declined among the top 10 per cent. Before potential supplementary incomes, for instance from working wives, both a typical labouring household and a typical middling household living in mid-eighteenth-century Amsterdam would have had to devote around 18 per cent of male annual earnings to rent, more than double what is usually assumed in real-wage series.Footnote 54 As a household climbed out of the bottom half of the population and enlarged its purchasing power, the share of its growing annual budget allocated to housing increased, from less than one-fifth for a middle-income family to almost one-third for a household at the ninth decile. It was only in the top income decile that households started to spend a smaller share on housing: in the top 5 per cent it dipped below 20 per cent – at a similar level as the working classes.
The downward turn at the high-income end of this inverted u-shape distribution confirms that rental inequality underestimates income inequality. It shows that this was particularly the case at the very top of society, where much of the inequality growth of the seventeenth century was concentrated.Footnote 55 The magnificent canal palaces that the urban elites erected in seventeenth-century Amsterdam, in other words, accounted for a relatively small share of their earnings. Their remaining income was reinvested in commercial, financial or real estate markets to build even more wealth or otherwise had to find other outlets of conspicuous consumption. The same 1742 tax indeed teaches us that the top 10 per cent in mid-eighteenth-century Amsterdam possessed 100.0 per cent of the country houses and 99.6 per cent of the horses recorded in the source. They also employed 75.7 per cent of the 11,711 domestic servants who worked for the highest-earning quarter of the household population. And yet, part of their conspicuous consumption was in the form of housing, as the growing correlation with wealth indicates. The upper classes did not expand in size, and therefore demand for new townhouses was saturated, but their enlarged housing aspirations nonetheless increased aggregate demand within the existing housing stock, which stayed constant.
For the middle classes that presumably emulated the top 10 per cent, the upshot can be read in the long upward slope of the share of income allocated to housing in panel 1 of Table 3. The more one moves down the 1742 distribution, however, the more the only gradually declining shares start to look less like comfortable housing budgets for a prosperous middle class and more like desperate attempts to maintain housing status in the face of shrinking purchasing power. At the middle of the distribution, master craftsmen had increased their housing expenditures from 17.2 to 23.2 per cent between 1561 and 1734, as seen from panel 2 in Table 3. The qualitative difference, of course, was that a median income had easily afforded a house within the boundaries of mid-sixteenth-century Amsterdam, whereas the larger allocation in the mid-eighteenth century only covered a house of the worst quality in the crowded metropolis. In the following half-century our middle-income household had to give up even that house, despite maintaining its elevated housing expenditures.
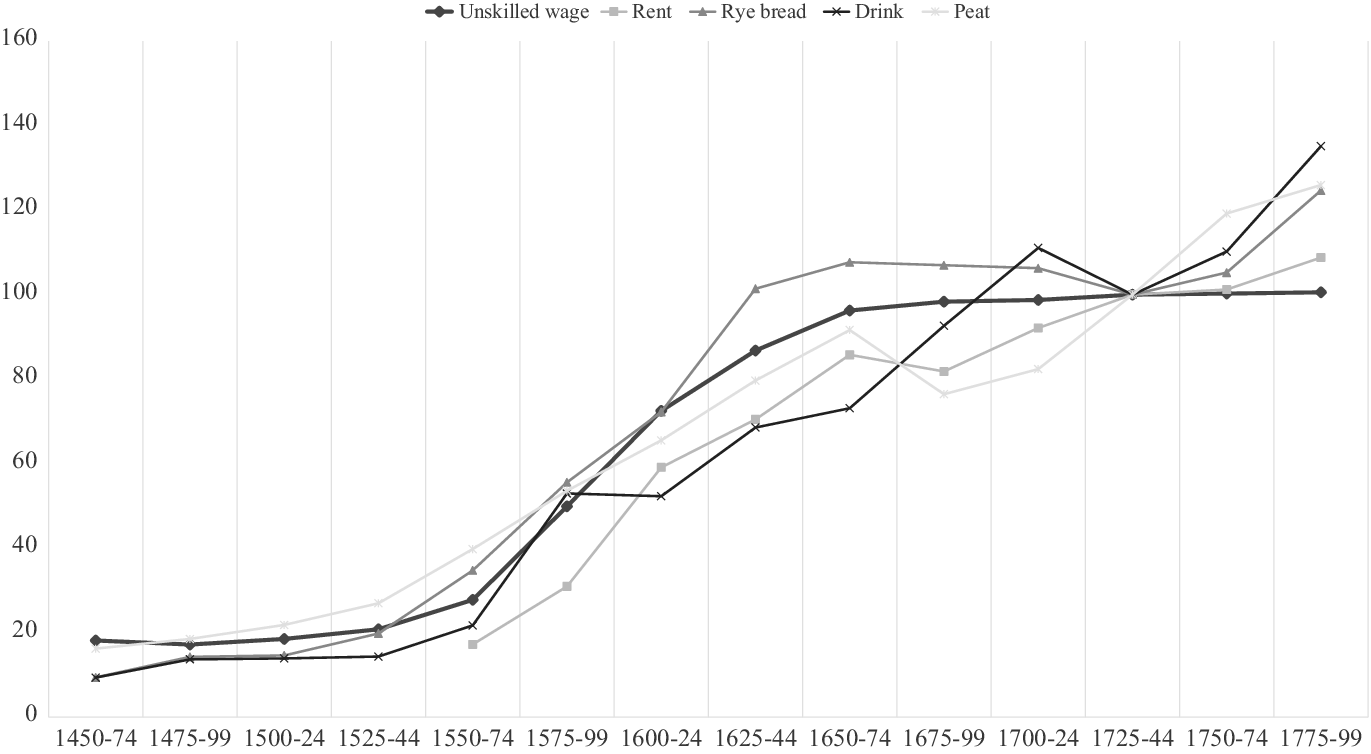
The downward mobility of middling households, in turn, increased the competition for compartmentalized housing at the bottom half of the urban hierarchy. Following this altered demand structure, room dwellings expanded to over one-third of the housing supply during the second half of the eighteenth century (see Table 1). In the preceding period of urban growth panel 2 in Table 3 shows that the housing share of labouring incomes had climbed in tandem with that of middling households, from 14.3 per cent in 1561 to 18.3 per cent in 1734. And for working-class families, too, relative housing costs had not decreased below that elevated level by 1805. Crucially, however, their real earnings were now declining after almost two centuries of stable purchasing power. While persistently rising housing rents played an important role in this trend, price inflation in the second half of the eighteenth century also affected many other necessities, like foodstuffs and fuel (see Figure 7). This time the growing inflationary pressure on the labouring household budget could not be mitigated by a downgrade in housing, as the working classes were already concentrated in one-room, slum-like dwellings. Allocating almost one-fifth of their earnings to housing was the price to pay for not becoming homeless. The alternative was to emigrate out of the city, as many urban dwellers – disproportionately inhabitants of working-class neighbourhoods – did in the early nineteenth century.Footnote 56 Only at that point did housing and rental prices collapse (see Figure 3).
Price indices and unskilled wages in Holland, 1450–1800 (1725–44=100).)
Source: Van Zanden, ‘What happened’.

Figure 7. Long description
The horizontal X axis represents time in 25 year intervals from 1450-74 to 1775-99. The vertical Y axis represents an index where 1725-44 equals 100, ranging from 0 to 160.
All five series (Unskilled wage, Rent, Rye bread, Drink, and Peat) begin at low levels between 10 and 20 index points in 1450.
* Unskilled wage: Shows a steady linear increase starting around 1525, reaching a plateau near 100 by 1650 and remaining flat through 1800.
* Rye bread: Rises sharply between 1525 and 1625, peaking above 100, then fluctuates slightly before ending at approximately 125.
* Drink: Remains the lowest index until 1550, then follows a steep upward trajectory, surpassing all other indices by 1775-99 to end at approximately 135.
* Peat: Follows a similar upward trend to wages but experiences a dip between 1650 and 1700 before rising to 125 by the end of the period.
* Rent: Data begins later in 1550-74 at index 20, rising steadily to meet the other indices at the 100 point baseline in 1725-44, ending slightly above 100.
All lines converge at the index value of 100 during the 1725-44 reference period.
V. Conclusion
Today, Amsterdam is often seen as an overcrowded city, housing up to 100 inhabitants per hectare of built-up urban space. Population density was slightly higher in the early sixteenth century, but with the onset of urban growth it soared to more than 450 inhabitants per hectare in the eighteenth century.Footnote 57 In the poorest parts of town not 450 individuals but 450 (or more) households huddled together in a hectare of residential space.Footnote 58 In the twenty-first century tourists can still marvel at the famous canal townhouses that the commercial elite imposed on this scarce urban space, but contemporaries, like Tobias van Domselaer, found the way in which the poor were stuffed together in overcrowded buildings equally ‘unbelievable’.Footnote 59 Thanks to a unique source that unveils the location and value of these cheap dwellings, which have long disappeared from the cityscape, this article has offered new insights into housing inequality during pre-industrial urban growth. As in other cases of city growth before the nineteenth century, demographic expansion outpaced the extension of the urban surface. The fact that urban growth went hand-in-hand with rising economic and social inequality also conforms to common patterns. This article has investigated how that uptick in inequality was spatially manifested in the increasingly scarce residential space of early modern Amsterdam.
Two spatial forms of housing inequality were examined: residential segregation and housing size. What emerges, overall, is the need to shift attention from the former to the latter. A central factor in both was the fragmentation of residential space, whether horizontally by opening up alleyways or vertically by dividing buildings floor by floor. Compact residences appeared all over the city map as Amsterdam expanded in size and population, but, crucially, they continued to proliferate over a prolonged period in which both the population and volume of the housing stock remained stable. The persistence of this trend implies that its causes must be sought in rising inequality as well as in growing population density.
The effects of residential fragmentation from a social perspective were beneficial in one way and detrimental in another. It led to a large degree of geographic mixing, which made meaningful segregation impossible even in the parts of the canal belt district and the city centre where the richest households lived. In this sense the results correspond closely to Emily Chung’s recent research on nineteenth-century Manchester, which was as much the archetypical industrial city as eighteenth-century Amsterdam was the paradigm capitalist city. This article, too, compels historians to reconsider the extent to which pre-modern segregation should be understood specifically as a spatial phenomenon.Footnote 60 Although the merchant elites in early modern Amsterdam did not manage to carve out a socially exclusive residential quarter, however, compartmentalization did enable them to monopolize an ever-increasing share of private urban space. While a relatively small percentage of their income and wealth afforded them spacious townhouses along the city’s canals, the mounting pressure that they in the process placed on housing affordability led to a decline in living standards for the rest of the urban population. At best, less well-off households were forced to allocate an increasing share of their earnings to housing. At worst, as was the eventual fate for a majority of households, they were forced to move from houses to alley backhouses, damp basements and cramped apartments. These findings not only appear strikingly relevant for understanding current issues of housing affordability, they also call for more attention to housing costs in the study of historical living standards.Footnote 61
What, finally, does this case study teach us about housing inequality in capitalist cities? The merchant elites that presumably owned much of the residential real estate and constituted the regent class which governed the city had the power to shape both the supply of and the demand for housing. They thus faced a trade-off between their role as profit-seeking capitalists and status-aspiring consumers. In private investment as well as in public policy, commercial incentives generally weighed heavier than social distinction desires, however, resulting in limited regulation and persistent residential mixing as the city expanded in size and population. A somewhat larger degree of social differentiation was achieved during the Fourth Extension, which, in its reliance on more extensive urban planning and regulation, unveils the importance of state intervention in facilitating residential segregation. Thus, it was only the later emergence of ‘post-capitalist’ forms of urbanization following the industrial revolution that produced ‘massive geographical segregation rather than interweaving’.Footnote 62 The reformist spirit calling for greater state intervention in the housing market, on the other hand, did arise in genuine reaction to slum development in capitalist cities.Footnote 63 In this regard, the paradox of empty building plots in the overcrowded Amsterdam of the eighteenth century is suggestive of the apparent constraints of free housing markets in provisioning affordable housing for the poor. More supply-side research is needed to unravel that conundrum.
Supplementary material
The supplementary material for this article can be found at http://doi.org/10.1017/S0963926826101072.
Acknowledgments
I would like to thank Matthijs Korevaar and Gabri van Tussenbroek for sharing invaluable data with me. My gratitude also goes to Clé Lesger, Martijn Collijs, Bob Pierik, Bas van Bavel and Auke Rijpma for their insightful comments, as well as to Iason Jongepier for tips and tricks on GIS software and to Mark Raat and Hans Mol for providing pre-cadastral XY coordinates of historical addresses. Colleagues at the Posthumus Institute and the Economic and Social History research group of Utrecht University are also thanked for feedback.
Funding statement
Open access funding provided by Utrecht University.
Competing interests
The author declares none.







 Open access

