> slip systems. In the (100) orientation, only two of the four {101}<10
 > slip systems, along with {100}<0
 0> slip, are activated. Because the four {101}<10
 > slip systems in the (001) orientation intersect, the surface is harder and exhibits higher hardening rates after the nucleation of dislocations. The latter are manifested by pop-ins, some of which are large. The pop-in stresses are adequately described by Weibull statistics and were significantly higher for the (001) orientation. The elastic moduli, determined from spherical NI stiffness versus contact radii plots, were 349 ± 5 and 229 ± 4 GPa for (001) and (100) orientations, respectively. Fully spontaneous reversible, stress–strain hysteretic curves—only manifest in the (100) orientation—are attributed to the to-and-fro motion of dislocations comprising incipient kink bands in the {100}<0
 0> slip system.
I. INTRODUCTION
Single-crystal rutile (TiO2), a wide band gap semiconductor, is one of the most suitable materials for spectral prisms and polarizing devices such as, optical isolators and beam displacers because of its large birefringence. Rutile is popular among experimentalists because of the ease of fabrication in single crystal, thin film as well as polycrystalline form.Reference Diebold1 It has also been used for a wide range of important technological applications; for example, as a photocatalyst in solar cells,Reference Park, Lagemaat and Frank2 as a gas sensor,Reference Matsuura3 as optical coatings,Reference Okimura, Maeda and Shibata4 as biocompatible bone implants,Reference Feng, Chen, Qi, He, Zhao and Zhang5 and as a gate insulator for MOSFET devicesReference Kadoshima, Hiratani, Shimamoto, Torii, Miki, Kimura and Nabatame6 among others. In all these applications, a detailed knowledge of its mechanical deformation behavior is of great importance for better design and stability of the devices.
Using an etch-pit technique, Hirthe and BrittainReference Hirthe and Brittain7 were the first to report on dislocations on the {101} and {110} planes in rutile single crystals. They also showed evidence for {100} slip in rutile. Later, most of the work on the deformation of TiO2 single crystals was performed by bulk mechanical tests at high temperatures, typically above 850 °C.Reference Ashbee and Smallman8, Reference Blanchin, Bursill and Lafage9 Ashbee and SmallmanReference Ashbee and Smallman8 reported that only the {101}
 slip system gets activated during compression along the [001] and [100] directions. However, when single crystals were compressed 45° to [100] direction, the presence of {110}<001> slip was also observed, along with those due to {101}
 . Using Knoop indentations, Li and BradtReference Li and Bradt10, Reference Li and Bradt11 confirmed that the predominant slip systems observed when TiO2 single crystals were indented along [001] were {101}
 . When indented along the [100] direction, they also reported {110}<001> slip along with {101}
 slip.
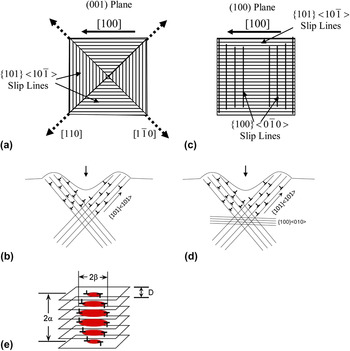
If the aforementioned slip systems are correct, it follows that when a (001) rutile surface is indented, the slip line pattern, shown in Fig. 1(a), would be characterized by 4-fold symmetry. Each quadrant should have a set of parallel {101} slip lines. As the slip systems intersect, cleavage cracks, along {110}, denoted as thick dashed diagonal lines in Fig. 1(a), should emerge. A schematic cross-sectional view of what presumably occurs under the indenter due to this slip system is shown in Fig. 1(b).
(a) Schematics of slip lines and cleavage cracks and (b) the corresponding cross-sectional view, predicted for indentation on a (001) rutile single crystal. The thin lines represent slip lines, and the thick dotted lines represent the cleavage cracks. (c, d) Similar schematic for indents on the (100) rutile single-crystal surface. (e) Schematic of an incipient kink band with dimensions, 2α and 2β. D is the distance between dislocation loops along 2 α.

The situation when the (100) surface is indented is more complicated. As shown in Fig. 1(c), there should be a set of parallel slip lines, due to dislocation glide on two planes that belong to the same slip system activated in the (001) case, viz. {101} . As discussed below, indentation on the (100) plane should also activate the {100}
 slip system, which should from slip lines perpendicular to the lines due to {101}
 slip. Although the (100) surface is initially perpendicular to the indentation axis, dislocations start nucleating in these planes due to bending during indentation. This scenario is similar to that observed for indentations on the (0001) surface in ZnO single crystals.Reference Basu and Barsoum12 The intersection of different slip planes, during indentation on the (100) surface, becomes clearer in cross section [Fig. 1(d)].
A. Spherical nanoindentation
Only a few nanoindentation (NI) studies on single-crystal TiO2 exist, most of those reported on its hardness and elastic moduli using a Berkovich tip.Reference Mayo, Siegel, Narayanasamy and Nix13, Reference Kurosaki, Setoyama, Matsunaga and Yamanaka14 Olofinjana et al.Reference Olofinjana, Bell and Jamting15 calculated stress–strain curves on sol–gel deposited TiO2 thin films using a 10-μm spherical nanoindenter tip. But, the sol–gel deposited thin films were not epitaxial or single crystalline, and the lower moduli values showed significant effects from the substrates.
Despite its importance, as far as we are aware, no systematic study exists that explores the entire NI stress–strain regime of single-crystal TiO2. Recently, we developed a method to convert spherical NI load–displacement curves to NI stress–strain curvesReference Basu, Moseson and Barsoum16, Reference Moseson, Basu and Barsoum17 and used this technique to shed important light on the deformation of oxide and nitride single crystals, such as sapphire,Reference Basu, Barsoum and Kalidindi18 ZnO,Reference Basu and Barsoum12 LiNbO3,Reference Basu, Zhou and Barsoum19 mica,Reference Basu, Zhou and Barsoum20, Reference Barsoum, Murugaiah, Kalidindi and Zhen21 BaTiO3,Reference Buchs, Basu, Elshrief, Coward and Barsoum22 and GaN.Reference Basu, Barsoum, Williams and Moustakas23 The details of the technique can be found elsewhere.Reference Basu, Moseson and Barsoum16, Reference Moseson, Basu and Barsoum17 The indentation stress and strain, parallel to the indentation direction, can be defined as  and
 , respectively, where P is the applied indentation load, R is the indenter tip radius, and a is the contact radius. In the elastic regime, the indentation stress and strain are related by
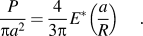
where E* is a reduced modulus given by

where ν and E are Poisson’s ratio and elastic modulus. The subscripts “s” and “i” represent the sample and indenter, respectively. The elastic modulus, E i, and Poisson’s ratio, ν i, for the diamond indenter tip are assumed to be 1140 GPa and 0.07, respectively. The elastic modulus of the sample can be estimated from the contact stiffness, S, versus contact radius, a, plots, based on the relationshipReference Basu, Moseson and Barsoum16, Reference Moseson, Basu and Barsoum17, Reference Sneddon24:

Herein, to study the complete microscale deformation behavior, we generated spherical NI stress–strain curves with three different tip radii on the (001) and (100) orientations of rutile single crystals.
B. Microscale model for kinking nonlinear elasticity
Besides plotting the complete microscale stress–strain behavior, another question we wanted to probe was whether TiO2 is a kinking nonlinear elastic (KNE) solid. Recently, we have shown that the majority of plastically anisotropic solids can deform in a fully reversible, dislocation-based, but nonlinear fashion.Reference Barsoum, Murugaiah, Kalidindi and Zhen21, Reference Barsoum, Zhen, Kalidindi, Radovic and Murugahiah25–Reference Barsoum, Basu, Buschow, Cahn, Flemings, Ilschner, Kramer, Mahajan and Veyssiere29 The signature of KNE solids is the formation of fully reversible, reproducible stress–strain loops. The latter are caused by incipient kink bands (IKBs) that are nothing but coaxial dislocation loops, stacked one on top of another in parallel slip planes [Fig. 1(e)].Reference Barsoum, Basu, Buschow, Cahn, Flemings, Ilschner, Kramer, Mahajan and Veyssiere29 The IKB geometry is such that the loops remain extended only if a load is applied; removal of the load results in their spontaneous annihilation.Reference Barsoum, Basu, Buschow, Cahn, Flemings, Ilschner, Kramer, Mahajan and Veyssiere29 The detailed analysis of IKB formation and KNE behavior of solids has been reported in Ref. Reference Barsoum, Basu, Buschow, Cahn, Flemings, Ilschner, Kramer, Mahajan and Veyssiere29. To date, we have shown that a sufficient condition of a solid to be KNE is plastic anisotropy. And since, in general, most ionic ceramics, including TiO2, are plastically anisotropic, we expected it to be a KNE solid as well. It is important to note here that by plastic anisotropy we only mean that the dislocations are confined to certain very specific directions and not necessarily that the critical resolved shear stresses are vastly different. The latter definition is more common in metallurgy. For this work, we only mean that the dislocations are confined to two dimensions.
The plastic anisotropy of the TiO2 crystal can be envisioned from the available slip systems in different orientations. Although the Schmid factor for the primary slip system {101} is the same for indentations along the [001] and [100] directions, only two out of four of these slip planes are available in the latter orientation. The activation of other slip systems due to bending complicates the exact determination of the critical resolved shear stress of each slip system during indentation. The one potential complication that was not clear at the outset of this work is whether, in addition to plastic anisotropy, it was also necessary for the operative slip system resulting in the IKBs to not intersect with other slip systems. As shown herein it appears that at least at the loads and the stresses applied here, TiO2 does exhibit some reversible dislocation activity. In this respect, it is not unlike our recent work on BaTiO3, another pseudocubic crystal.Reference Buchs, Basu, Elshrief, Coward and Barsoum22
In bulk samples, the threshold stresses for kinking is usually small.Reference Barsoum, Zhen, Zhou, Basu and Kalidindi27–Reference Barsoum, Basu, Buschow, Cahn, Flemings, Ilschner, Kramer, Mahajan and Veyssiere29 In high quality, brittle, single crystals, on the other hand, indented with spherical nanoindenters, the initial response is almost always elastic, followed by pop-in events that can be quite large.Reference Basu and Barsoum12, Reference Basu, Moseson and Barsoum16, Reference Basu, Zhou and Barsoum19, Reference Basu, Zhou and Barsoum20 During these pop-in events, the single crystal is subdivided into a multitude of smaller domains—in essence, the single crystal is transformed into a polycrystal under the nanoindenter.Reference Basu, Barsoum and Kalidindi18, Reference Barsoum, Basu, Buschow, Cahn, Flemings, Ilschner, Kramer, Mahajan and Veyssiere29 When the indenter is unloaded and reloaded into the same location multiple times, to the “same” maximum stress, one of two responses is typically observed: classic work hardening, characterized by the absence of loops, or loops whose area continually decrease with cycle number until the response becomes fully elastic.Reference Basu and Barsoum12, Reference Basu, Moseson and Barsoum16, Reference Buchs, Basu, Elshrief, Coward and Barsoum22 In other words, the material cyclically work hardens under the indenter. The second response is one in which the loop areas reach a limiting, steady-state value, that is no longer a function of cycling.Reference Basu and Barsoum12, Reference Basu, Moseson and Barsoum16, Reference Basu, Barsoum and Kalidindi18, Reference Basu, Zhou and Barsoum19, Reference Buchs, Basu, Elshrief, Coward and Barsoum22, Reference Basu, Barsoum, Williams and Moustakas23 The latter are considered to be KNE, wherein IKBs nucleate within the domains that form during the first pop-in. Using this method, we have shown that Ti3SiC2,Reference Murugaiah, Barsoum, Kalidindi and Zhen30 Ti2AlCReference Zhou, Barsoum, Basu, Kalidindi and El-Raghy31 and single crystals of LiNbO3,Reference Basu, Zhou and Barsoum19 C-plane ZnO,Reference Basu and Barsoum12 sapphire,Reference Basu, Barsoum and Kalidindi18 mica,Reference Basu, Zhou and Barsoum20, Reference Barsoum, Murugaiah, Kalidindi and Zhen21 graphite,Reference Barsoum, Murugaiah, Kalidindi and Gogotsi26 and BaTiO3Reference Buchs, Basu, Elshrief, Coward and Barsoum22 are all KNE solids. At this juncture, it is useful to briefly review the model we developed to understand this intriguing phenomena.
Our modelReference Barsoum, Basu, Buschow, Cahn, Flemings, Ilschner, Kramer, Mahajan and Veyssiere29 is based on the work done by Frank and StrohReference Frank and Stroh32 (F&S). In what follows a simplified version is presented. F&S considered an elliptic kink band (KB) with length 2α and width 2β such that α >> β [Fig. 1(e)] and showed that the remote shear stress, τ, needed to render such a subcritical KB unstable—i.e., grow spontaneously—is given by

where σ t and τ t are the threshold applied and shear stresses, respectively; G, b, and w are, respectively, the shear modulus, Burgers vector, and a term related to the dislocation width.Reference Frank and Stroh32M is a Taylor-like factor relating the shear stress at the domain/grain level to the macroscopically applied NI stress. Since the maximum shear stress under an indenter, τ, should be less than the applied stress of σ, the minimum value for M can be shown, from Hertzian analysis, to be ∼2.Reference Hertz33
The critical shear angle, γ c, can be estimated fromReference Frank and Stroh32:

where D is the distance between two consecutive parallel dislocation loops comprising an IKB [Fig. 1(e)]. τ c is the critical local shear stress needed to nucleate the dislocation loops. Typically, for ionic crystals, τ c ≈ G/15. It follows that at 0.14 rad, γ c is small.
As noted above, an IKB consists of multiple parallel dislocation loops [Fig. 1(e)]. As a first approximation, each dislocation loop can be assumed to be composed of two edge and two screw dislocation segments with lengths, 2β x and 2β y, respectively. We assume that when σ > σ t, the IKBs grow by increasing their width, 2β, according to,Reference Barsoum, Basu, Buschow, Cahn, Flemings, Ilschner, Kramer, Mahajan and Veyssiere29, Reference Frank and Stroh32

for the edge and the screw components, respectively.
The nonlinear strain due to these elliptical IKBs is thus given byReference Zhou, Basu and Barsoum28
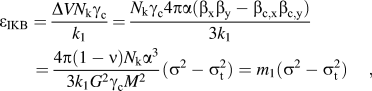
where N k is the number of IKBs per unit volume and, k 1 is a factor for converting volumetric strain to linear strain, assumed to be 2 here.Reference Zhou, Basu and Barsoum28, Reference Barsoum, Basu, Buschow, Cahn, Flemings, Ilschner, Kramer, Mahajan and Veyssiere29β c,x and β c,y are the critical values of β along the edge and screw components, respectively.
If Ω is the energy dissipated by a dislocation line sweeping a unit area, then the energy dissipated per cycle per unit volume, W d, can be expressed asReference Barsoum, Zhen, Zhou, Basu and Kalidindi27–Reference Barsoum, Basu, Buschow, Cahn, Flemings, Ilschner, Kramer, Mahajan and Veyssiere29

The main purpose of this study is to shed some light on all of these aspects as they relate to the highly localized deformation of TiO2 single crystals with two different orientations. We do so, principally, by converting the NI load–displacement results to NI stress–strain curves. Cyclic spherical NI experiments were carried out in the same locations of both the (001) and (100) planes.
II. EXPERIMENTAL DETAILS
Two rutile single crystals with (001) and (100) orientations were purchased (MTI Corporation, Richmond, CA). The NI experiments were performed at room temperature with a nanoindenter (XP system; MTS Corp., Oak Ridge, TN), equipped with a continuous stiffness measurement attachment. Three diamond hemispherical indenters with radii, R, of 13.5 μm, 5 μm, and 1.4 μm were used. The loading rate/load ratio was constant at 0.1. Typically, the tip was indented into the same location at least five times at a given load; in some cases, the indenter was indented 10 times in the same location. When needed, the load–displacement results were zero-point corrected.Reference Moseson, Basu and Barsoum17 Typically, a 3 × 3 array of indentations—100–200 μm apart—was performed on each surface. The elastic modulus and hardness on both (001) and (100) orientations were also measured using a diamond Berkovich tip.
The Vickers hardness, V H, values of the two surfaces were also measured as a function of load, using a microhardness tester (Leco M400; Leco Corp., St. Joseph, MI).
Postindentation surface features were examined using an optical microscope (OM) (Olympus PMG3; Olympus, Japan) and scanning electron microscope (SEM) (FEI XL30; FEI Corp., Hillsboro, OR, and a Zeiss Supra 50VP; Carl Zeiss, Thornwood, NY).
III. RESULTS
A. Nanoindentation stress–strain analysis
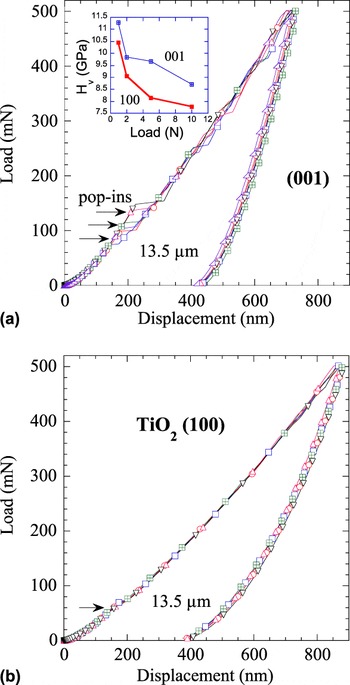
Figures 2(a) and 2(b) show typical load versus displacement curves obtained when various locations are indented with the 13.5-μm tip on the (001) and (100) surfaces, respectively. The (001) indents [Fig. 2(a)] are characterized by pop-ins (denoted by short horizontal arrows) of the order of ≈50 nm in the 80–150 mN load range. Note that in many locations, multiple pop-in events are observed. When the (100) surface is indented [Fig. 2(b)], the pop-ins, again denoted by a horizontal arrow, obtained are significantly smaller. In both cases, the reproducibility of the results from location to location is noteworthy.
Typical spherical nanoindentation (NI) load–displacement curves for multiple locations on the (a) (001) surface and (b) (100) surface, when rutile single crystals were loaded up to 500 mN with the 13.5-μm tip. The horizontal arrows point to the sudden displacement bursts, or pop-ins, during loading. Note that the displacements during pop-ins are much larger in the case of the (001) orientation. The inset in (a) shows the variation in Vickers hardness, at different loads, for both the (001) and (100) surfaces.

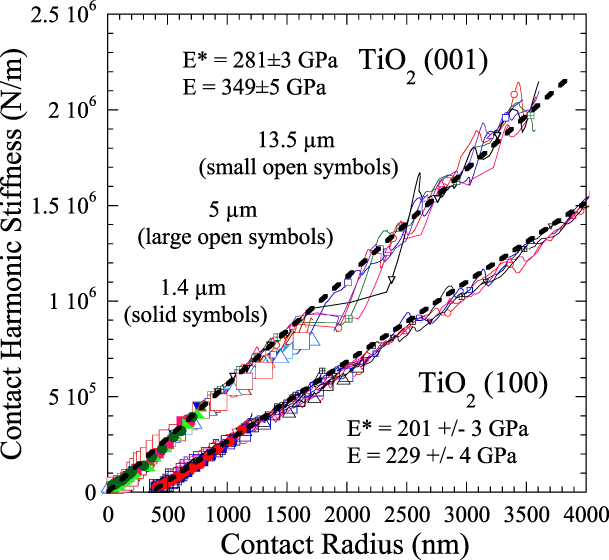
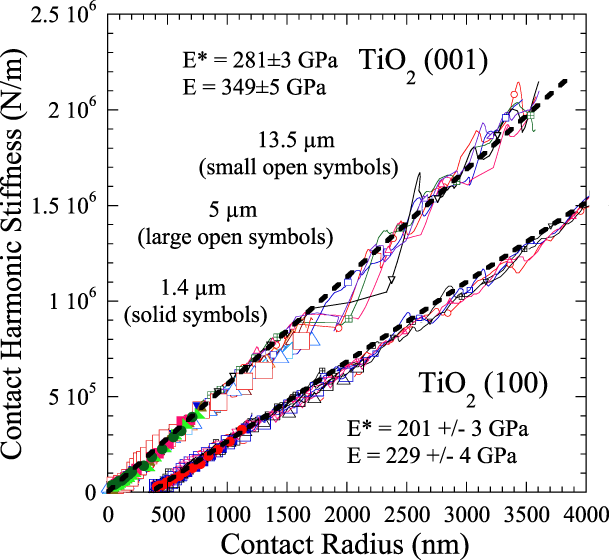
As expected, the S versus a plots (Fig. 3), for the various tips, in different locations, fall on a straight line. The agreement between the results with the different tip sizes is noteworthy and validates the accuracy of our method of calculating NI stress–strain curves, outlined above. Making use of Eqs. (2)and (3), least-squares fits of the various locations yield an average elastic modulus for the (001) plane, E 001, of 349 ± 5 GPa (Fig. 3; lines going through origin). At 229 ± 4 GPa, the average elastic modulus for the (100) surface, E 100, is significantly lower (Fig. 3, curves shifted to the right). When we measured the elastic moduli of the same surfaces using a Berkovich NI, the results—390 ± 2 and 218 ± 4 GPa for the (001) and (100) surfaces, respectively—are comparable to the values computed from spherical NI.
Contact stiffness, S, versus contact radii, a, results for the (001) and (100) orientations with the 1.4-, 5-, and 13.5-μm tip sizes. The plots for (100) orientation are shifted to the right for clarity.
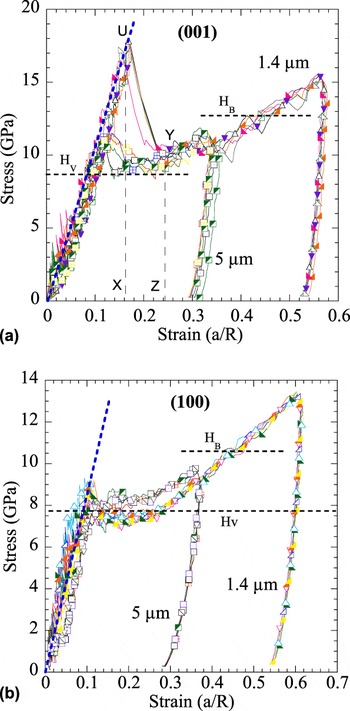
When the results for the (001) surfaces are converted to NI stress–strain curves [Fig. 4(a)], they are characterized by an initial linear region, with a slope that corresponds to the elastic moduli obtained from the S versus a curves [inclined dashed lines in Fig. 4(a)] prior to the pop-ins. During the pop-ins, the stress drops precipitously, before going through a shallow minimum around ≈10 GPa. At strains >0.15, strain hardening at a rate of ≈16 ± 5 GPa is observed. Given that the results for the 13.5-μm tip (not shown) are almost identical to those for the 5-μm tip, it follows that stress–strain curves are not functions of tip radii, indirectly verifying our methodology of converting load–displacement curves to NI stress–strain curves. The shallow minimum value is in good agreement with the Vickers hardness value of 8.7 ± 0.2 GPa [horizontal dashed line in Fig. 4(a)] measured at 10 N [inset in Fig. 2(a)] for the same surface. In our previous work,Reference Basu and Barsoum12, Reference Basu, Moseson and Barsoum16, Reference Basu, Zhou and Barsoum19, Reference Buchs, Basu, Elshrief, Coward and Barsoum22 a good correlation between the minima in the NI stress–strain curves after the pop-ins and the H V values was observed. The results of this work confirm this notion. The hardness value measured from Berkovich NI, H B, on the (001) surface is 12.7 ± 0.1 GPa.
Spherical NI stress versus strain curves for 1.4-μm and 5-μm indents in various locations on the (a) (001) surface, and (b) (100) surface. The dotted inclined lines that go through the origin represent the linear elastic response. The dotted horizontal lines represent the Vickers microhardness and hardness measured from Berkovich NI. H V is about 8.7 and 7.8 GPa for the (001) and (100) orientations, respectively, and H B is about 12.7 and 10.6 GPa for the (001) and (100) surfaces, respectively.

The stress–strain curves for NI on (100) plane [Fig. 4(b)] show similar features to those obtained on the (001) surface; a linear elastic regime, smaller pop-ins, followed by a region of low, or no, work hardening, followed by work hardening. Although the 13.5 μm (not shown) and 5 μm results are almost identical, for reasons that are not clear, the 1.4-μm stress–strain curves exhibit slightly lower minima, but then ultimately, higher work hardening rates. In this orientation, at ≈7.8 ± 0.1 GPa, V H at 10 N [inset in Fig. 2(a)] is, again, in good agreement with the minima of the stress–strain curves after the pop-ins. The Berkovich hardness, H B, for this orientation is 10.6 ± 0.1 GPa. Gratifyingly, both the NI and the Vickers hardness results show that the (001) surface is about 10% harder than the (100).
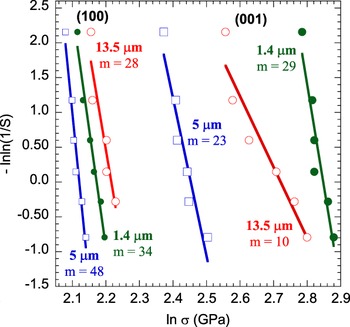
Figure 5 plots the Weibull distributions of the pop-in stresses, σ pop-in, for the (001) and (100) planes, from which it is obvious that these stresses are (i) higher for the (001) surface and (ii) a function of indenter radius with a wider spread for the (001) surface.
Weibull plots of pop-in stresses in the (001) and (100) surfaces for the 1.4-, 5-, and 13.5-μm tip sizes. Note that the (001) orientation exhibits high pop-in stresses for all three tip sizes, and the high Weibull moduli, m, for both orientations, represent a uniform initial defect distribution in the single-crystal samples.

B. Microstructural examination
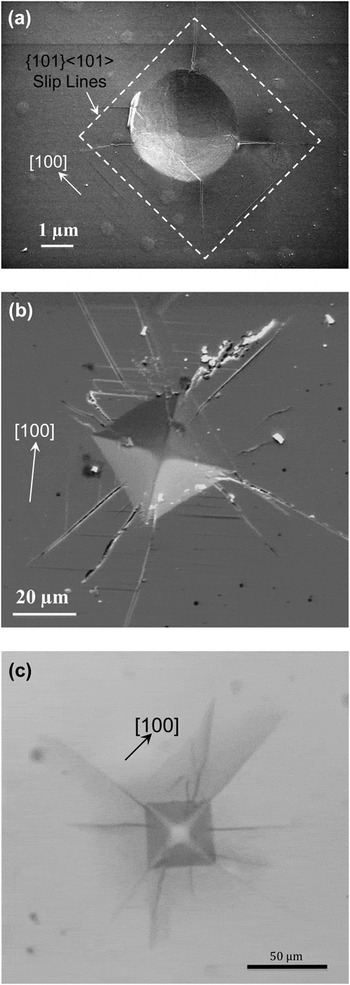
When the spherical NI marks, on the (001) plane, were imaged in a SEM [Fig. 6(a)], a clear 4-fold pattern was observed. The same was true when the same surface was indented with the Vickers indenter [Figs. 6(b) and 6(c)].
(a, b) Scanning electron microscope (SEM) and (c) optical microscope (OM) images of the (001) surface indented with (a) the 5-μm spherical nanoindenter and (b), (c) the Vickers microindenter. Note the 4-fold symmetry of slip lines and cleavage cracks.

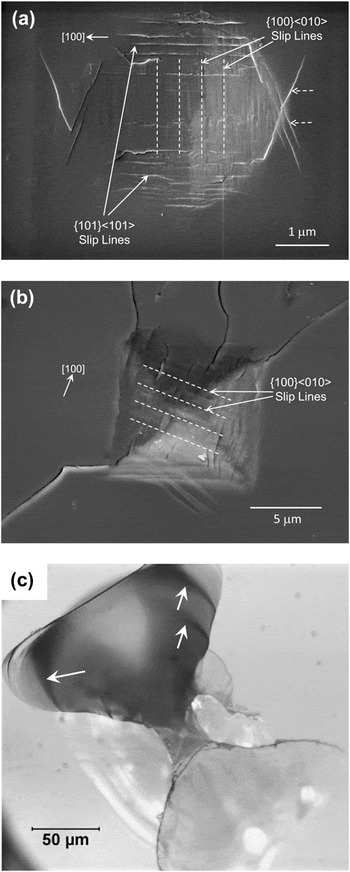
When the spherical indents in the (100) plane were imaged in a SEM [Fig. 7(a)] or the Vickers indents under a SEM [Fig. 7(b)] and an OM [Fig. 7(c)], as anticipated a more complicated picture emerges. A parallel set of slip lines—presumably due to two slip systems in the {101} family—was observed [Fig. 7(a)]. There were another set of slip lines [dashed lines in Fig. 7(a)] perpendicular to the {101}
 slip, which are most likely due to {100}
 slip as discussed above [Fig. 1(c)]. There were also two sets of inclined slip lines—denoted by dashed arrows in Fig. 7(a)—on two sides of the indents, which are most probably due to slip on {110}<001> planes, or initially inactive {101}
 planes, that get activated during the high strain deformation under the NI.
(a) SEM micrograph of the (100) surface indented with the 5-μm spherical nanoindenter. (b) SEM micrograph of the same surface indented with the Vickers microindenter at 5 N load. The dashed lines in both (a) and (b) show the orientation of slip lines presumably caused by {100} dislocations. In (a), the {101}
 slip lines are also indicated. (c) OM image of a 10 N Vickers microindent on the (100) surface. Note the 2-fold symmetry of the deformation region around the indent. The arrows indicate the semicircular slip lines, most probably due to {100}
 slip.

C. Cyclic nanoindentation
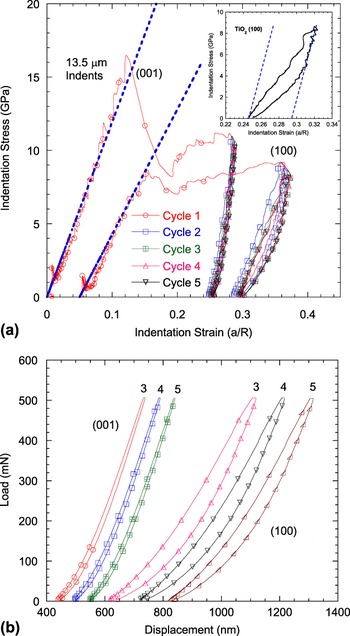
Figure 8(a) compares the cyclic NI stress–strain curves when the 13.5-μm tip was indented five times, to the same maximum load, into the same location of the (001) and (100) surfaces. The inset shows typical NI stress–strain response during the fifth cycle when the (100) surface is indented. The cyclic stress–strain response from (100) orientation clearly exhibits fully reversible hysteresis, whereas the (001) orientation shows almost no energy dissipation.
(a) Spherical NI stress–strain response when a 13.5-μm spherical tip is cyclically loaded five times, up to 500 mN, in the same location on the (001) and (100) surfaces. The inset shows a magnified plot of cycle 5 on the (100) surface, where the fully reversible hysteretic behavior is clearly evident. (b) Load–displacement plots for cycles 3–5 for the 13.5-μm indents on the (001) and (100) surfaces. Each cycle is shifted for clarity. Note that the area inside the load–displacement curves is slightly reduced from cycle 3 to cycle 4, after which it is almost identical to cycle 5.

This observation is confirmed when load–displacement cycles 3, 4, and 5, for 13.5-μm indents on both surfaces are compared [Fig. 8(b)]. Clearly, the cycles obtained when the (001) surface is indented are smaller than when the (100) surface is indented. Furthermore, after decreasing slightly from cycles 3 to 4, the size of the loops appears to stabilize with little differences in area between cycles 4 and 5.
IV. DISCUSSION
Before discussing the NI stress–strain curves, it is important to compare the elastic moduli and hardness results with literature values. Starting from single-crystal elastic constants,Reference Wachtman, Tefft and Lam34, Reference Chang and Graham35 Li and BradtReference Li and Bradt11 calculated E 001 and E 100 to be 385.8 and 147.3 GPa, respectively. And while the former is reasonably close to both spherical and Berkovich values measured herein, the latter is significantly lower. The reasons for this discrepancy are not clear at this time.
The hardness values for both (001) and (100) orientation of rutile TiO2 reported herein [Figs. 4(a) and 4(b)] are also in excellent agreement—both in their absolute and relative values—to those Li and Bradt measured using a Knoop indenter at 3 N.Reference Li and Bradt10 However, although the effective resolved shear stress (ERSS) diagrams presented in their work for (001) and (100) planes correspond to an inverse trend of hardness, the magnitude of the net ERSS for (001) plane was roughly double that for (100) plane. This in turn should imply that the hardness of the (100) plane should be higher. It is not entirely clear what may cause the discrepancy between the magnitude of net ERSS and hardness, which is assumed to be inversely proportional to net ERSS. One possible reason might be consideration of different slip systems that are activated in (001) and (100) orientations. More work is indicated here, possibly NI with a Knoop indenter and careful microscopy of the indented region.
We have argued several times in our previous NI workReference Basu and Barsoum12, Reference Basu, Zhou and Barsoum19, Reference Buchs, Basu, Elshrief, Coward and Barsoum22, Reference Basu, Barsoum, Williams and Moustakas23 the magnitude of the pop-in displacements during NI is related to the strain energy released at pop-in. This is best seen in Fig. 4(a), where it is clear that the areas OUX and UXZY are comparable. The same is true of all the other stress–strain curves shown here. Moreover, since C44 for rutile is ≈124 GPaReference Isaak, Carnes, Anderson, Cynn and Hake36 and the maximum pop-in stress measured herein for the (001) surface is of the order of 18 GPa [Fig. 4(a)], it follows that the maximum shear stresses at the pop-ins—τ pop-in ≈ σ pop-in/2—are of the order of ≈C44/14. In other words, in some regions τ pop-in is of the order of the theoretical strength of rutile. Based on these results, it is reasonable to conclude that the pop-in events are due to the homogeneous nucleation and/or multiplication of dislocations that results in the reduction of stress at the pop-ins. This conclusion is consistent with the previous observations in NI studies of single-crystal materials.Reference Lorenz, Zeckzer, Hilpert, Grau, Johansen and Leipner37, Reference Schuh, Mason and Lund38
It is also important to note here that the pop-in stress during NI experiments, when the material deformation changes from elastic to elastic–plastic, gets affected by preexisting dislocations near the surface.Reference Morris, Bei, Pharr and George39 Consistent with this view is the fact that the stresses at which the pop-ins are triggered are related to an initial, or intrinsic, defect concentration and thus can be well described by Weibull statistics.Reference Basu and Barsoum12, Reference Basu, Zhou and Barsoum20, Reference Buchs, Basu, Elshrief, Coward and Barsoum22 Not surprisingly, the same is true here. In principle, using sharper tips should result in higher σ pop-in as the volume probed is smaller and the probability of finding a preexisting flaw decreases. Clearly, that is the case between the 5-μm and 1.4-μm indenters on both (001) and (100) orientations (Fig. 5). However, the pop-in stresses for the 13.5-μm indenter straddle those of the 5- and 1.4-μm indenters for the (001) plane, and they are higher than both the 5- and 1.4-μm indenters for (100) orientation. This most probably suggests that different defect distributions exist at different depths or length scales, both along and perpendicular to the indentation axis, as a result of polishing, for example. This comment notwithstanding, more work on single crystals with controlled defect sizes and distributions is needed to better understand the effects of initial defect distribution. This result, however, suggests that once understood, and say correlated to defect structure, plots such as those in Fig. 5 could become a powerful, nondestructive quality control tool for crystal growers and device makers. Compared with some of our previous works,Reference Basu and Barsoum12, Reference Basu, Zhou and Barsoum20, Reference Buchs, Basu, Elshrief, Coward and Barsoum22 the Weibull moduli for the surfaces measured herein are relatively high, indicating that the intrinsic defect distribution is quite uniform at the length scales studied here.
Consistent with some of our previous work,Reference Basu and Barsoum12, Reference Basu, Zhou and Barsoum19, Reference Basu, Barsoum, Williams and Moustakas23 the stress–strain curves under the NI are weakly dependent on the strain rate at which the dislocation distribution was reached. This is best seen in Fig. 4(a), where the NI stress–strain at strains >0.24 for the 5-μm tip are almost identical to those for the 1.4-μm tip that presumably reached the same strain at a significantly higher strain rates. Said otherwise, it is reasonable to assume that the dislocation/domain distributions that form under a NI are independent of the rate at which the distribution is reached.
When the SEM micrographs (Fig. 6) are combined with the micrographs observed by Ashbee and Smallman,Reference Ashbee and Smallman8 we conclude, like them, that during the deformation in the [001] direction, the active slip system is {101} . The crack patterns seen in Fig. 6(a) are consistent with the conclusion that they are either due to the intersection of {101}
 slip systems or due to cleavage cracks along the {110} planes. For the Vickers indents, two sets of cracks are observed (i) at the intersection of the slip planes [e.g., Fig. 6(b)] and (ii) at the corners of the Vickers indentations [e.g., Fig. 6(c)]. The latter are geometrical in nature, whereas the former are crystallographic. Presumably it is when the slip systems intersect that the work hardening, observed in Fig. 4(a), is initiated. More NI work, where the indentations are interrupted at various strains, would need to be carried out to confirm this conjecture, however.
The fact that two different slip systems—viz., {101} and {100}
 —are activated in the (100) orientation (Fig. 7), and most probably at two different critical resolved shear stresses, is consistent with the observed lower initial work hardening [Fig. 4(b)]. Other evidence for the activation of {100}
 slip is shown in the OM micrograph of a Vickers indent on the (100) surface [Fig. 7(c)]. The 2-fold symmetry of the butterfly shape is believed to be due to the rotation of the {100} planes, in which the slip direction is initially perpendicular to the indentation axis, followed by slip on them that ultimately intersects the free surface causing the large delaminated regions and the butterfly or hourglass shape seen in Fig. 7(c). It is reasonable to assume that when the deformation is less severe, such as under a spherical nanoindenter [Fig. 7(a)], the dislocations on the {100}
 slip system can form dislocation domains, where IKBs can be nucleated (see below). This situation is quite analogous to basal slip observed in hexagonal KNE solids when loaded along [0001].Reference Basu and Barsoum12, Reference Basu, Barsoum and Kalidindi18–Reference Basu, Zhou and Barsoum20, Reference Basu, Barsoum, Williams and Moustakas23, Reference Murugaiah, Barsoum, Kalidindi and Zhen30 Note that, in the (100) orientation, the cracks shown around Vickers indents [Figs. 7(b) and 7(c)] are mostly geometric and not crystallographic.
After severe plastic deformation (i.e., very high strains), the domains become extremely small, which according to Eq. (4), would cause the IKB nucleation stresses to increase. In principle, if the domain size is small enough, the stresses calculated from Eq. (4), may approach C44/15 and thus the response would become linear elastic. In more classical metallurgical terms, we can say that the volume under the indenter work hardened.
The side-by-side comparison between NI stress–strain curves [Fig. 8(a)] again confirms the conclusions reached above that the (001) surface is stiffer, harder, and work hardens at a faster rate than its (100) counterpart. From these results, it is also clear that the (001) orientation dissipates considerably less energy, during each cycle, than the (100) orientation.
The fact that the energy dissipation during cyclic NI, especially in the (100) orientation, stabilizes within three cycles [Fig. 8(b)] suggests that the observed energy dissipation is not due to friction or work hardening but due to IKB formation, most probably along the {100} slip system. It is interesting to note here that the activation of different slip systems and interactions between dislocations in different slip planes during NI in the (001) and (100) orientations may also result in some hysteresis, but it cannot explain the complete reversibility of the cyclic stress–strain curves.
As noted earlier, our microscale modelReference Barsoum, Zhen, Zhou, Basu and Kalidindi27, Reference Barsoum, Basu, Buschow, Cahn, Flemings, Ilschner, Kramer, Mahajan and Veyssiere29 explains the results strictly on the growth and shrinkage of IKBs. How the IKBs nucleate is unclear at this time. However, given the statistical nature of the elastic–plastic transition processes observed in pop-in stresses (Fig. 5), it is reasonable to assume that IKB nucleation may also depend on preexisting defects. This comment notwithstanding, in general all the pop-in stresses measured in this work are significant fractions of C44. In other words, we are close to the theoretical limits of the bonds.
At a stress of 9 GPa, the IKB strain, ε IKB, approximated from the distance between two lines drawn parallel to the initial loading and unloading portions of the reversible hysteretic cycles [see inset in Fig. 8(a)], was of the order of 0.043 ± 0.001, and W d was of the order of 133 ± 17 MJ/m3. Using those values in Eq. (8), assuming k 1 = 2, results in a Ω/b of ≈516 MPa. Although this value is considerably higher than the critical resolved shear stresses in rutile under compression at high temperature,Reference Ashbee and Smallman40 it is comparable to our previously reported Ω/b values for basal plane dislocations in ZnOReference Basu and Barsoum12 and LiNbO3.Reference Basu, Zhou and Barsoum19 We note in passing that we have shown in previous work that the critical resolved shear stress (CRSS) follows a Hall–Petch relationship and hence the smaller the domain sizes created during the pop-in process the higher the value of the CRSS.Reference Zhou and Barsoum41, Reference Anasori42
To further examine the notion of KNE behavior, we carried out the following calculations on the repeat cycles of the 13.5-μm indents. In Eq. (5) assuming τ c = G/14 GPa (shear stress at pop-in), G ≈ C44 = 124 GPa, Poisson’s ratio, ν = 0.25,Reference Ma, Liang, Miao, Bie, Zhang, Xu and Jiang43 a Burgers vector of 0.296 nm,Reference Ashbee and Smallman8 and w = b yields a γ c ≈ 0.12 rad.
It is difficult to determine σ t from the results shown in Fig. 8(a) or its inset. To determine σ t accurately, nested loops need to be obtained, as demonstrated in the case of LiNbO3.Reference Basu, Zhou and Barsoum19 The loops obtained in this work, however, are too small to accurately obtain nested loops. At this stage, we can only guess the value of σ t based on previous work. In our work on LiNbO3-for which the largest NI loops were recorded—σ t for the 13.5-μm indenter was 1.2 GPa. The corresponding domain size, assuming M = 2, was 309 nm. Given that G for LiNbO3 is roughly half that of TiO2 and the loops are significantly smaller, it is reasonable to assume that 2α for TiO2 would be smaller than, and σ t higher than, those of LiNbO3. Assuming σ t ≈ 4 GPa implies 2α is ≈115 nm. This value of 2α compares favorably with our previous work on ZnO,Reference Basu and Barsoum12 GaN,Reference Basu, Barsoum, Williams and Moustakas23 and LiNbO3Reference Basu, Zhou and Barsoum19 single crystals. Furthermore, N kα 3 calculated from Eq. (7) is a very plausible 2.7. Given all the simplifying assumptions made in deriving our model, the highly nonuniform nature of the stress fields under the indenter, and most importantly the absence of any adjustable parameters, apart from assuming M and k 1 to be equal to 2, the obtained results have to be considered reasonable.
While the aforementioned calculations do not prove that IKBs exist, or are responsible for the nonlinear strains and W d values observed, they certainly do not eliminate them as a plausible mechanism. It is thus reasonable to conclude that it is the to-and-fro reversible motion of IKB dislocations that is responsible for the reversible hysteretic loops observed when the (100) surface is repeatedly indented in the same location.
Last, it is crucial to note the fact that the areas of the loops, formed when the (001) surface is repeatedly indented [see Fig. 8(b)], are significantly smaller than those on (100) is strong evidence that these reversible loops obtained are not experimental artifacts. More importantly, since crack patterns formed on both surfaces (Figs. 6 and 7), it is clear that cracks per se do not lead to reversible hysteretic loops whose area is not a function of number of cycles.
V. SUMMARY AND CONCLUSIONS
By converting spherical NI load–displacement curves to stress–strain curves, together with postindentation SEM and OM observations, we conclude that
(i) The elastic moduli, during spherical NI, for high-quality rutile single crystals—determined from S versus a plots—were 349 ± 5 and 229 ± 4 GPa for (001) and (100) orientations, respectively.
(ii) At stresses of the order of 9 GPa, small pop-ins are observed for the (100) surface. The pop-in stresses can be described by Weibull statistics with relatively high Weibull moduli that ranged from 28 to 48. The pop-in stresses in the (001) orientation ranged from 10 to 17 GPa and depended more on tip radius. At the pop-ins, the considerable strain energy stored is converted to massive numbers of dislocations that result in the formation of the indentation mark and the rapid reduction in the stress under the nanoindenter.
(iii) After the pop-ins, the higher hardness and hardening rates of the (001) orientation compared to (100) orientation is postulated to be due to the activation of different slip systems. In the (001) surface, four {101}
 slip planes intersect; in the (100) surface, two {101} slip planes intersect, followed by one {100} slip system.
(iv) When the same location is indented multiple times in the (100) surface, fully reversible hysteretic loops are observed during which energies of the order of 100 MJ/m3 are dissipated during each cycle. This energy dissipation is most probably due to the formation and annihilation of the dislocation loops comprising the IKBs that form in the domains that in turn form as a result of the activation of the {100}
slip system during the pop-in events.
 slip planes intersect; in the (100) surface, two {101}
 slip planes intersect, followed by one {100}
 slip system.
 slip system during the pop-in events.
As far as we are aware, this is the first time NI stress–strain curves have been used to shed important light on the elastic–plastic deformation processes in rutile single crystals under contact loading at room temperature, that would be otherwise difficult, if not impossible, to obtain.